FVG Visual Super Clean (ticks)This is a robust and highly visual indicator designed for traders utilizing Smart Money Concepts (SMC) or Inner Circle Trader (ICT) methodologies.
Its core function is to automatically identify, visualize, and manage Fair Value Gaps (FVGs) or price inefficiencies, offering deep insight into institutional order flow.
Key Features & Capabilities
Advanced FVG Detection: Accurately identifies bullish and bearish Fair Value Gaps (FVGs) based on the 3-bar pattern.
Wick vs. Body Logic: Configurable option to use candle wicks (high/low) or bodies (open/close) for FVG calculation.
Displacement Confirmation: Includes an optional filter to require price displacement (a strong close) for higher conviction setups.
Mitigation Tracking & Management: The script actively tracks how much the price has filled or "mitigated" the FVG.
Threshold Auto-Removal: FVGs that reach a user-defined mitigation percentage (mitigation_pct) are automatically removed to keep the chart clean.
Mitigated Visibility: An optional setting allows mitigated FVGs to remain visible, repainting them with a distinct "Mitigated" color (blue by default) to show the exact point of rebalance.
Visual Efficiency:
Automatic Extension: Active, unmitigated FVGs are automatically extended forward in time until they are filled or pruned.
Equilibrium Line: Draws a dotted line at the 50% level (Equilibrium) of each FVG, a key reference point in SMC/ICT trading.
Tick-Based Filtering: Allows filtering gaps by a minimum size in ticks, reducing noise from insignificant micro-gaps.
Trend Context: Integrates a configurable Moving Average (EMA or SMA) for contextual trend analysis. The MA line changes color dynamically (green/red) to quickly signal momentum.
Optimized Performance: Implements a lookback window (lookback_days) and a cleanup routine to manage the number of drawing objects, ensuring smooth performance even on low timeframes.
Ideal For:
Traders focused on SMC/ICT Order Blocks, Imbalances, and Price Delivery.
Backtesting price action strategies around institutional liquidity.
Identifying high-probability entries (e.g., at the 50% line) and targets (e.g., unmitigated gaps).
Breadth Indicators

Trend ReactorTrend Indicator to show what trend is dominating as well as when the trend is showing exhaustion and possible reversal following.

Bangladesh Time Session & Candlestick ConfirmationIt's shows the time when new york and london session colaub with candelstick confarmation.
Quantum Trend Guardian MTF v2
💎 Quantum Trend Guardian MTF
No es un simple sistema de señales:
es un asistente de tendencia y riesgo diseñado para actuar como tu guardián operativo, filtrando el mercado con precisión cuántica.
Quantum Trend Guardian MTF
Quantum Trend Guardian MTF is a multi–timeframe trend and confirmation system designed for traders who demand precision, context, and operational control.
It combines intelligent structure recognition, momentum analysis, and adaptive risk management to deliver high–probability trading signals aligned with the dominant market flow.
⚙️ Main Components
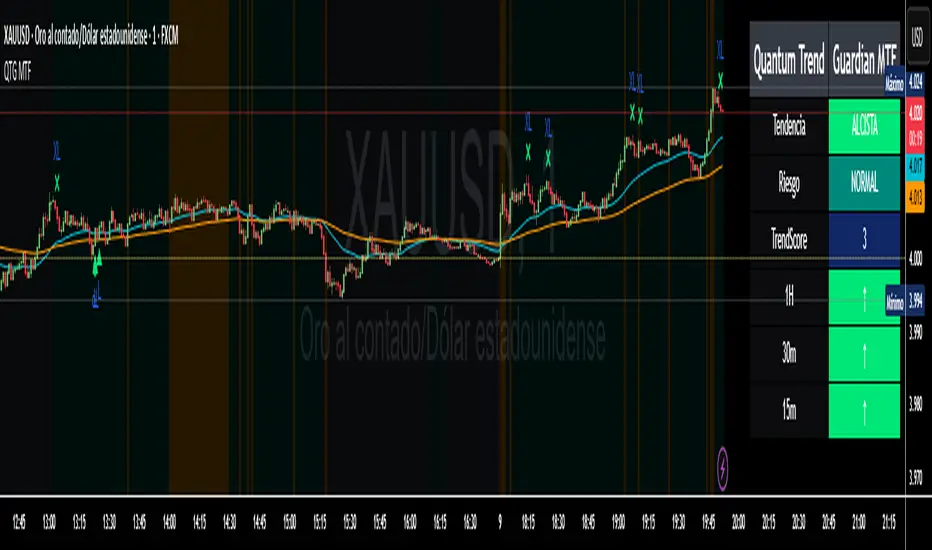
🔹 1. Guardian MTF Panel
A real–time information dashboard that displays:
Global trend direction (bullish, bearish, or neutral).
Current risk level (normal, high volatility, climax candle, or news session).
Dynamic TrendScore, measuring trend alignment across multiple timeframes.
Directional confirmation per timeframe (1H, 30m, 15m) showing whether each layer supports or contradicts the global bias.
Instantly provides a clear, structured market overview before each trade.
🔹 2. Intelligent Signal Engine
Automatically detects continuation or reversal points validated by structure, momentum, and context.
Signals are visually classified for easy reading:
Standard entries (L / S) – filtered opportunities aligned with trend and low–risk conditions.
Trend initiations (TL / TS) – when a new directional impulse is confirmed.
Exhaustion or exit points (XL / XS) – when the move shows potential fatigue.
Premium opportunities – high–quality setups during strong alignment and optimal conditions.
🔹 3. Adaptive Risk System
Evaluates market quality in real time.
It identifies conditions such as volatility spikes, climactic candles, or sensitive news windows, automatically adjusting signal generation to keep you out of unfavorable environments.
🔹 4. Trend & Structure Filters
Two operation modes:
Safe mode (trend–aligned only) – generates signals strictly in the direction of the dominant trend.
Flexible mode (structural reversals) – allows countertrend setups only when a valid structural break and momentum confirmation are detected.
This flexibility lets the indicator adapt to both trend–following and smart–reversal strategies.
🔹 5. Dynamic Visual Context
The chart background changes subtly according to trend and risk status, providing an instant visual cue on whether the current environment is favorable for trading.
⚔️ Operational Advantages
Filters out noise and countertrend entries.
Visually reveals cross–timeframe alignment.
Performs exceptionally on high–volatility assets such as XAUUSD and BTCUSD.
Fully supports customizable TradingView alerts for every signal type.
Suitable for all trading styles — scalping, intraday, or swing.
💎 Quantum Trend Guardian MTF
More than a signal generator — it’s your trend and risk guardian,
engineered to interpret market flow with quantum–level precision.
ESPAÑOL
⚙️ Componentes principales
🔹 1. Panel “Guardian MTF”
Un panel visual avanzado que muestra en tiempo real:
Tendencia global (alcista, bajista o rango).
Nivel de riesgo actual (normal, alta volatilidad, vela clímax o evento sensible).
TrendScore dinámico, que mide la alineación de tendencias entre múltiples marcos de tiempo.
Dirección individual por timeframe (1H, 30m, 15m), indicando si cada uno acompaña o contradice la tendencia principal.
Permite leer de un vistazo la estructura y condiciones globales antes de ejecutar una operación.
🔹 2. Módulo de Señales Inteligentes
Detecta automáticamente momentos de continuación o reversión validados por momentum, estructura y contexto.
Las señales se clasifican visualmente según su naturaleza:
Entradas estándar (L / S) – oportunidades filtradas por tendencia y riesgo.
Inicios de tendencia (TL / TS) – cuando se confirma un nuevo impulso direccional.
Salidas o agotamiento (XL / XS) – puntos donde el movimiento muestra fatiga.
Oportunidades Premium – movimientos de alta calidad bajo alineación total y condiciones favorables.
🔹 3. Sistema de Riesgo Adaptativo
Evalúa en tiempo real la calidad del entorno de mercado.
Identifica automáticamente situaciones de alta volatilidad, exceso de impulso, o zonas horarias sensibles, ajustando la emisión de señales para proteger al operador de entornos desfavorables.
🔹 4. Filtros de Tendencia y Estructura
El sistema puede operar en dos modos:
Modo seguro (solo a favor de tendencia) – emite entradas únicamente alineadas con la dirección dominante.
Modo flexible (reversas estructurales) – permite cambios de dirección validados por rompimiento estructural y confirmación de momentum.
De esta forma, el indicador se adapta tanto a estrategias de trend following como a smart reversals.

📊 Multi-TF Bias + Premium/Discount by Dayn12SirРусский
Мультитаймфреймовый индикатор с концепциями Smart Money для поиска точек входа.
Основные функции:
Multi-Timeframe Bias: анализ тренда на 5 таймфреймах (EMA, RSI, структура)
Confluence Score: подсчёт подтверждений от разных таймфреймов (0-5)
Premium/Discount зоны: Fibonacci уровни от Swing High/Low
Premium (61.8%-100%): не лонговать ❌
Equilibrium (38.2%-61.8%): обе стороны ✅
Discount (0%-38.2%): не шортить ❌
Liquidity Grabs: обнаружение захватов ликвидности с фильтрацией
Сигналы входа: 🚀 STRONG LONG / 🔻 STRONG SHORT
Как использовать:
Проверьте Confluence (4-5/5 = сильный сигнал 💪)
Убедитесь что цена в правильной зоне (Discount для LONG, Premium для SHORT)
Ждите 💧 Liquidity Grab + сигнал входа
Входите только если старшие таймфреймы подтверждают
Настройки:
5 таймфреймов (по умолчанию: 5m, 15m, 1H, 4H, D)
EMA периоды (20/50)
RSI уровни (40/60)
Период ликвидности (20)
Минимальный Confluence (3/5)
Таймфрейм для P/D зон (4H)
⚠️ Не перерисовывается. Лучше работает на трендовых рынках.
🇬🇧 English
Multi-timeframe bias indicator with Smart Money Concepts for high-probability entries.
Key Features:
Multi-Timeframe Bias: trend analysis across 5 timeframes (EMA, RSI, structure)
Confluence Score: counts confirmations from different timeframes (0-5)
Premium/Discount Zones: Fibonacci levels from Swing High/Low
Premium (61.8%-100%): don't long ❌
Equilibrium (38.2%-61.8%): both directions ✅
Discount (0%-38.2%): don't short ❌
Liquidity Grabs: detects liquidity sweeps with filtering
Entry Signals: 🚀 STRONG LONG / 🔻 STRONG SHORT
How to Use:
Check Confluence (4-5/5 = strong signal 💪)
Ensure price is in correct zone (Discount for LONG, Premium for SHORT)
Wait for 💧 Liquidity Grab + entry signal
Only enter if higher timeframes confirm
Settings:
5 timeframes (default: 5m, 15m, 1H, 4H, D)
EMA periods (20/50)
RSI levels (40/60)
Liquidity period (20)
Minimum Confluence (3/5)
P/D zones timeframe (4H)
⚠️ Non-repainting. Works best on trending markets.
💡 Tip: Best results when 4+ timeframes align + liquidity grab in discount/premium zone!

Quantum Trend Guardian MTF📊 Descripción de Indicador: “Momentum Clarity”
Resumen:
Momentum Clarity es un indicador diseñado para identificar zonas de alta probabilidad de reversión o continuación de tendencia, combinando análisis de volumen, volatilidad y fuerza relativa. Ideal para traders que buscan claridad en momentos de indecisión del mercado.
Características principales:
• 🔍 Detecta divergencias entre precio y momentum.
• 📈 Señala zonas de sobrecompra y sobreventa con mayor precisión que el RSI tradicional.
• 🟢 Incluye alertas visuales para entradas y salidas potenciales.
• 🧠 Compatible con estrategias de scalping, swing y position trading.
Cómo usarlo:
• Utiliza las señales verdes para considerar entradas en largo y las rojas para cortos.
• Confirma con acción del precio y volumen antes de ejecutar.
• Ajusta la sensibilidad según el marco temporal y tu estilo de trading.
Ventajas:
• Reduce el ruido en mercados laterales.
• Mejora la toma de decisiones en zonas de congestión.
• Aumenta la confianza en escenarios de alta volatilidad
Absolutely! Here's the English version of the indicator description:
📊 Indicator Description: “Momentum Clarity”
Overview:
Momentum Clarity is a custom indicator designed to highlight high-probability zones for trend reversals or continuations by combining volume, volatility, and relative strength analysis. It’s ideal for traders seeking clarity during market indecision.
Key Features:
• 🔍 Detects divergences between price and momentum.
• 📈 Identifies overbought and oversold zones with greater precision than traditional RSI.
• 🟢 Includes visual alerts for potential entry and exit points.
• 🧠 Compatible with scalping, swing trading, and long-term strategies.
How to Use:
• Use green signals to consider long entries and red signals for short positions.
• Confirm with price action and volume before executing trades.
• Adjust sensitivity based on your timeframe and trading style.
Benefits:
• Reduces noise in sideways markets.
• Enhances decision-making in consolidation zones.
• Builds confidence in volatile environments.
If you’d like, I can tailor this description to match your specific indicator’s logic, name, and purpose. Just share a few details and I’ll refine it for publication.
Seasonality Forecast Line (White BG • Stable)Seasonality Forecast Line (White BG • Stable)
Seasonality Forecast Line (White BG • Stable)
Seasonality Forecast Line (White BG • Stable)

EMA H/L 20-50 Table + RSI - KHALID ALADDIN🧾 Description
EMA H/L 20-50 Table + RSI — by Khalid Aladdin
A clean and minimal indicator designed for traders and analysts who prefer a quick glance at essential EMA values without any extra clutter on the chart.
📊 Features:
Displays precise values of EMA20 (High & Low) and EMA50 (High & Low) in a compact table below the chart.
Automatically updates values based on the current timeframe.
Includes RSI reading for momentum tracking.
Large, clear text with dark-theme friendly colors.
No lines or drawings — only a clean data panel.
✅ Perfect for:
Technical analysts, swing traders, and long-term investors who want an uncluttered view of trend levels and momentum strength.

Market Working days🔶What it is ?
"Market trading days" is an indicator to define the new trading in Finance market.
As a trader or investor, we separate the days and weeks, months to understand how market is moving on each day easier. Give out plans on each day more effective.
Plus, when we're recording trading journal with detail info of "Market trading days", you also
can understand it faster.
You can understand the trend of last days, last week easier to give out plans on current week/month/day.
🔶 Who can use it ?
1. All traders who are using NCI, ICT , Smart money concepts, MACD system and other systems...
2. All traders who are trading on any timeframes
3. All traders who are trading on Forex, Crypto, Stock, Indices, Futures...
4. All traders who are new or experienced traders
5. All traders who are swing or scalping traders
🔶 The purpose of indicator
1. Separate days/weeks/months to be easier to analyze
2. Supporting traders to have a better view of market circle
3. Reducing stressful in analyzation process by a clearly view of day/week/month
🔶 How will indicator appear on chart
After you added it on chart, indicator will create the vertical lines with labels when a new day/week/month starts.
New Monday (new week) : Dashed line with red label "MON"
New Tue-Sun (normal days) : Dashed line with aqua label "TUE"-"SUN"
New month : Solid line with red label "Nov - 2025 MON"
🔶 INPUT value and How to use indicator
This indicator just need to add and use it directly. There's no input date required.

52 Week High/Low with Custom Levels by VivekBajajStockEdge 52Week high/Low Zone which identtifies stocks that are showing strength and weakness.

Confirmation ny meThis is confirmation indicator very good This is a powerful confirmation indicator designed to help traders identify strong entry points with accuracy and confidence. It filters out false signals and confirms momentum direction before you enter a trade. Works perfectly on multiple timeframes and instruments.
⸻
🔹 Short & Catchy
Simple yet powerful confirmation tool. It helps confirm your trade setup with high accuracy, reducing false entries and improving win rate.
⸻
🔹 Detailed (for more credibility)
Confirmation by Me is a custom-built indicator that confirms trade direction using a blend of trend strength and momentum signals. Whether you’re trading forex, crypto, or indices, it helps you spot real confirmations and avoid fake breakouts. Ideal for scalping, day trading, and swing setups.

BullTrader - ParabolicSARFlipSignals(NonRepainting)TP/SL🧠 Purpose & Concept
This indicator refines Wilder’s Parabolic SAR into a simple, non‑repainting alert and visualization system that marks each confirmed trend flip with a clear buy or sell signal.
It also auto‑generates dynamic, ATR‑based Take‑Profit (TP) and Stop‑Loss (SL) levels, keeps them updating with price in real time, and displays the current market bias in an on‑chart table.
The goal: clarity and automation without complexity — see exactly when a new bullish or bearish phase begins, what your current TP/SL targets are, and receive a single clean alert for every new flip.
⚙️ How It Works
1. The built‑in ta.sar() function tracks the Parabolic SAR dots.
2. When a candle closes across the SAR line, a trend‑change is confirmed:
• Price crossing above a SAR dot → Buy Flip (green triangle).
• Price crossing below a SAR dot → Sell Flip (red triangle).
3. On each flip, the indicator calculates dynamic ATR‑based TP / SL targets:
TP = entry ± (ATR × tpMult) and SL = entry ∓ (ATR × slMult)
These values move automatically as the trend develops.
4. A small floating label beside the latest bar shows live‑updated TP / SL numbers.
5. A color‑coded table in the upper‑right corner displays the current trend: Lime = Bullish, Red = Bearish, Yellow = Neutral.
6. Each new flip triggers an easy‑to‑use Buy / Sell alert after the bar closes—no repainting.
🔔 Alerts
Alert Name Triggers When Message
SAR Buy Flip Alert Green triangle (bullish reversal) “BUY Flip — Parabolic SAR on {{ticker}} ({{interval}})”
SAR Sell Flip Alert Red triangle (bearish reversal) “SELL Flip — Parabolic SAR on {{ticker}} ({{interval}})”
📈 Chart Elements
Element Meaning
🟠 Orange cross Standard Parabolic SAR trail.
🟢 / 🔴 Triangles Confirmed buy / sell flips (non‑repainting).
Bright lime/red TP‑SL box Live ATR targets that move with price.
Trend table (top‑right) Instant status of bullish/bearish bias.
✅ Features & Highlights
Non‑repainting — all signals confirm on closed bars.
Visual clarity — single pair of bright triangles for flips.
Dynamic ATR‑based TP / SL values that auto‑trail with trend.
Always‑visible trend summary table.
Two ready‑made alert types (Buy / Sell).
Lightweight and optimized for any timeframe or symbol.
💡 Best Use
Ideal for traders who prefer clean trend‑based entries and volatility‑adaptive exits without signal clutter:
Pair it with your existing strategy or use it standalone for reversal‑based swing and intraday trading.


ATR_XAUUSD-BITCOINT-US100_Daniel# ATR Daniel - Indicator Description
## 🇬🇧 ENGLISH VERSION
### ATR Daniel - Smart Trailing Stop Manager
**ATR Daniel** is an intelligent trailing stop indicator that automatically adapts to your trading style and the asset you're trading.
#### Key Features:
**🎯 3 Trading Modes:**
- **Swing Trading** - For position trading with wider stops
- **Intraday** - For day trading with balanced parameters
- **Scalping** - For quick trades with tight stops
**📊 Automatic Asset Detection:**
The indicator automatically recognizes 3 major assets and applies optimized parameters:
- **XAUUSD (Gold)** - Lower volatility settings
- **BTCUSDT (Bitcoin)** - Medium volatility settings
- **NAS100USD (Nasdaq 100)** - Higher volatility settings
**🔧 Flexible Configuration:**
- **Auto Mode**: Applies optimal parameters based on detected asset and selected trading mode
- **Manual Mode**: Customize ATR length and multiplier to your preferences
- **Customizable Colors**: Choose your own line color
- **ON/OFF Display**: Toggle line visibility as needed
**📈 Visual Display:**
- Dynamic trailing stop line that follows price action
- Color changes based on trend direction (bullish/bearish)
- Real-time info table showing:
- Current asset
- Trading mode
- ATR value
- Stop loss distance
- Recommended SL price
- Current trend direction
- Signal arrows at trend reversals (optional)
**💡 How It Works:**
The indicator uses ATR (Average True Range) to calculate dynamic stop loss levels that adapt to market volatility. The trailing stop follows the price in trending markets while protecting your position.
**Perfect for:**
- Traders who want automated stop loss management
- Multi-asset traders (Gold, Bitcoin, Nasdaq)
- All trading styles (Swing, Intraday, Scalping)
---

Minhas MAs - Escala Unificada (lock)📘 Indicator: My Moving Averages – Clean & Fixed
Description:
This indicator displays four classic moving averages (two exponential and two simple) designed to clearly show market trend direction and strength. It’s optimized to stay locked to the main price scale, avoiding the common issue of indicator lines “floating” when the chart is moved.
Composition:
EMA 9 (Short): Fast-reacting line; ideal for short-term entries and exits.
EMA 20 (Medium): Smooths short-term noise and confirms trend direction.
SMA 50 (Long): Represents the intermediate trend and often acts as dynamic support/resistance.
SMA 200 (Macro): Defines the overall long-term trend; widely used by institutional traders.
Interpretation:
Price above all MAs: strong uptrend.
Price below all MAs: strong downtrend.
Crossovers (e.g., EMA 9 crossing above EMA 20) signal possible momentum shifts.
MAs also act as dynamic support and resistance zones.
Advantages:
A clean, minimalist trend-following tool that adapts to any asset (stocks, crypto, forex) and timeframe.
Perfect for traders who prefer uncluttered charts with clear trend structure.

MMM1this framework useful to show R1, R2, R3 and S1 , S2 , S3 and get more flexibility also work in all time fame.

Seasonality Indicator 1DA seasonality indicator that draws vertical lines on the chart for each selectable start and end date for each year, i.e., the current year and all previous years.

VietNguyen AlgoThis is a indicator of Vietnammes. it is very good for trade Gold and Crypto.
Good luck to you.
Viet Nguyen DN

RSI(14) CrossUp >= 60 📈 RSI14 CrossUp ≥ 60 (Daily, Live) + BB Width Screener
Author: Rayan Selim / Torpedo Labs
Version: 1.0
Category: Momentum + Volatility Visualization
🧠 Overview
This indicator combines RSI-based momentum confirmation with Bollinger Band Width (BBW) expansion tracking — designed for traders who want to visually and quantitatively detect daily strength shifts and volatility expansions across multiple symbols.
It highlights candles when the daily RSI(14) crosses above 60, signaling bullish continuation, and displays daily Bollinger Band Width data to assess volatility expansion or contraction.
You can also use the built-in Screener plots as custom columns in TradingView’s Watchlist or Stock Screener for quick scanning of multiple symbols.
⚙️ Core Features
✅ Daily RSI(14) Cross-Up Highlight
Automatically colors candles when RSI crosses above 60 (updates live, no need to wait for daily close).
✅ Bollinger Band Width (BBW) Display
Shows BBW values for the highlighted and previous candles.
✅ Dynamic Label Coloring
Expanding BBW → Green label, Contracting → Red label (toggleable).
✅ Grouped Input Panels
Organized configuration panels for clarity:
Graphic / Highlight
BBW Labels (Global / Green / Red / Fonts)
Screener Outputs
✅ Screener-Compatible Output Plots
Adds hidden plots for Watchlist columns:
RSI Prev (D)
RSI Today (D)
BBW Prev (D)
BBW Today (D)
CrossUp≥60 (0/1)
BBW Expanding (0/1)
✅ Live & Non-Repainting
Uses lookahead_on for live RSI updates while maintaining daily context.
📊 Use Case Examples
Detect momentum confirmation (RSI crossing 60) with simultaneous volatility expansion.
Screen for tickers where daily BBW is widening while RSI shows strength.
Build Watchlist columns to sort stocks by RSI conditions and BBW expansion.
Identify early breakout conditions during accumulation phases.
⚡ Technical Notes
All calculations use daily data, even on lower timeframes.
RSI cross-up events include the current (in-progress) daily candle.
Screener columns are hidden by default but can be toggled visible for debugging.
The indicator is non-repainting, as it reads daily RSI and BBW in real time.
📢 Alerts
Built-in alert for “RSI(14) Crossed Above 60 (Live)” so you never miss a setup.

Info de Vela 1m1-Minute Candle Info Dashboard (Real-Time)
Overview
This is a lightweight, real-time dashboard designed specifically for 1-minute (1m) scalping. It provides critical, non-lagging data about the current 1-minute candle, helping you make split-second decisions on stop-loss placement and risk assessment.The table updates on every tick without flickering or repainting.
Key Features (Real-Time Table)
The dashboard displays three key metrics about the current 1m candle:Time Remaining: A simple countdown timer showing the exact seconds remaining until the current candle closes (e.g., "00:34").Dist. to Extreme (Ticks): This is the core function for scalping. It calculates the distance (in ticks) from the current price to the furthest extreme of the candle (i.e., max(high - close, close - low)). This is ideal for traders who base their stop-loss on the current candle's range.Total Candle Range (Ticks): Displays the full high-to-low range of the current candle in ticks, giving you an instant read on volatility.
How to Use
This tool is designed to solve one problem: speed.Instead of manually measuring the distance for your stop-loss on every candle, you can instantly read the exact tick value from the table. This allows you to calculate your position size (lotage) much faster, which is essential in a fast-moving 1m environment.
REQUIREMENT:This indicator is designed to work ONLY on the 1-minute (1m) timeframe. It will display an error and show no data on any other chart.

VSA No Supply by MashrabNo Supply Signal created by Mashrab
Hi everyone! This indicator helps you find low-risk entry points during an existing uptrend.
Its main job is to spot "quiet" pauses in a stock's advance, right before it's ready to continue its upward move.
What's the Big Idea?
Think of a stock in an uptrend like someone climbing a staircase. They can't sprint to the top all at once! Eventually, they need to pause, catch their breath, and then continue climbing.
This indicator helps you find that "catch your breath" moment. It looks for a specific signal that shows all the sellers are gone (what we call "No Supply"). When there's no one left to sell, the stock is much more likely to go up.
How It Works (The Signals)
The indicator gives you two simple signals on your chart:
1. The "Get Ready" Signal (Grey Dot)
The indicator is always checking to make sure the stock is in a general uptrend. When it spots a Grey Dot, it's telling you: "Hey, the stock just had a quiet pullback day. Pay attention!"
This dot only appears if the bar meets four conditions:
It's a "down" bar (closed lower than it opened).
It has low volume (this is key! It shows sellers aren't interested).
It has a narrow range (it was a quiet, low-volatility bar).
It closed in the top half of its range (buyers easily stepped in).
When you see a Grey Dot, you don't buy yet. You just add the stock to your watchlist.
2. The "Go" Signal (Blue Triangle)
This is your entry trigger! A Blue Triangle appears on the next bar only if it confirms the upward move. This bar must be:
An "up" bar (closed higher than it opened).
It has high volume (showing that buyers and "big money" are now back and pushing the price up with conviction).
How to Use This Indicator
Grey Dot: See this? The setup looks good. Time to watch this stock.
Blue Triangle: See this? This is your entry confirmation. The move is now "on."
Red Line: This is your safety net. The indicator automatically draws your Stop-Loss at the low of the "Grey Dot" bar. This helps you define your risk on the trade right from the start.
Settings
Uptrend MA Period: (Default: 50) This is just the moving average used to make sure the stock is in an uptrend.
Volume/Range Lookback: (Default: 20) This is how many bars the indicator looks back at to decide what "average" volume or "average" range is.
That's it! I hope this tool helps you find great setups. As always, this isn't a magic crystal ball. It's a tool to help you react to the market. Test it out, and happy trading!

52 Week High/Low with Custom Levels + Dotted LookStockEdge 52Week High and Low Zone
Data at web.stockedge.com
