Z-Signal Pro: RSI+BBThe indicator utilizes RSI and Bollinger Bands, incorporates additional logic to filter out noisy signals, and produces long and short entries.
Breadth Indicators

Divergences: Price × RSI × OBV The Triple Confirmation Divergence indicator is a sophisticated momentum and volume-based tool designed to identify high-probability trend exhaustion points and potential reversals. It moves beyond traditional single-indicator divergence analysis by synthesizing signals from three core pillars of technical analysis: Price Action, Momentum, and Volume Flow.
This indicator works better on the time frames: 1H, 4H, 1D, 1W and 1M.

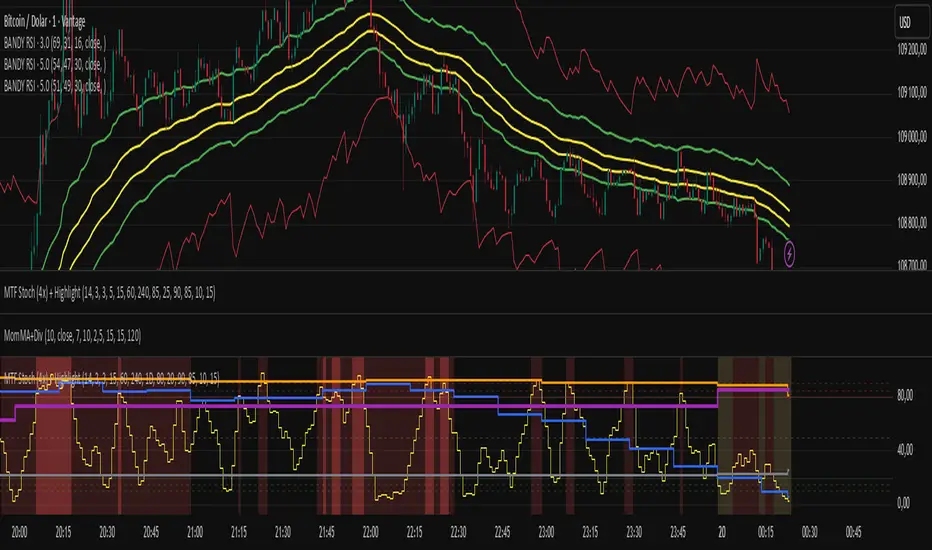
Multi-Timeframe Stochastic (4x) z Podświetlaniemnowy skrypt bez etykietek o wyprzedaniu i wykupieniu
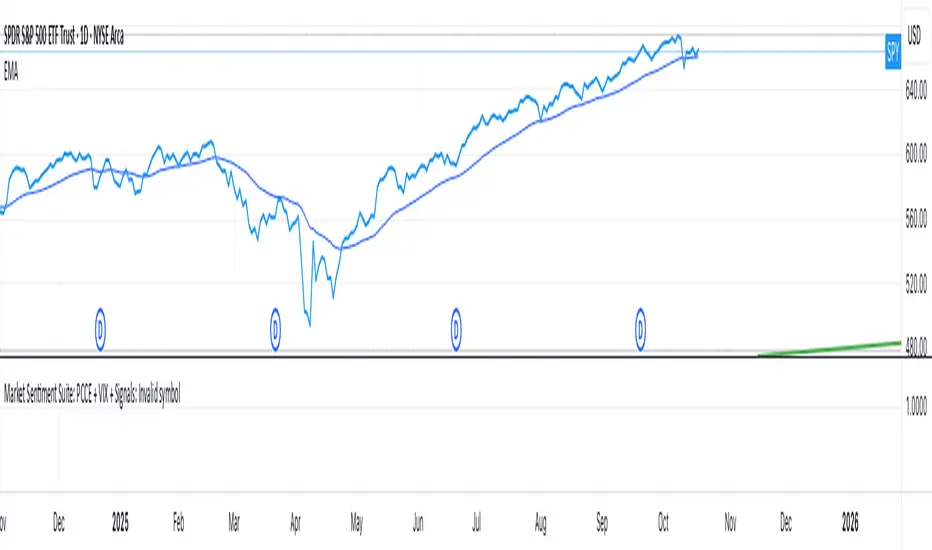
Market Sentiment Overlay: PCCE + VIX Zones📊 Market Sentiment Suite: PCCE + VIX
Track fear & greed in real time using Put/Call Ratio and VIX percentile.
Spot potential tops and bottoms before they form — ideal for SPX/SPY swing traders.Identify fear, greed, and turning points in the market.
This script combines the CBOE Put/Call Ratio (PCCE) with the VIX volatility index percentile to visualize crowd sentiment and highlight potential market tops and bottoms.
🔍 Key Features
Dual-indicator design: PCCE + normalized VIX percentile
Color-coded zones for Greed (<0.6) and Fear (>1.2)
Automatic alert signals when sentiment reaches extremes
Live sentiment table displaying real-time PCCE and VIX data
Works seamlessly on SPX, SPY, QQQ, or any major index
🧠 How to Use
When PCCE > 1.2 and VIX percentile > 80%, fear is extreme → possible market bottom
When PCCE < 0.6 and VIX percentile < 20%, greed is extreme → possible market top
Perfect for contrarian traders, sentiment analysts, and swing traders
✨ Best Timeframe: Daily
⚙️ Markets: SPX / SPY / QQQ / Global Indexes
📈 Type: Contrarian Sentiment Indicator

Market Sentiment Suite: PCCE + VIX + Signals📊 Market Sentiment Suite: PCCE + VIX + Signals
Identify fear, greed, and turning points in the market.
This script combines the CBOE Put/Call Ratio (PCCE) with the VIX volatility index percentile to visualize crowd sentiment and highlight potential market tops and bottoms.
🔍 Key Features
Dual-indicator design: PCCE + normalized VIX percentile
Color-coded zones for Greed (<0.6) and Fear (>1.2)
Automatic alert signals when sentiment reaches extremes
Live sentiment table displaying real-time PCCE and VIX data
Works seamlessly on SPX, SPY, QQQ, or any major index
🧠 How to Use
When PCCE > 1.2 and VIX percentile > 80%, fear is extreme → possible market bottom
When PCCE < 0.6 and VIX percentile < 20%, greed is extreme → possible market top
Perfect for contrarian traders, sentiment analysts, and swing traders
✨ Best Timeframe: Daily
⚙️ Markets: SPX / SPY / QQQ / Global Indexes
📈 Type: Contrarian Sentiment Indicator
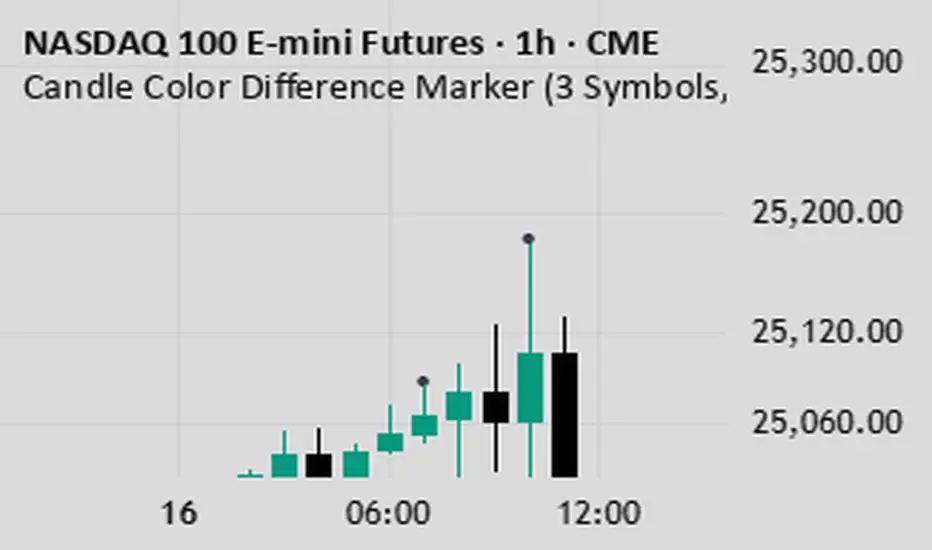
Candle Color Difference Marker (PSP)This indicator shows when the colors of the candles on two or three charts are different.
Buy The F*cking Dip [DotGain]How to Interpret the "Buy The F*cking Dip" (BTFD) Indicator
Main Purpose and Timeframe
The BTFD indicator is a confluence indicator designed to identify rare moments of extreme capitulation and panic in the market. As the name suggests, its primary focus is identifying significant buying opportunities ("Dips") on high timeframes.
Recommended Timeframes: Minimum Daily chart, ideally Weekly chart.
Primary Signal: The green "Buy" triangle is the default signal to watch for.
The Buy Signal (Green Triangle)
A green "Buy" triangle appears only when all three of the following conditions are met simultaneously. It signals not just a minor pullback, but a potentially macro-level oversold condition.
High Panic (CM Williams Vix Fix): The market is in a state of heightened volatility or "fear." This indicates that sellers are acting out of panic.
Structurally Oversold (Deviation from MA): The price has deviated extremely far (default: >10%) below its long-term moving average (default: 200-period EMA). This signals that the price is "cheap" in the big picture.
Short-Term Overextended (TRMAD): The price has fallen extremely hard and fast relative to its recent volatility (ATR) (default: < -3.0). This signals "maximum pain" on a short-term level.
In summary, a green triangle means: The market is panicky, structurally undervalued, and extremely oversold short-term. These are often the moments when long-term bottoms are formed.
The Sell Signal (Red Triangle)
The indicator can also identify the exact opposite: moments of extreme euphoria or "blow-off tops."
Disabled by Default: The red "Sell" triangle is disabled by default in the settings (display=display.none), as the indicator's focus is on buying.
Meaning (if enabled): It signals that the market (1) has high volatility, (2) is structurally overbought (far above its 200 MA), and (3) is extremely overextended (euphoric) on a short-term basis.
Visual Adjustments (In the "Style" Tab)
By default, only the green "Buy" triangle is active. You can, however, enable other visuals in the indicator's "Style" settings tab:
Buy (Green Triangle): On by default.
Sell (Red Triangle): Off by default.
Signal Bar Color: Colors the candle green/red. Off by default.
Signal Background: Shows a transparent green/red background. Off by default.
Have fun :)
Disclaimer
This "Buy The F*cking Dip" (BTFD) indicator is provided for informational and educational purposes only. It does not, and should not be construed as, financial, investment, or trading advice.
The signals generated by this tool (both "Buy" and "Sell") are the result of a specific set of algorithmic conditions. They are not a direct recommendation to buy or sell any asset. All trading and investing in financial markets involves substantial risk of loss. You can lose all of your invested capital.
Past performance is not indicative of future results. The signals generated may produce false or losing trades. The creator (© DotGain) assumes no liability for any financial losses or damages you may incur as a result of using this indicator.
You are solely responsible for your own trading and investment decisions. Always conduct your own research (DYOR) and consider your personal risk tolerance before making any trades.


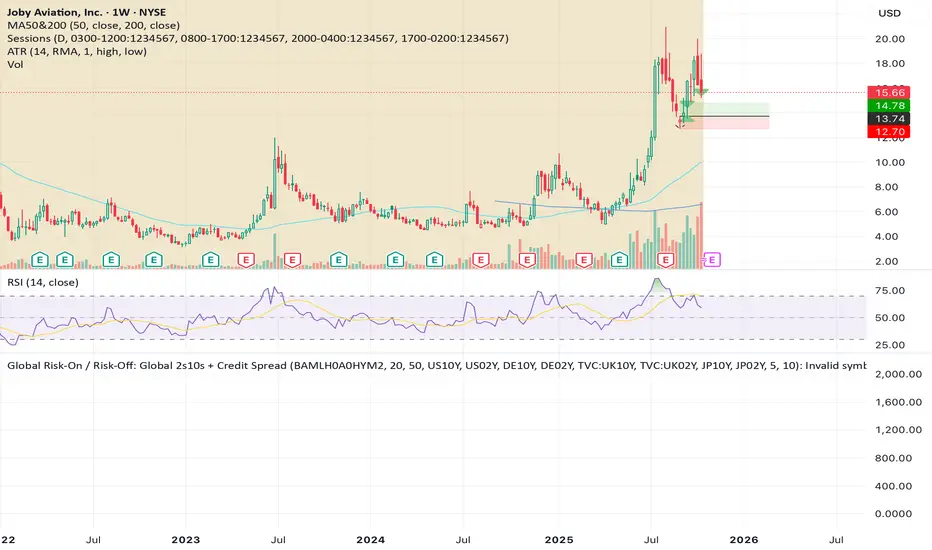
global credit spread with global yield curveglobal credit spread with global yield curve designed to give short term and longer term asset price reversal
Global Risk-On / Risk-Off: Global 2s10s + Credit SpreadGlobal Risk-On / Risk-Off: Global 2s10s + Credit Spread
G_GMMA• Comprehensive GMMA Visualization: It plots six fast EMAs and six slow EMAs, clearly distinguishing short term and long term trends. The indicator fills the space between the fastest and slowest EMAs in each group, turning the moving averages into easily identifiable ribbons rather than a mass of overlapping lines.
• Customizable Appearance: Users can adjust the colors of the fast and slow EMA lines, the fill colors of each ribbon, and the overall line thickness. This makes it easy to tailor the chart to personal preferences or trading templates.
• Dynamic Background Shading: The script can shade the chart’s background depending on whether the fast ribbon is above or below the slow ribbon, giving a quick visual cue for trend direction (uptrend vs. downtrend).
• Touch Alert System: Up to three different EMA lengths can be monitored for “touch” events. When price touches a selected EMA (e.g., 20 , 50 or 200 period EMA), the indicator triggers an alert condition and plots a small circle on the chart at the contact point. This helps traders catch precise entry or exit signals without staring at the screen.
• Flexible Input: Both fast and slow EMA lengths, colors, and alert parameters are user adjustable from the indicator’s settings. This allows the same script to be used on different instruments (e.g., Gold, forex pairs) and time frames by simply changing the period values.
• Trend Sensitive Support/Resistance: By treating the slow EMA ribbon as a dynamic support/resistance zone, the indicator helps traders identify where price is likely to stall or reverse. Combining this with the touch alerts makes it well suited for scalping or intraday trades.

Currency Valuation V2This indicator values currencies against DXY. Using the daily chart annd the differences in the price of the DXY in certain bars.

Buy/Sell Signals [WynTrader]My name is WynTrader. I cumulate 24 years of experience.
This Indicator produces Buy/Sell Signals using these features:
- Fast and Slow Moving averages (modifiable) optimized at EMA-8 and SMA-35
- Bollinger Bands (modifiable) optimized at Basis-18 and Multiplier-1
Also, the Buy/Sell Signals are conditioned by three Filters (optionable, modifiable) :
. Bollinger-Bands Lookback
. High-Low vs Candle Range %
. Distance from Fast and Slow Moving averages %
The Results Calculation presented in a Table are based :
- on the Current Chart Visible Range (optionable)
or
- on the specified TIme Frame Start and End Dates (modifiable)
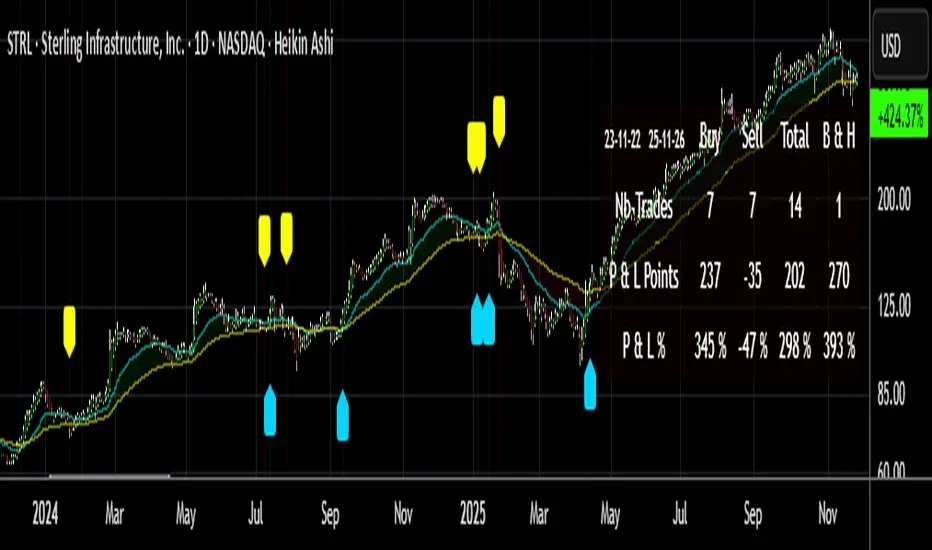
The Table shows Calculation Results of the Buy and Sell Signals that are activated on the chart, with the Number of Trades (Signals), the Winning Points and the Win Rate %. The Buy&Hold starts calculation at the first Buy encountered.
So be surprised by my Buy/Sell Indicator. But always remember that the world is not perfect. The Graal Indicator, even with AI, doesn't already exist, maybe one day (all of us richier...), but not now. , depending on the chart product (stocks...), volatility, probabilities, unpredictable behaviour. , the moves, etc.
Enjoy
WynTrader
P. s. :
My name is WynTrader. I cumulate 24 years of experience. In 2001, I took an intensive technical analysis course taught by an exceptional friend, Cyril, who taught me everything I know. The foundation I gained through his teaching remains solid and relevant to this day, never failing me.
Before i made this Indicator, I have used many Trading View Buy/Sell Indicators using alone or combined RSI, SMI, OBV, MACD ATR, ADX, Neural, Fractal, Geometry, etc., that are already available for the Trading View community. A great thanks to those who give their time that help me build this tool.
Note that I'm not a programmer, so... ;-)
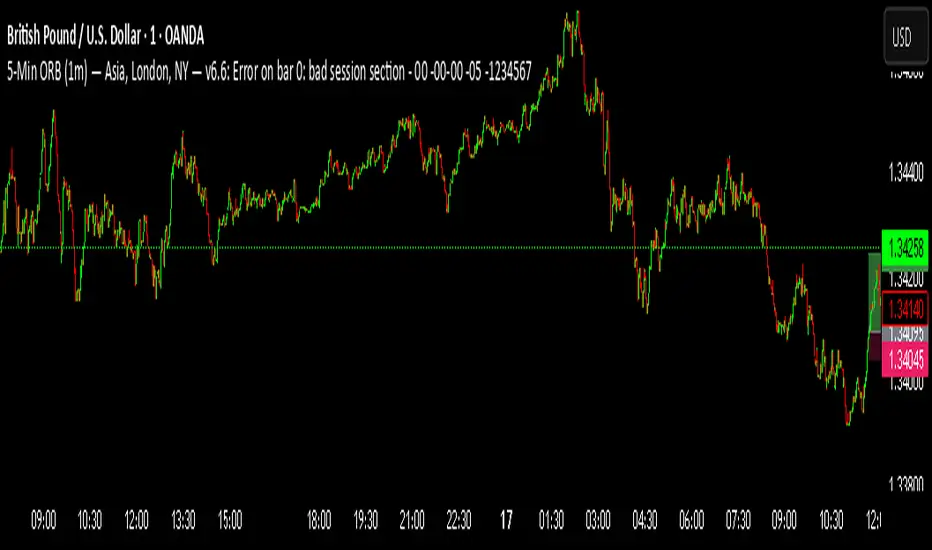
5-Min ORB (1m) — Asia, London, NY — v6.6Awesome—here’s a ready-to-use Pine Script v5 indicator for a 5-Minute Opening Range Breakout (ORB) across Asia, London, and New York, designed to be applied on the 1-minute chart. It:
Marks the first 5 minutes of each session
Draws the ORB box (high/low)
Infers bias from that 5-minute candle (close vs. open)
Triggers buy/sell signals only in the bias direction when price breaks the ORB
Includes alerts, per-session enable toggles, custom timezones & session windows
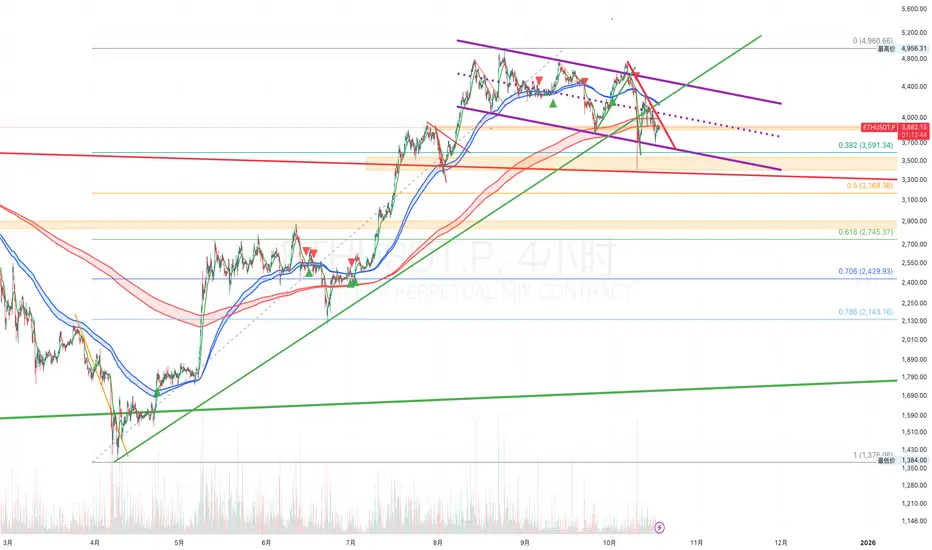
JackFinance:Vegas Dual ChannelVegas Tunnel Indicator - Technical Documentation
Overview
The Vegas Tunnel is a technical analysis indicator utilizing multiple exponential moving averages (EMAs) to identify market trends and potential trading opportunities. The system employs five EMAs organized into three distinct groups for multi-timeframe analysis.
Component Structure
Filter Line: 12-period EMA (green) serving as short-term trend indicator
Channel A: 144-period and 169-period EMAs (blue) defining medium-term trend direction
Channel B: 576-period and 676-period EMAs (red) establishing long-term trend context
Operational Methodology
The indicator generates trading signals based on the relative positioning and interactions between these EMA groups. Price position above both channels indicates bullish market conditions, while position below both channels suggests bearish conditions. Crossovers between the Filter Line and Channel A provide potential entry and exit signals, with Channel B serving as confirmation for major trend direction.
Application Guidelines
This indicator is optimized for swing trading and position trading strategies on timeframes of one hour or higher. Traders should consider the slope and spacing of the channels as indicators of trend strength. The tunnel areas between EMAs function as dynamic support and resistance zones.
Parameter Customization
All EMA periods are adjustable through the input parameters, allowing traders to optimize settings for specific instruments and trading styles. Default values are based on Fibonacci-derived numbers that have demonstrated historical significance in technical analysis.
ICT PDA - Gold & BTC (QuickScalp Bias/FVG/OB/OTE + Alerts)What this script does
This indicator implements a complete ICT Price Delivery Algorithm (PDA) workflow tailored for XAUUSD and BTCUSD. It combines HTF bias, OTE zones, Fair Value Gaps, Order Blocks, micro-BOS confirmation, and liquidity references into a single, cohesive tool with early and final alerts. The script is not a mashup for cosmetic plotting; each component feeds the next decision step.
Why this is original/useful
Symbol-aware impulse filter: A dynamic displacement threshold kTune adapts to Gold/BTC volatility (body/ATR vs. per-symbol factor), reducing noise on fast markets without hiding signals.
Scalping preset: “Quick Clean” mode limits drawings to the most recent bars and keeps only the latest FVG/OB zones for a clear chart.
Three display modes: Full, Clean, and Signals-Only to match analysis vs. execution.
Actionable alerts: Early heads-up when price enters OTE in the HTF bias direction, and Final alerts once mitigation + micro-break confirm the setup.
How it works (high-level logic)
HTF Bias: Uses request.security() on a user-selected timeframe (e.g., 240m) and EMA filter. Bias = close above/below HTF EMA.
Dealing Range & OTE: Recent swing high/low (pivot length configurable) define the range; OTE (62–79%) boxes are drawn contextually for up/down ranges.
Displacement: A candle’s body/ATR must exceed kTune and break short-term structure (displacement up/down).
FVG: 3-bar imbalance (bull: low > high ; bear: high < low ). Latest gaps are tracked and extended.
Order Blocks: Last opposite candle prior to a qualifying displacement that breaks recent highs/lows; zones are drawn and extended.
Entry & Alerts:
Long: Bullish bias + price inside buy-OTE + mitigation of a bullish FVG or OB + micro BOS up → “PDA Long (Final)”.
Short: Bearish bias + price inside sell-OTE + mitigation of a bearish FVG or OB + micro BOS down → “PDA Short (Final)”.
Early Alerts: Trigger as soon as price enters OTE in the direction of the active bias.
Inputs & controls (key ones)
Bias (HTF): timeframe minutes, EMA length.
Structure: ATR length, Impulse Threshold (Body/ATR), swing pivot length, OB look-back.
OTE/FVG/OB/LP toggles: show/hide components.
Auto-Tune: per-symbol factors for Gold/BTC + manual tweak.
Display/Performance: View Mode, keep-N latest FVG/OB, limit drawings to last N bars.
Recommended usage (scalping)
Timeframes: Execute on M1–M5 with HTF bias from 120–240m.
Defaults (starting point): ATR=14, Impulse Threshold≈1.6; Gold factor≈1.05, BTC factor≈0.90; Keep FVG/OB=2; last 200–300 bars; View Mode=Clean.
Workflow: Wait for OTE in bias direction → see mitigation (FVG/OB) → confirm with micro BOS → manage risk to nearest liquidity (prev-day H/L or recent swing).
Alerts available
“PDA Early Long/Short”
“PDA Long (Final)” / “PDA Short (Final)”
Attach alerts on “Any alert() function call” or the listed conditions.
Chart & screenshots
Please include symbol and timeframe on screenshots. The on-chart HUD shows the script name and state to help reviewers understand context.
Limitations / notes
This is a discretionary framework. Signals can cluster during news or extreme volatility; use your own risk management. No guarantee of profitability.
Changelog (brief)
v1.2 QuickScalp: added Quick Clean preset, safer array handling, symbol-aware impulse tuning, display modes.
------------------------------
ملخص عربي:
المؤشر يطبق تسلسل PDA عملي للذهب والبتكوين: تحيز من فريم أعلى، مناطق OTE، فجوات FVG، بلوكات أوامر OB، وتأكيد micro-BOS، مع تنبيهات مبكرة ونهائية. تمت إضافة وضع “Quick Clean” لتقليل العناصر على الشارت وحساسية إزاحة تتكيّف مع الأصل. للاستخدام كسكالب: نفّذ على M1–M5 مع تحيز 120–240 دقيقة، وابدأ من الإعدادات المقترحة بالأعلى. هذا إطار سلوكي وليس توصية مالية.

ORDER FLOW Professional & Delta LineThe ORDER FLOW Professional & Delta Line indicator provides a powerful visualization of buy and sell volume imbalances within each candle — offering traders a deeper view into market order flow dynamics.
Inspired by footprint charts, this tool estimates Up Volume, Down Volume, and their difference (Delta) to highlight whether buyers or sellers are in control. It’s designed for traders who want a clear and professional way to track volume-based momentum directly on their charts.
🔹 Key Features:
Accurate estimation of buy (Up) and sell (Down) volume per bar
Delta Line displaying the net order flow difference
Customizable delta color for personalized visualization
Optional numeric labels showing Up, Down, and Δ values
Footprint-style column display in a clean lower panel
Background color shading to reflect positive/negative delta
💡 Ideal For:
Professional traders and volume analysts seeking to confirm price action through order flow insights, detect absorption or exhaustion, and enhance decision-making with visual delta tracking.

Multi-Timeframe Stochastic (4x Konfiguracja + Schodki)Skrypt stoch z wielu TF można sobie ustawiać pod siebie.

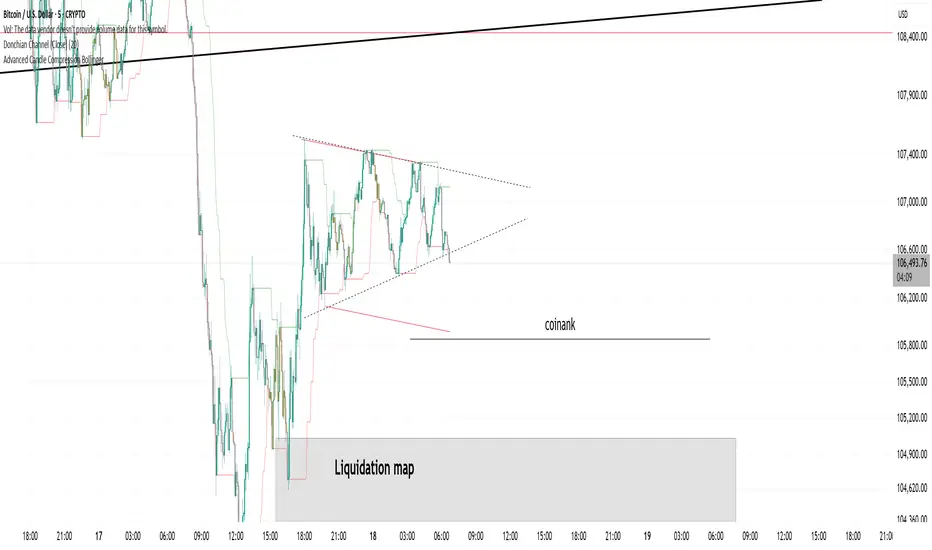
Donchian Channel (Close)Donchian channel based on candle close. Allows you to avoid fake wicks and rely only on closing prices.
MFT Supply/Demand — Top2 (Opacity by Strength, Minimal Labels)Script Overview — “MFT Supply/Demand — Top 2 (Opacity by Strength, Minimal Labels)”
This multi–timeframe (MTF) Pine Script indicator automatically detects and displays the strongest supply and demand zones across selected higher (HTF), mid (MTF), and lower (LTF) timeframes.
It dynamically identifies large-body, high-volume candles (and optional order-block breakouts) that signal institutional activity, then plots only the two strongest supply zones above the current price and two strongest demand zones below the current price — keeping the chart clean and focused.

EMA Ribbon MozyMozy TRading
EMA Ribbons for short time frames on daily traders. Buy or sell during crosses

CMF, RSI, CCI, MACD, OBV, Fisher, Stoch RSI, ADX (+DI/-DI)Eight normalized indicators are used in conjunction with the CMF, CCI, MACD, and Stoch RSI indicators. You can track buy and sell decisions by tracking swings. The zero line is for reversal tracking at -20, +20, +50, and +80. You can use any of the nine indicators individually or in combination.

Buy & Sell Liquidity Swings (v5)cette indicateur permets de buy ou sell selon la tendance du marcher
