Candle Breakout StrategyShort description (one-liner)
Candle Breakout Strategy — identifies a user-specified candle (UTC time), draws its high/low range, then enters on breakouts with configurable stop-loss, take-profit (via Risk:Reward) and optional alerts.
Full description (ready-to-paste)
Candle Breakout Strategy
Version 1.0 — Strategy script (Pine v5)
Overview
The Candle Breakout Strategy automatically captures a single "range candle" at a user-specified UTC time, draws its high/low as a visible box and dashed level lines, and waits for a breakout. When price closes above the range high it enters a Long; when price closes below the range low it enters a Short. Stop-loss is placed at the opposite range boundary and take-profit is calculated with a user-configurable Risk:Reward multiplier. Alerts for entries can be enabled.
This strategy is intended for breakout style trading where a clearly defined intraday range is established at a fixed time. It is simple, transparent and easy to adapt to multiple symbols and timeframes.
How it works (step-by-step)
On every bar the script checks the current UTC time.
When the first bar that matches the configured Target Hour:Target Minute (UTC) appears, the script records that candle’s high and low. This defines the breakout range.
A box and dashed lines are drawn on the chart to display the range and extended to the right while the range is active.
The script then waits for price to close outside the box:
Close > Range High → Long entry
Close < Range Low → Short entry
When an entry triggers:
Stop-loss = opposite range boundary (range low for longs, range high for shorts).
Take-profit = entry ± (risk × Risk:Reward). Risk is computed as the distance between entry price and stop-loss.
After entry the range becomes inactive (waitingForBreakout = false) until the next configured target time.
Inputs / Parameters
Target Hour (UTC) — the hour (0–23) in UTC when the range candle is detected.
Target Minute — minute (0–59) of the target candle.
Risk:Reward Ratio — multiplier for computing take profit from risk (0.5–10). Example: 2 means TP = entry + 2×risk.
Enable Alerts — turn on/off entry alerts (string message sent once per bar when an entry occurs).
Show Last Box Only (internal behavior) — when enabled the previous box is deleted at the next range creation so only the most recent range is visible (default behavior in the script).
Visuals & On-chart Info
A semi-transparent blue box shows the recorded range and extends to the right while active.
Dashed horizontal lines mark the range high and low.
On-chart shapes: green triangle below bar for Long signals, red triangle above bar for Short signals.
An information table (top-right) displays:
Target Time (UTC)
Active Range (Yes / No)
Range High
Range Low
Risk:Reward
Alerts
If Enable Alerts is on, the script sends an alert with the following formats when an entry occurs:
Long alert:
🟢 LONG SIGNAL
Entry Price:
Stop Loss:
Take Profit:
Short alert:
🔴 SHORT SIGNAL
Entry Price:
Stop Loss:
Take Profit:
Use TradingView's alert dialog to create alerts based on the script — select the script’s alert condition or use the alert() messages.
Recommended usage & tips
Timeframe: This strategy works on any timeframe but the definition of "candle at target time" depends on the chart timeframe. For intraday breakout styles, use 1m — 60m charts depending on the session you want to capture.
Target Time: Choose a time that is meaningful for the instrument (e.g., market open, economic release, session overlap). All times are handled in UTC.
Position Sizing: The script’s example uses strategy.percent_of_equity with 100% default — change default_qty_value or strategy settings to suit your risk management.
Filtering: Consider combining this breakout with trend filters (EMA, ADX, etc.) to reduce false breakouts.
Backtesting: Always backtest over a sufficiently large and recent sample. Pay attention to slippage and commission settings in TradingView’s strategy tester.
Known behavior & limitations
The script registers the breakout on close outside the recorded range. If you prefer intrabar breakout rules (e.g., high/low breach without close), you must adjust the condition accordingly.
The recorded range is taken from a single candle at the exact configured UTC time. If there are missing bars or the chart timeframe doesn't align, the intended candle may differ — choose the target time and chart timeframe consistently.
Only a single active position is allowed at a time (the script checks strategy.position_size == 0 before entries).
Example setups
EURUSD (Forex): Target Time 07:00 UTC — captures London open range.
Nifty / Index: Target Time 09:15 UTC — captures local session open range.
Crypto: Target Time 00:00 UTC — captures daily reset candle for breakout.
Risk disclaimer
This script is educational and provided as-is. Past performance is not indicative of future results. Use proper risk management, test on historical data, and consider slippage and commissions. Do not trade real capital without sufficient testing.
Change log
v1.0 — Initial release: range capture, box and level drawing, long/short entry by close breakout, SL at opposite boundary, TP via Risk:Reward, alerts, info table.
If you want, I can also:
Provide a short README version (2–3 lines) for the TradingView “Short description” field.
Add a couple of suggested alert templates for the TradingView alert dialog (if you want alerts that include variable placeholders).
Convert the disclaimer into multiple language versions.
Breakoutsetup

Anchorman - EMA Channel + EMA + MTF Status Table PRICE BREAKOUTUses a high/low EMA Channel to tell you when strong price breakouts are happening plus comes with a EMA to help follow the trend if you like. I designed it so it can alert you when a single TF touch happens or a breakout alignment on MTF happens (I recommend this) its up to you also its single alert so no need to do bullish or bearish signals just one signal will alert you when a breakout happens in EITHER direction.

Sublime Trading | Donchian Breakout SignalsWhat kind of traders/investors are we?
We are trend followers. Our scripts are designed to be used on the higher timeframes (weekly/daily) to catch the large moves/trends in the market.
Most have heard of long-term trend following. Few know how to execute the strategy.
Our scripts are designed specifically to identify and invest in long-term market trends.
What does this script do?
It produces entry signals in a confirmed bull and bear trend.
The logic is based on Donchian 20, which serves the following two purposes:
1. Confirms end-of-day entry points in a long-term trend
2. Filters out entry points in a sideways market
The signal is produced on a break and close of the Donchian 20 high in a bull trend and a break and close of the Donchian 20 low in a bear trend.
How is the entry price produced?
The entry is based on a percentage value of the range of the breakout bar added to the high of the bar in a bull trend.
In a bear trend, the percentage is subtracted from the low of the bar.
This gives an objective entry when placing a position once the OHLC of a bar is confirmed at the end of the trading day.
How is the stoploss price produced?
The script uses the formula ATR 15 x 4.
We use ATR as it produces a stoploss which is unique to the volatility of the asset. The more volatile the asset, the wider the stoploss.
We use ATR 15 as it brings an average reading across half a month, incorporating days of extreme volatility.
The multiplier 4 works well to avoid positions being stopped out prematurely on pullbacks.
When the stoploss is hit, there is when traders and investors may consider exiting positions.
What is the best timeframe to use the script?
We recommend the daily timeframe as this is where trader and investors identify and enter long-term market trends.
The higher timeframes are where traders and investors take fewer positions but hold for longer time periods.
As a result, trend followers place priority on the quality of the entry rather than quantity.
What makes this script unique?
This script has been coded specifically for the daily timeframe to:
Highlight the start of a potential long-term trends.
Confirm entry points at the end of the trading day, absorbing intraday noise.
Reduce fake breakouts in a trend.
Continue to create entry points as the trend develops to allow for compounding.
Filter out breakouts in a sideways market.
This entry signal script helps traders and investors focus on the quality of a potential position when investing in long-term market trends.

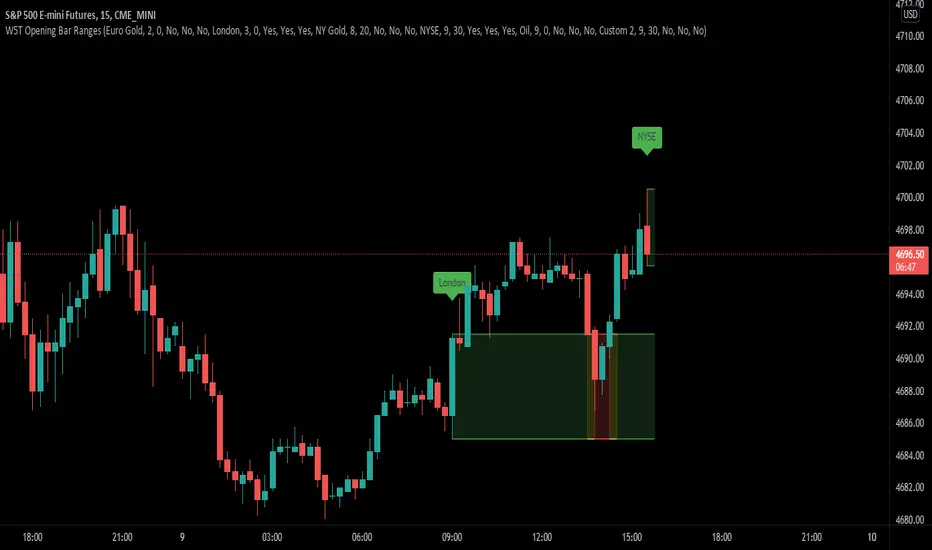
XBrat Range Breakout - Defining Ranges & The Trading BiasxBrat Range Breakout
Designed to help define opening ranges of major markets, along with Gold Pit opens, Oil Pit opens and for major economic data points. We recommend timeframes for opening ranges on different type of instruments further down this description
There are 6 range data points available, 4 of which are pre-defined (but can be adjusted and renamed) and then 2 spare for those important data points. All the times and label names can be adjusted.
4 Pre-Defined Openings are:
Europe Gold Pit Open (8am Europe time)
London Stock Exchange Open (9am Europe time)
New York Gold Pit Open (8.20am EST)
NYSE Open (9.30am EST)
The range is defined by a parallel coloured cloud which changes colour depending on the BIAS of the opening range, calculated automatically for our users. At the same time the Open Tag is also coloured to help identify the BIAS and indeed which direction traders should trade the Range Breakout after the first candle has closed. The range BIAS continues to be drawn on the chart until the following days open. The colour will change as per the BIAS of that opening range. This allows for multiple entries of breakouts of the defined range throughout the following 24 hours.
Range Breakout BIAS Colours
Green - Bullish BIAS - When first candle has closed only look for breakouts to the upside
Red - Bearish BIAS - When first candle has closed only look for breakouts to the downside
Yellow - Neutral BIAS - When first candle closed, look for breakouts to both upside and downside or best not to trade the breakouts as neutral BIAS indicates indecision
Time Frames we suggest for open ranges of any market open or data points are:
Metals & Energy Futures or CFDs - 5 minute time frame
Currencies - Forex Pairs or Futures - 10 minute time frame
Index Futures or CFDs - 15 minute time frame
ETS Breakout LevelsThis indicator mimics the breakout levels a professional trader would draw and watch for trading opportunities. It is a very powerful tool to have.
The lines are drawn as soon as a new breakout level is detected, and the line is then automatically extended to the right, making it easy to see when the market reacts to it.
Knowing where important levels on a chart are, immediately takes you from having no idea where the market might make a big move, to being a trader ready to take action at the right time.
The Breakout Levels indicator is also very good at keeping you out of the market when it's simply choppy and difficult to trade, because the breakout levels will most likely fall outside of the choppy sideways consolidation area, but still prepare you for when the market finally picks a direction again.
This indicator also includes colored time bands that mark times during the trading day where historically stocks often reverse course, or may enter a period of consolidation. These times coincide with tea breaks, lunch breaks or times when news are typically announced.
For Forex traders, there are colored session bands that help you to easily see when the major markets are open.
What Makes It So Powerful?
- Give you a signal as early as possible and does not "repaint" once the bar completes
- Reacts to fast market direction changes like a master trader
- Is super easy to understand and implement in your trading
- Can be used for Forex, Stocks and Crypto
- Works on all timeframes
This indicator also has a number of options you can change in Settings:
1. "Safety Margin" - I keep this at zero, but if you want a bigger "buffer" for safety before entering a trade you can increase this value.
2. "Hidden Above Interval (Minutes)" - The Forex sessions or Stock important daily times can be set to be hidden above a certain timeframe to keep your charts clean.
3. "Show Moving Averages" - All of the moving averages that are included for convenience can be shown or hidden by setting this value.
3.1. The next 5 settings all deal with moving averages that can be shown or hidden individually.
4. "Show Stock Pivot Times" - There are a number of trading times for US Stocks that are important during the trading day, and this setting will highlight them.
4.1. "Show Main Stock Pivot Times" - This shows only the Stock trading times that are deemed the most important, and around these times the market often change direction (e.g. after the morning break, after lunch, etc.)
5. "Show Forex Sessions" - Does pretty much what it says, and you can also adjust the hours if you wish.
6. "Extreme Move Reversal Points" - If an extreme market move has been detected, and this is enabled, a "X" will be shown above or below the bar to indicate that the market might reverse.
7. "More Signals" - If you want to see more potential breakout levels, enable this option.
8. "Show VWAP" - This will include the VWAP indicator as a convenience if selected.
How To Use the ETS Breakout Levels Indicator
1. Add the indicator to any chart you wish to trade, Crypto, Forex or Stocks and set it to the timeframe you prefer. For instance, I use it on 1 minute and 5 minute charts for daytrading Stocks. For Forex I generally use a 15 minute chart, and longer timeframes for Crypto.
2. Open the Settings and change values to suit your requirements as described above.
3. When the indicator has determined that a new breakout level has formed, it will draw a line and extend it to the right so that you can see when future bars come close to it.
4. Price action will either bounce off it, or pierce through it and continue on.
5. If the market is relatively far away from smaller moving averages such as the 9 EMA or 20 EMA, expect that the price action might first move back to the moving averages before continuing in the new direction identified by the indicator.
6. When these levels are broken, it is often an indication of a breakout occurring and it can give you some very significant market moves.
This is an "invite only" script, which means that you will need to let me know that you're interested in it before you can get access to it. This is a paid script, please follow the link in my profile to get the details or ask me directly. It may take up to 48 hours for me to respond, but I do my best to respond as quickly as possible. You will get 7 days to test it for yourself on all your charts with no restrictions.

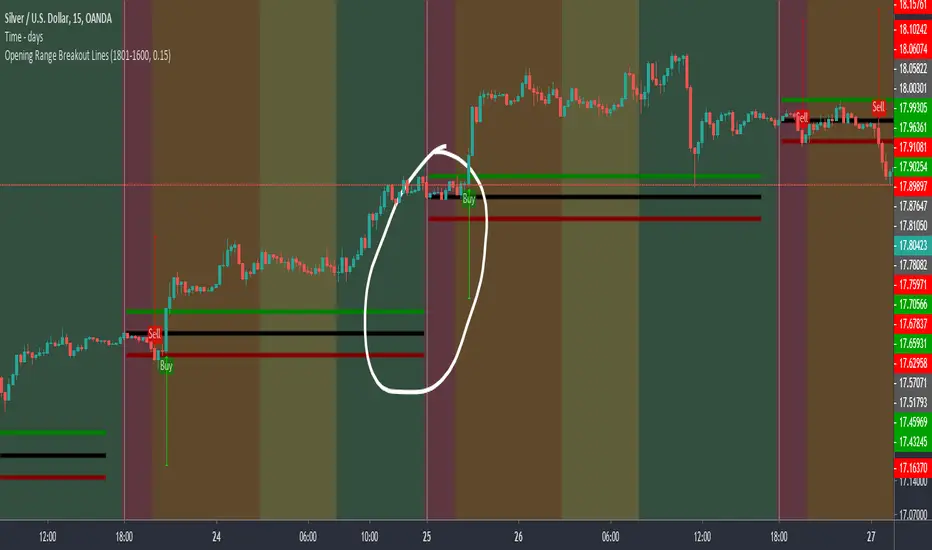
Opening Range Breakout LinesDisclaimer: Use proper risk management and remember that all trading involves risk.
Based on RicardoSantos' "Open Session Breakout Trader Strategy"
I turned it into a study and tweaked it for trading Silver
My goal when creating this was to help visualize breakout lines for multiple trading days at the same time without having to always draw them in.