Take Profit Again Trend Score(Crpto Catcher)_BinanceTPA SCORE_BINANCE ver
또땃 스코어 바이낸스 ver
------------------------------------------------------------------------------
This indicator is designed to find coins that are strong in market conditions.
It is recommended that users have an understanding of basic charts.
Careful investment is needed after the trend of the score itself has been on the downward trend.
Coins usually give the strongest return that run at the top of the score.
The realization of the profit on the chart must be done by the person himself.
When purchasing coins at the top of the score chart, we recommend the number of sheets at the adjustment point on the chart.
Because this index is a trend score, you may not be able to catch the start wave. To do this, use a starting wave catcher.
The coins listed in this index are coins of the highest rank in order of trading volume and will be updated at regular intervals.
At last year's rise of coin, it is based on catching light coin, Qtum, ripple, Ada, Stella, Tron rise.
Indicator vouchers will only be available to a small number of paid subscribers.
Thank you.
---------------------------------------------------------------------------------------------
이 지표는 시장 상황에서 강세를 띠는 코인을 찾아내기 위해 만들어 졌습니다.
기본적인 차트에 대한 이해가 있는 사용자가 사용하길 권합니다.
스코어자체의 추세가 하향을 한 이후는 신중한 투자가 필요합니다.
통상 가장 강한 수익을 주는 코인이 스코어 최상단을 달립니다.
차트상의 수익실현은 본인이 직접 수행해야 합니다.
통상 스타팅 파동을 잡아내는 스타팅 파동 캐쳐와 함께 사용합니다.
스코어차트상 최상단의 코인을 매수 할 시 차트상 조정지점에서 매수를 권합니다.
본 지표는 트렌드 점수 이기 때문에 시작 파동을 잡아내지 못할 수 있습니다.
이를 위해선 스타팅웨이브 캐쳐를 함께 사용합니다.
본 지표에 나와있는 코인들은 거래량순으로 상위등급의 코인들이며 일정 간격으로 업데이트 될 것입니다.
작년 코인상승장에서, 라이트코인,Qtum,리플,에이다,스텔라,트론 상승을 잡아낸 기반지표 입니다.
지표 이용권은 소수의 유료 구독 사용자들에게만 공개될 예정입니다.
감사합니다.
Buysignal

Looney's Forex Buy SignalsI created this Forex buy signal indicator to save myself some time when looking for buy opportunities. The signals are generated from a combination of several indicators such as the RSI, MACD, Wave Oscillator etc. I spent alot of time tweaking all the values to give me reliable signals. I trade one hour candles and generally get 50+ pips per signal.
If price goes down after the first signal and I get another signal, I buy again which means I get a average buy price (dollar cost average) and then sell when it reaches my profit level.
Alerts are built-in as well. The indicator does repaint at the moment so set the alert to "on candle close" to ensure that you get a valid signal. Longer timeframes works better and as mentioned I use 1 hour candle.
I will release the back-test of this indicator shortly where you can then enter your capital amount and set profit & stop loss levels to see how you would have performed based on historical data.
The current version is free and I will grant access on request.
Comments & suggestions welcome.

MadLad v0.01 (Buy/Entry Signals)This script is a very rough, very early release of a project called madlad (www.twitter.com).
Currently being used on BITSTAMP:XRPUSD 5 Min Heiken Ashi.
It's a very early concept. It is also very aggressive , therefore it spams buy signals. The buy symbols do not mean enter, they are simply potential entry points.
You can see this especially during heavy drops, I would generally wait for the end of the shading to make an entry. Aqua shading is simply confluence with another indicator.
Feel free to mess around with some of the settings, however most are just placeholders and do little to nothing.
I will eventually update this to remove some of the spammy buy signals. If you use this with some other indicators, it will definitely help remove a bit of the spammy-ness.
In the meantime though, if anyone is able to come up with their own solutions on avoiding bad trades while using the "buy" signals, feel free to DM me and or post in the comments.
Follow www.twitter.com
There we will be posting updates and entry/exits in realtime! For free, no signal group BS or anything, this comes at the cost of signals not always being correct so always trade at your own risk!

Draculapresley's Daytrading Scalping STRAT O' DoomUsing some custom settings with a few indicators and a custom movement algorithm I have backtested this script and used it with great results. Excellent for getting in and out for quick scalping trades. The results are typically 1% + and sometimes even a great deal more. The indicator gives you buy and sell points and works great with 15 min candles though you can modify the inputs to work with any time frame. Use all 3 indicators for safest bets but most of the time just using the Stoch input with the movement algorithm almost always yields positive results with tons of buys. Works pretty well even in a downturn but absolutely kills in a bull market.
Check out the screenshots below.
imgur.com

VJ_Volume_Longs_Shorts_IndicatorThe indicator is based on the real-time volume in the market, Macd and Bollinger Band.
Green Bars in the histogram indicate high buy volume and prospective long position
Gray Bars indicate low volume and no trade zone
Red Bars indicate high sell volume and prospective short position
Best used with Bitcoin.
Could use this indicator along with your favorite indicator to get to know the direction of the market with respect to volume and since this is a script, you can set alerts too.
Happy Trading

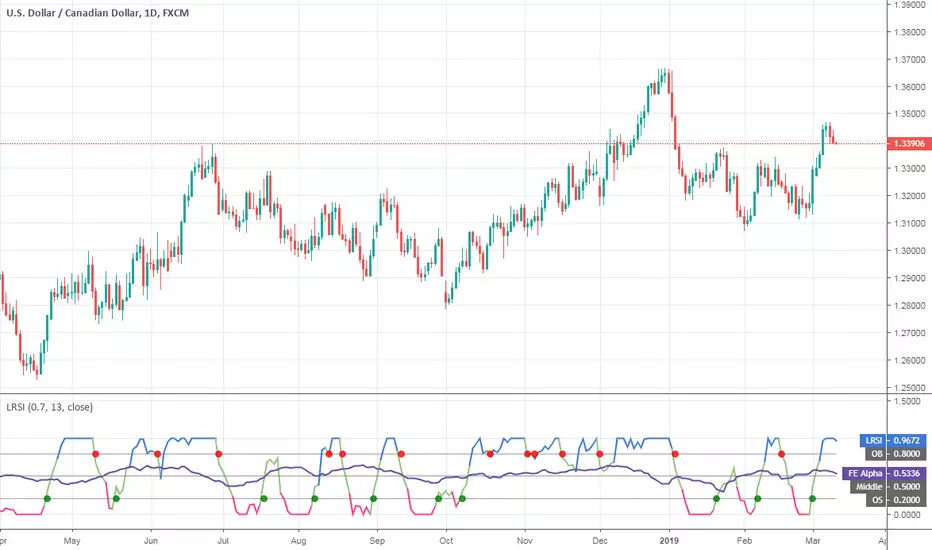
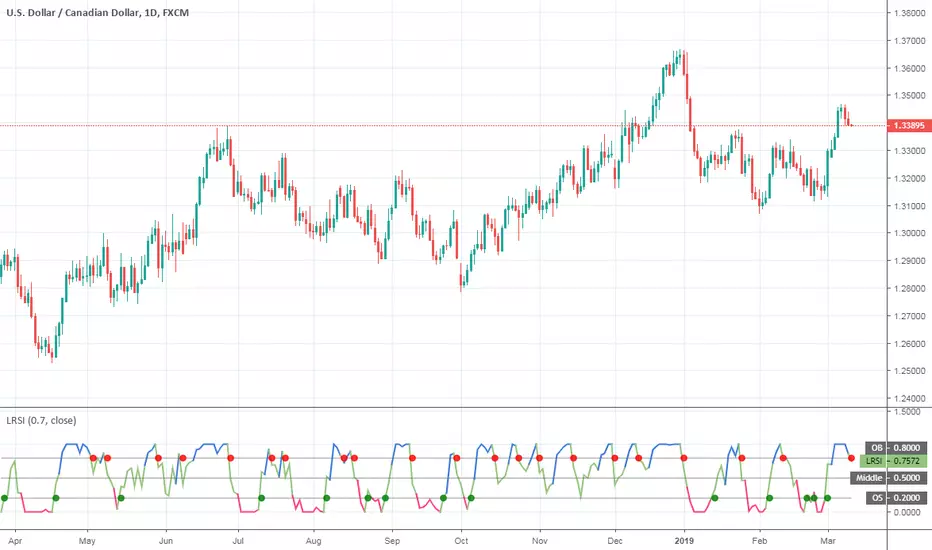
Laguerre RSI (Self Adjusting Alpha with Fractals Energy)Laguerre RSI (Self Adjusting Alpha with Fractals Energy) indicator script. I adopted idea from www.prorealcode.com and
If you disable `Apply Fractals Energy` option, you will get the original Laguerre RSI.
SMMA Analyses - Buy / Sell signals and close position signals This script combines the usage of the SMMA indicator in order to provide signals for opening and closing trades, either buy or sell signals.
It uses two SMMA , a fast and a slow one, both configurable by the users.
The trigger of Buy and Sell Signals are calculated through the SMMA crosses:
Buy Signals : The fast SMMA crosses over the slow SMMA . They are highlighting by a green area and a "B" label.
Sell Signals : The fast SMMA crosses under the slow SMMA . They are highlighting by a red area and a "S" label
The trigger of Close Buy and Close Sell Signals are calculated through the close price crosses with the fast SMMA:
Close Buy Signals : The fast SMMA crosses under the close price and at the same time the trend is bullish , so the fast SMMA is greater than the slow SMMA . They are highlighted by a lighter green area
Close Sell Signals : The fast SMMA crosses over the close price and at the same time the trend is bearish , so the fast SMMA is lower than the slow SMMA . They are highlighted by a lighter red area
Few important points about the indicator and the produced signals :
This is not intended to be a strategy, but an indicator for analyzing the SMMA conditions. It gives you the triggers depending on the real time analysis of the SMMA and prices, but not being a proper strategy, pay attention about "fake signals" and add always a visual analysis to the provided signals
Following this indicator, the trade positions should be opened only when a cross happens. Either in this case, analyse the chart in order to see if the signals are a "weak" ones, due to "waves" around the SMMA . In these cases, you might wait for the next confirmation signals after the waves, when the trend will be better defined
The close trade signals are provided in order to help to understand when you should close the buy or sell trades. Even in this case, always add a visual analysis to the signals, and pay attention to the support/resistance areas. Sometimes, you can have the close signals in correspondence to support/resistance areas: in these cases wait for the definition of the trend and eventually for the next close trade signals if they will be better defined

Crypto Buy/Sell Signals - AutoView - CryptoProToolsOur first indicator for use with Autoview / Gunbot or any other TradingView compatible trade bot.
The script uses a bunch of rules to filter out as many bad signals as possible.
Consider this the BETA version with more updates to come.
Current CryptoProTools members who want access just message me.
Get 10% OFF any AutoView Subscription with the coupon : JVBHV-BUTY0-F863G

Relative Strength Money Flow RibbonThis is a hybrid of both the RSI and MFI indicators.
Includes options to show coloured alert bars when threshold limits are reached.
Includes:
RSI indicator - yellow line
MFI indicator - green line
Customisable limits include:
Top threshold - 80
Upper limit - 70
Middle line - 50
Lower limit - 30
Bottom limit - 20

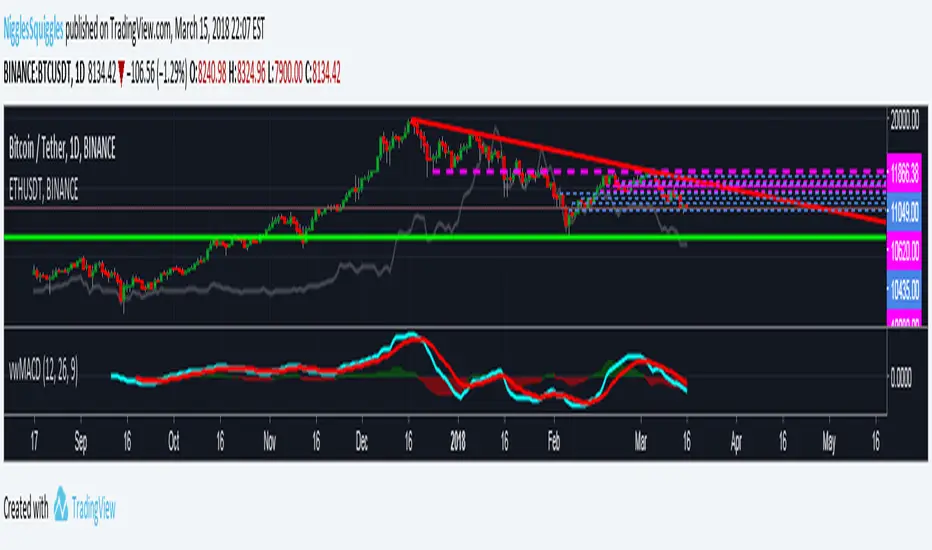
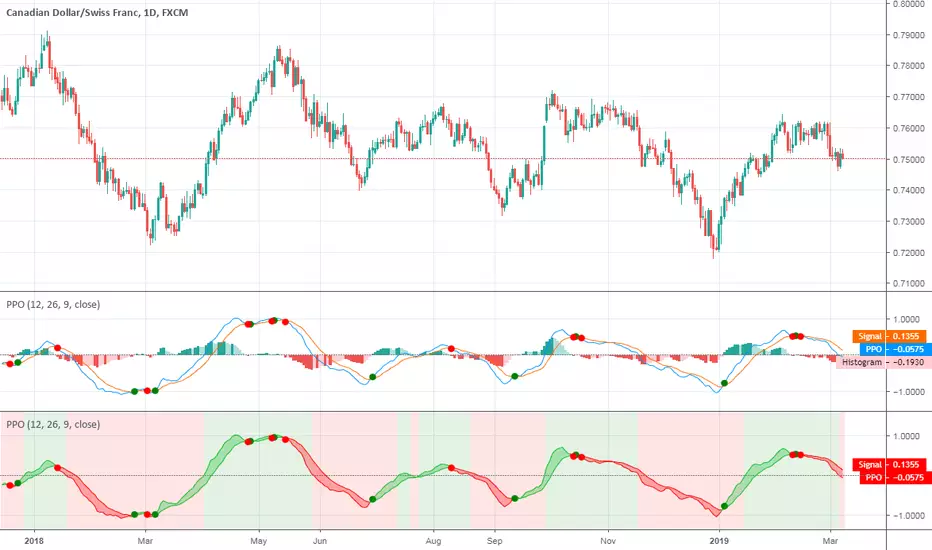
Volume Weighted MACDThis is just like the normal MACD indicator, except that the values are Volume Weighted and the Histogram changes colour depending on the positive or negative value

1min_&15min_Crypto_indicatorDear users,
This indicator used Fibonacci, MACD, RSI and Volume.
You just need to consider the "B" signal for Buy and "S" for sell your position...
Color candles stick are just here to confirm the position and use different setting less risky than B and S signals.
If you want to use the maximal potential of this indicator to buy and sell correctly I suggest you to buy and sell with B and S signal and to cut your position to the next B and S signal. You can also choose to cut your position to the next candle stick color... for less risky.
The backtesting of this indicator is 73.6% of good trades on 15 min candlestick and 81,6% on 1 minute candlesticks on BTCUSD. Same indicator is available for equities. (Min&15min_Equity_indactor_V14_Moriceau)
If you have any comment, let me know.

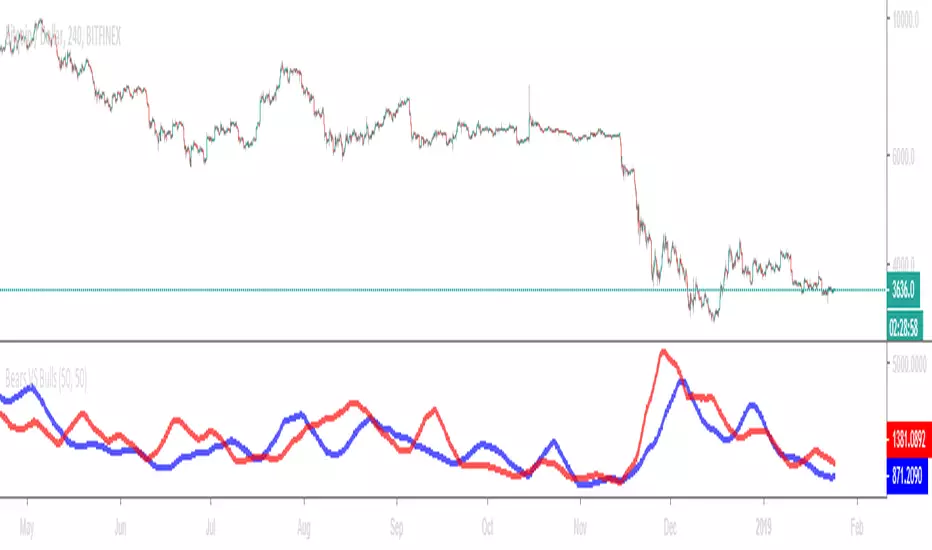
Bears VS BullsThis indicator will work on ANY instrument.
The red line is a moving average of ONLY sellers in the market.
The blue line is a moving average of ONLY buyers in the market.
The period or "length" of the individual moving averages can be adjusted in the indicator settings.
The default, it is set to 50.
Buying and selling trends often provide indications of market moves such as the most recent bottom in Cryptocurrencies.
Feel free to comment and share any indicator concepts or ideas for content you would like to see added to the Technical Indicator Bundle on www.kenzing.com
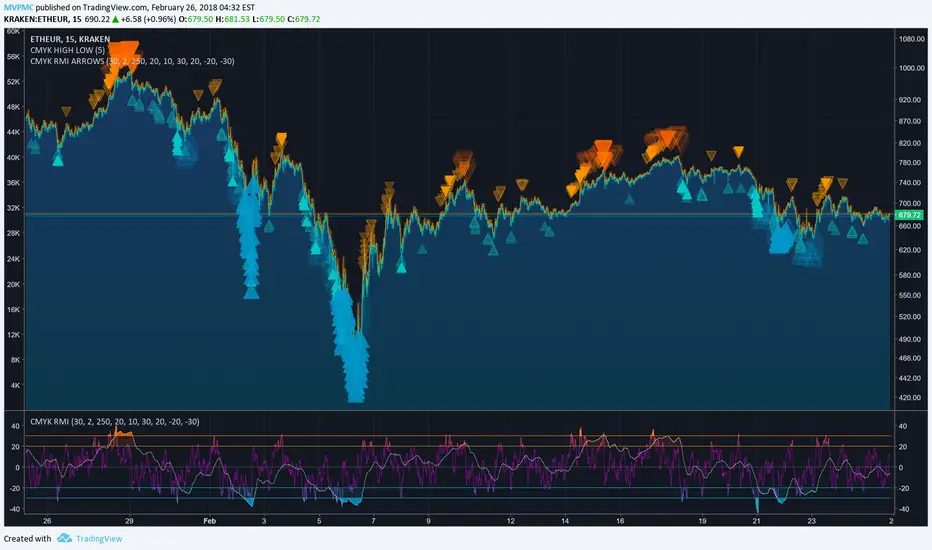
CMYK RMI ARROWS◊ Introduction
I started using this script because of its fast reaction, and good tell for buy/sell moments.
For larger timescales, the overall trend should be taken into account regarding the levels.
In the future i will update this indicator, to automatically adjust those.
This is the Overlay expansion of the Indicator Linked below.
◊ Origin
The Relative Momentum Index was developed by Roger Altman and was introduced in his article in the February, 1993 issue of Technical Analysis of Stocks & Commodities magazine.
While RSI counts up and down days from close to close, the Relative Momentum Index counts up and down days from the close relative to a close x number of days ago.
This results in an RSI that is smoother.
◊ Adjustments
CMYK color theme applied.
Four levels to indicate intensity.
Two Timescales, to overview the broader trend, and fast movements.
◊ Usage
RMI indicates overbought and oversold zones, and can be used for divergence and trend analysis.
◊ Future Prospects
Self adjusting levels, relative to an SMA trend.
Alternative RMI, which functions as an overlay.
◊ ◊ ◊ ◊ ◊ ◊ ◊ ◊ ◊ ◊ ◊ ◊ ◊ ◊ ◊ ◊ ◊ ◊ ◊ ◊ ◊ ◊ ◊ ◊ ◊ ◊ ◊ ◊ ◊ ◊ ◊ ◊ ◊ ◊ ◊ ◊ ◊ ◊ ◊ ◊ ◊ ◊ ◊ ◊ ◊ ◊ ◊ ◊ ◊ ◊ ◊ ◊ ◊ ◊ ◊ ◊ ◊ ◊ ◊ ◊ ◊ ◊ ◊ ◊ ◊ ◊ ◊ ◊ ◊ ◊ ◊ ◊ ◊ ◊ ◊ ◊ ◊ ◊ ◊ ◊ ◊ ◊ ◊ ◊ ◊ ◊ ◊ ◊ ◊ ◊ ◊ ◊ ◊ ◊ ◊ ◊ ◊ ◊ ◊ ◊ ◊ ◊ ◊ ◊ ◊ ◊
░▒▓█ CMYK ◊ RMI █▓▒░
GR-Moving Average CrossA simple indicator that contains all the main Moving Averages you'll probably need.
This indicator can be used on any time frame you wish.
The default periods for the moving averages are 5, 10, 20, 50, 100 & 200.
However you can set these values to whatever works for you, for example 5, 8, 10, 21, etc.
Please let me know in the comments below which values you use the most, so that I can adjust the defaults accordingly.
The lines get darker and thinker the more periods the MA covers.
You can easily adjust the colours of the lines and their thickness too.
The current colours seem to work OK on both the light and dark TradingView themes, but please do make suggestions for better default value.
You can also choose between 7 different ways of calculating the moving averages:
!None = You don't want to see this line
SMA ( Simple Moving Average )
EMA ( Exponential Moving Average )
WMA ( Weighted Moving Average )
DEMA ( Double Exponential Moving Average )
TEMA (Triple Moving Average
HMA ( Hull Moving Average )
This indicator can also show basic buy & sell zones.
They work well after steep trends, but will give lots of poor signals in a sideways moving market.
I find that the sell signal is more reliable than the buy signal.
Use these indications with caution and definitely combine them with other data/indicators as they are only based on the moving averages.
Comments and suggestions are most welcome.
I'm available for hire to create custom indicators or to work on more complex projects.

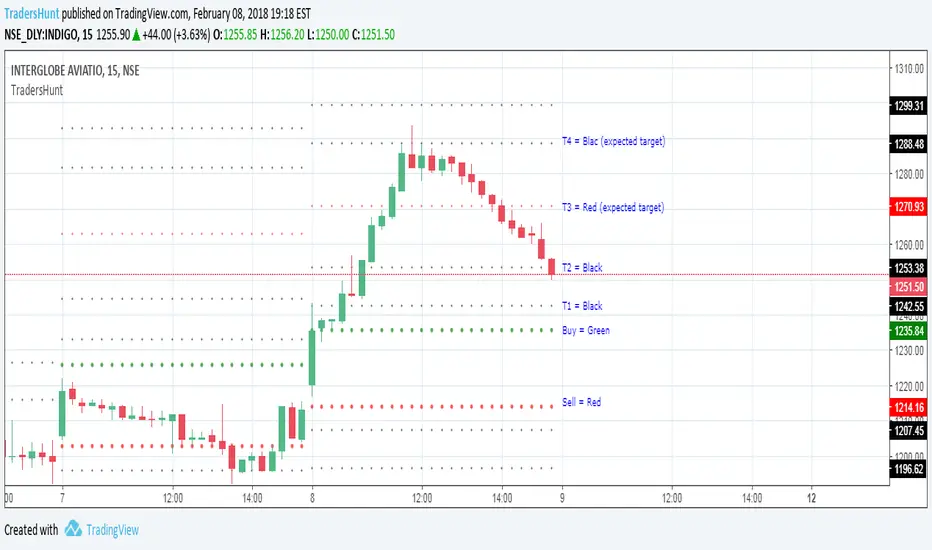
TradersHunt Buy & Sell LevelsTradersHunt's Buy & Sell Indicator is designed for Intraday Trading for Indian Market but it can also be used for Global Markets and Commodities. It is based on Support & Resistance Levels.
The details are as follows;
Green Level indicates buy price, a trader should wait for 15min candle to close above it and Red level can be used as SL if trader is taking long position. The Black colored levels above Green are Targets for taken Long Position. Similarly red colored level indicates Sell value and levels below it are targets for short position.
visit our website www.tradershunt.com for more information.
BSES - v1Buy and Entry signals for a trading pair.
Red and Black bars are selling zone, while green and blue bars are buying zones.
Black and Blue bars are better entry points than their counterparts (red and green ones), and can be highlighted using background coloring of the script.
This is extremely useful in detecting selling zones in a downtrend or buying zones in an uptrend.
Performs best in 2h candles, but can be used on any candle length.
Here is the fun part: Use this script on a 1 minute candle for intraday trades and have fun, profiting!!!

Kujira Bottom Wizard v7.1Bottom finder for Cryptocurrencies - updated to include higher volatility in S* coins as well as top 100 marketcaps.

Buy + Sell [CryptoJewish]Beta
This indicator helps identify areas of buying and selling.
There are 4 levels of signals.
1. Weak
2. Medium
3. Strong
4. Extremely strong
Also there is a lagging indicator, which gives a signal of the 2nd level.
Levels greater than 1 are highlighted with a background and the color of the last bar is mixed with the color of the signal.
Almost everything can be turned on / off.
---
Additionally included:
- Ichimoku Cloud with settings for crypto (pure cloud, no extra lines)
- Bollinger Bands
- 4x SMA with a cross between them
Mayer Multiple v2.0 - Klahr ThresholdThis is a simple update to the Mayer Multiple script by Unbound , which charts an indicator created by Trace Mayer and popularized by Preston Pysh.
The original post identified any price below 2.4x the 100-day MA as the BTC buy threshold. While the logic there is historically sound, it does not account for the fact that the BTC trend is parabolic in nature. With that in mind, I've attempted to update the 2.4x multiple to react based on the moving average of the Mayer Multiple itself. To do so, I simply found the number that, when added to the MM moving average, historically hit the 2.4x multiple during periods of low volatility. This turns out to be 1.17.
The green line represents the Klahr Threshold (is it obnoxious if I call it that? I've always wanted an indicator named after me). As you can see from the above chart, it hovers around 2.4x in late 2012 to early 2013, rises above it until mid 2014, and then stays below until 2016. It then stays almost exactly at 2.4x until April 2017, when it rises significantly above it for the first time since July 2014. The convergence in late 2012 and 2016-2017 is what leads me to believe that this should be the basis for the updated threshold.
It's entirely possible that there's a more robust method of calculating a reactive threshold (or a different number that should be added to the multiple's MA), but I think this is a good first step in refining the multiple to withstand the test of time.
