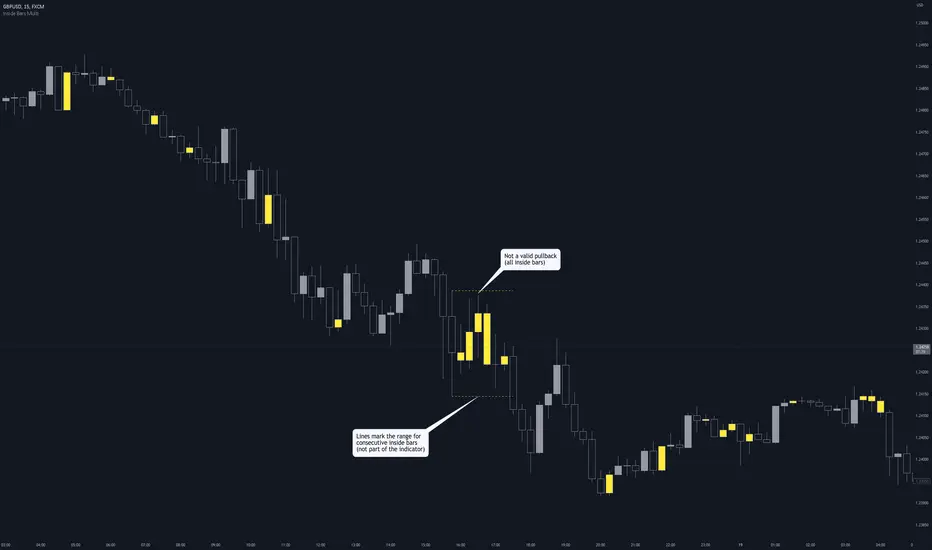
Inside Bars (Multiple / Consecutive)Description
When an inside bar is found, the indicator remembers the high and low (= range) of the candle before the inside bar.
As long as price moves within the range, every bar is highlighted as an inside bar to the range.
Purpose
The indicator can assist when identifying valid pullbacks and buy-side liquidity (BSL) / sell-side liquidity (SSL).
Candlestick Analysis
The Golden Candlestick PatternThe Golden pattern is a three-candlestick configuration based on a variation of the golden ratio (2.618) from the Fibonacci sequence.
The bullish Golden pattern is composed of a normal bullish candlestick with any type of body, followed by a bigger bullish candlestick with a close price that is at least 2.618 times the size of the first candlestick (high to low). Finally, there must be an important condition that is, a third candlestick that comes back to test the open of the second candlestick from where the entry is given.
The bearish Golden pattern is composed of a normal bearish candlestick with any type of body, followed by a bigger bearish candlestick with a close price that is at least 2.618 times the size of the first candlestick (high to low). Finally, there must be an important condition that is, a third candlestick that comes back to test the open of the second candlestick from where the entry is given.

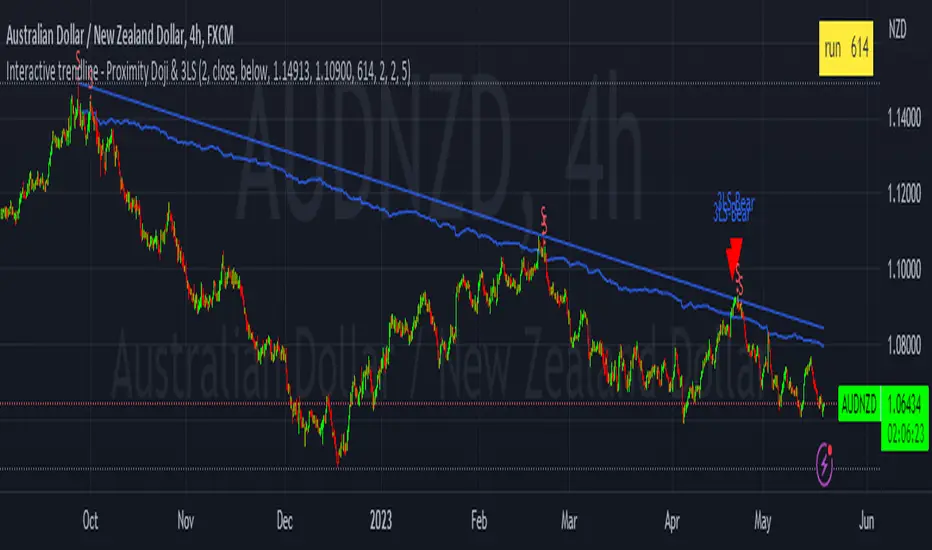
Interactive trendline - Proximity Doji & 3LSThis script was developed with Blockhead305 (seriously talented) and uses 1) the Three Line Strike from The Moving Average as well as 2) an original doji script written for me and 3) the Interactive Trendline as developed by Blockhead305. The basic premise is that should a doji or Three Line Strike occur within a customizable ATR distance from your trendline, an on-chart notification will appear or you could set an alarm to warn you if this has happened.
How to set this up:
Step 1 - Find a a trend
Step 2 - Identify the candles that touches the trendline
Step 3 - Click on the indicator
Step 4 - Set the X1 and Y1 coordinates for the start of the trend
Step 5 - Set the X2 and Y2 coordinates for the last relevant candle of the trend
Step 6 - Write the number in the yellow box down (in this case 880)
Step 7 - Open the settings of the indicator
Enter the number from the yellow box into the box titled "Run" - Press "OK"
Step 8 - Chart should/could now show Buy/Sell Signals for the Dojis and/or Bullish or Bearish Three Line Strikes
Notes
1. If your trendline is bearish (X1/Y1 is higher than X2/Y2) only bearish signals will appear and vice versa
2. You can change the ATR multiples from trendline in the settings - I prefer 2 (which is also the default)
3. You can toggle Big Engulfing and/or Three Line Strike on or off (exact functionality as per The Moving Average functionality)
4. You can construct the type of doji you would like to see at the bottom of the settings screen - I prefer the following settings:
Dominant Wick Multiple - 2
Recessive Wick Multiple - 2
Body Multiple - 5
5. I place my SL above last high (shorts) or last low (longs) but could also use the trendline for this
6. I use TP with RRR off 1:2 but much more is obviously possible.
7. ONLY ONE INTERACTIVE TRENDLINE CAN BE USED ON THE SAME CHART
8. THE NUMBER IN THE YELLOW BOX IS RELEVANT TO THE TIMEFRAME THAT THE TRENDLINE WAS CREATED ON. IF YOU CHANGE
TIMEFRAMES IT WILL NOT WORK
Happy to receive constructive criticism and/or suggestions for improvements on the settings.
Doji Pattern 1 Hr BY J.GrimanPatron de Doji de cuerpo real, para el periodo de tiempo en 1 Hora para los mercaods bursatiles.

shadow barThis indicator shows a new formation of retrospective candlestick bars of one period (n) of time.
In this way the trader can see how the traditional bars are part of a larger formation that can show a trend or a range.
The new shadow bars are drawn with a degree of transparency that makes it possible to distinguish traditional candlesticks;
and where shadow candles can be seen as support or resistance to traditional candlesticks.
When the traditional candlesticks are the same size as the shadow candlesticks, it can be expected that we are forming a compression or range that will result in a strong move.
In addition to the shadow bars, there is a ribbon created from the new candlestick data that is formed as a line from the linear regression function and another that is the previous line smoothed by its exponential moving average. This tape allows you to see the trend more clearly and at the crossovers of the lines that form possible reversals or continuations of the trend. The indicator has the timeframe field active, which allows the indicator to be displayed in other temporalities.
*The closing price of the new bars is the same as that of the traditional bars.
* The tape is turned off by defa

Volume Tick ExperimentThis ticks-based indicator provides real-time volume information for a trading asset. Volume is analyzed and updated continuously, not just at candle close. It is based on DGT's Bull vs Bear Power indicator but adds a gas signal that activates when buying or selling volume percentage reaches a predetermined threshold.
This indicator can also help traders determine the direction and aggressiveness of pushes in buying or selling volume. By monitoring the volume percentages and gas signals, traders can get an idea of whether the market is pushing in a particular direction and how strong the push is. This information can be helpful in making trading decisions and identifying potential entry or exit points.
The indicator uses open, high, low, and close prices of the asset to calculate volume information. It determines the average volume over a selected period and calculates volume for both buying and selling. This information is used to calculate the percentage of buying and selling volume. A gas signal is triggered when either the buying or selling percentage reaches a predetermined threshold.
Enjoy!

Candles - 2 or 3 consecutive pattern + Custom pips thresholdFEATURES:
- Detect a 2 or 3 consecutive candlestick pattern. Input the value into the first input value.
- Choose the minimum and the maximum amount of pips of the candle that you want to detect. The indicator will detect candles within that pips range and highlight the consecutive pattern
- Choose to not use the pips threshold. If disabled the indicator will constantly check for consecutive candles pattern.
- Choose if calculate pips taking into consideration OC (Open - Close of candles - Body) or HL (High - Low - Body + Wick)
VISUALS:
- Enable Boxes: when enabled a box is drawn around the pattern detected
- Enable Lines: when enabled lines from top/bottom/mid of the boxes are drawn
- Extend the lines
BuP = Bullish Pattern
BeP = Bearish Pattern
AIM:
The aim of the indicator was to spot 2 common patterns in one indicator: Three White Soldiers and Three Black Crows
The rest is all implementation because I like coding.
Anyway on all timeframes 3 consecutive candles with a similar body length seems to be an alarm that Market Makers are joining the gfame before a major manipulation so it worth keep an eye on those.
From my experimentation from ltf 1 minute timeframe to htf 1H timeframe, 3 consecutive candles with a body length between 10 and 20 pips could be the ones to keep an eye on before a reversal or a strong continuation.
For sure they are zonez and levels where MM would come back later.
Adjust the settings as you want and happy trading!
This is just an indicator nothing more

Volatility patterns / Flowly Indicators- Overview
Volatility patterns detect various forms of indecisive price action, on a larger scale as a compressed range and on a smaller scale as indecision candles. Indecisive and volatility suppressing price action can be thought of as a spring being pressed down. The more suppression, the more tension is built and eventually released as a spike or series of spikes in volatility. Each volatility pattern is assigned an influence period, during which average and peak relative volatility is recorded and stored to volatility metrics.
- Patterns
The following scenarios are qualified as indecision candles: inside candles, indecision engulfing candles and volatility shifts.
By default, each indecision candle is considered a valid pattern only when another indecision candle has taken place within 3 periods, e.g. prior inside candle + indecision engulfing candle = valid volatility pattern. This measurement is taken to filter noise by looking for multiple hints of pending volatility, rather than just one. Level of tolerated noise can be changed via input menu by using sensitivity setting, by default set to 2.
Sensitivity at 1: Any single indecision candle is considered a valid pattern
Sensitivity at 2: 2 indecision candles within 3 bars is considered a valid pattern
Sensitivity at 3: 2 indecision candles within 2 bars (consecutive) is considered a valid pattern
The following scenarios are qualified as range patterns: series of lower highs/higher lows and series of low volatility pivots.
A pivot is defined by highest/lowest point in price, by default within 2 periods back and 2 periods forward. When 4 pivots with qualities mentioned above are found, a box indicating compressed range will appear. Both required pivots and pivot definition can be adjusted via input menu.
- Influence time and metrics
By default, influence time for each volatility pattern is set to 6 candles, a period for which spike(s) in volatility is expected. For each influence period, average relative volatility (volatility relative to volatility SMA 20) and peak relative volatility is recorded and stored to volatility metrics. All metrics used in calculations are visible in "Data Window "tab. Average and peak volatility during influence period will vary depending on chart, timeframe and chosen settings. Tweaking the settings might result in an improvement and is worth experimenting with.
- Visuals
By default, indecision candles are visualized as yellow lines and range patterns as orange boxes. Influence time periods are respectively visualized as colored candle borders, applied as long as influence time period is active. All colors are fully customizable via input menu.
- Practical guide
Volatility patterns depict moments of equal strength from both bulls and bears. While this equilibrium is in place, price is stagnant and compresses until either side initiates volatility, releasing the built up tension. On top of hedging and playing the volatility using volatility based instruments, some other methods can be applied to take advantage of the somewhat tricky areas of indecision.
Example #1: Trading volatility
Volatility is not a bad thing from a trading perspective, but can actually be fertile ground for executing trade setups. Trading volatility influence periods from higher timeframes on lower timeframes gives greater resolution to work with and opportunities to take advantage of the wild swings created.
Example #2: Finding bias for patterns
Points of confluence where it anyway makes sense to favor one side over the other can be used for establishing bias for indecisive price action as well. At face value, it makes sense to expect bearish reactions at range highs and bullish reactions at range low, for which volatility patterns can provide a catalyst.
Example #3: Betting on initiation direction
Betting on direction of the first volatile move can easily go against you, but if risk/reward is able to compensate for the poor win rate, it's a valid idea to consider and explore.

Wick Delta vs Body/Wick BiasThe top and bottom of this indicator use the same logic as my Wick Delta script, but it displays differently, visualising the rejection or buy/sell pressure that wicks can represent. Outliers are highlighted in darker colours and often show inflection points, particular if they've just wicked into liquidity. So the start or end of moves, or a trend change. They can also happen for no reason, or just be a stop hunt. It's all about context, like everything in technical analysis.
The new addition is the centre line which shows whether wicks or bodies or in charge. Kinda like Average True Range (ATR) this script calculates Average True Bodies (ATBs) and compares it with Average True Wicks (ATWs) and shows when one or the other is in charge. So if candle wicks are bigger (>50%) than bodies, you'll see skinny, wick-like columns, and if the bodies are bigger you'll seen thicker, body-like columns. These can show inflection points too.
Keen to hear how people use this, and I intend to add a volume weighting feature when I get to it.

FRAMA and Candlestick Patterns [CSM]FRAMA (Fractal Adaptive Moving Average) is a technical analysis indicator that adapts its smoothing period according to the market's volatility, allowing it to provide accurate signals in all market conditions. This indicator script plots the FRAMA on a chart and generates buy and sell signals based on the FRAMA and candlestick patterns. It also includes an option to filter signals based on bullish and bearish engulfing patterns.
To detect candlestick patterns, the script imports the "BankNifty_CSM" library from the creator's public library on TradingView. The FRAMA calculation is done using a loop that iterates over the last "length" number of bars, with the smoothing factor adjusted based on the "fracDim" parameter.
The buy and sell signals are generated based on the position of the current price relative to the FRAMA line. If the "engulfing" parameter is set to true, the signals are further filtered based on bullish and bearish engulfing patterns.
Overall, this script combines various technical indicators and candlestick pattern recognition to provide a complete trading strategy. However, as with any trading strategy, it should be thoroughly backtested and evaluated before using it in a live trading environment.

USDT Inflow TrackerUSDT INFLOW TRACKER
What does this script do? It looks for important inflow from USDT and write it below or above your chart.
Does it matter? Yes because Tether with planned USDT inflow highly manipulate the crypto market.
With this simple script you can study what and when something strange is going to happen on your favourite token.
HOW IT WORKS?
Pretty simple. It just continuosly check USDT (and USDC) Market Cap and verify if the last candle is way higher than last one. If it was way higher than expected it plot a green square and write a note with the total Inflow of USDT in the crypto market (not specifcially for your token)
Now you can see when an important inflow is done and start to plan your entry and exit strategy in the crypto market.
AUTOSET
With Autoset you can rely on standard values
5min TF : Inflow greater than of 15 mln (in 1 candle)
30min TF : Inflow greater than of 150 mln (in 1 candle)
60min TF : Inflow greater than of 300 mln (in 1 candle)
1Day TF : Inflow greater than of 900 mln (in 1 candle)
So you can check your favourite coin in no time looking for a good trading position
MANUAL SETTINGS
Otherwise you can set directly your Inflow to track based on your needs.
In the example below I've set to check everytime an Inflow of 25mln USDT or greater was done.
As you can see it highly influence the relative token.

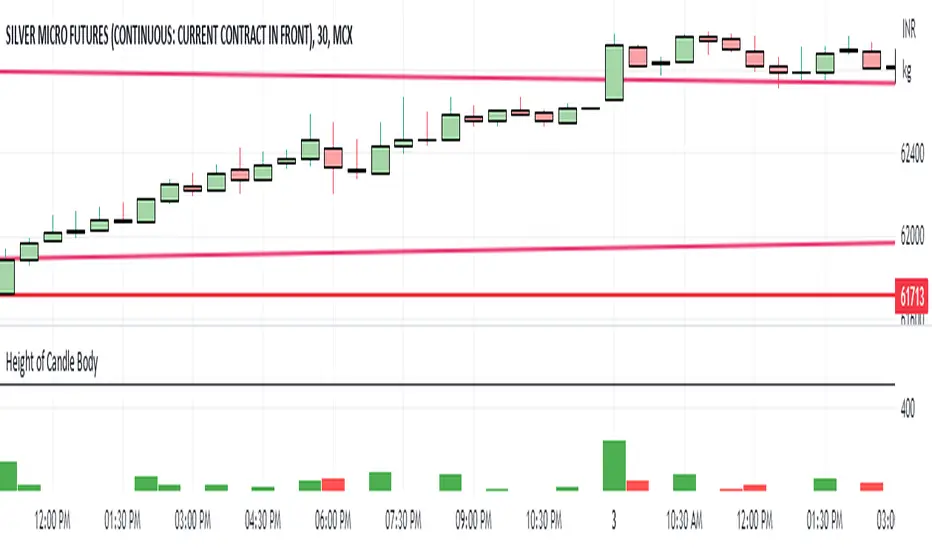
Height of Candle BodyUnderstanding the Height of Candlestick Body
Candlestick charts are a popular method of displaying price data in financial markets. They provide a visual representation of price movements and are used by traders to make informed decisions about buying and selling assets. Understanding the height of a candlestick body is an important aspect of technical analysis and can help traders identify trends and make profitable trades.
The height of a candlestick body is the distance between the opening and closing price of an asset over a given time period. When the closing price is higher than the opening price, the candlestick body is typically colored green or white and is considered bullish. Conversely, when the closing price is lower than the opening price, the candlestick body is typically colored red or black and is considered bearish.
The height of the candlestick body is important because it can provide valuable information about market sentiment. If the candlestick body is relatively small, it suggests that there is indecision in the market and that buyers and sellers are evenly matched. Conversely, if the candlestick body is relatively large, it suggests that there is a significant amount of buying or selling pressure in the market.
Breaking Bar [5ema]I reused some functions, made by (i believe that):
@LeviathanCapital: Market Sessions.
-----
How to use?
More suitable for Scalping
1. Plan A: Break out the highest bar
Find the bar with the largest range (high – low) and high volume of the previous N bars.
When the price close breaks down to highest bar, give a SELL signal.
When the price close breaks up the highest, give a BUY signal.
2. Plan B: Break out the bar opened market
The price close breaks through the open bar, give a Buy and Sell signal.
Market sessions: Tokyo, London, Sydney, New York.
-----
How to set up?
Choose the plan.
Lookback bar to find highest bar.
Right bar: What position of signal will appear from the open market bar (or high bar).
Number break: The maximum bars have price close breaked before giving signal.
Session time: The open and close of market.
-----
This indicator is for reference only, you need your own method and strategy.
If you have any questions, please let me know in the comments.

Liquidity prints / Flowly Indicators- Overview
Liquidity prints detect points in price where buyers or sellers are being effectively absorbed, indicative of price being on a path of resistance. In other words, the prints detect points in price where hard way is likely in current motion and easy way in the opposite. Prints with ideal attributes such as prints into extended trends or into a deviation are marked separately as print confluence. Prints with important or multiple confluence factors give further color into potential strength and duration of print influence. Liquidity prints are detected using an universally applicable method based on price action (OHLC). The prints principally work on any chart, whether that is equities, currencies, cryptocurrencies or commodities, charts with volume data or no volume data. Essentially any asset that can be considered an ordinary speculative asset. The prints also work on any timeframe, from second charts to monthly charts. Liquidity prints are activated real-time after a confirmed bar close, meaning they are not repainted and can be interacted with once a confirmation is in place.
Liquidity prints are based on the premise that price acts a certain way when sufficient liquidity is found, in other words when price shows exhaustion of some sort. A simple example of such price action are wicks, attempted moves that were rejected within the same time period where move was initiated. This type of price action typically takes place when price is close to or at meaningful amount of bids in an order book. There's no guarantee the stacked orders can't be just cleared and moved through, but at face value it does not make sense to expect price moving the hard way. When sufficient amount of characteristics in price action are hinting proximate liquidity, a print is activated. As a barometer for print feedback quality, short term impact on price rate of change and likelihood of print lows/highs being revisited during backtesting period are tracked for each print. Peak increase/decrease during backtesting period is also recorded and added to average calculations. Liquidity prints can also be backtested using any script that has a source input, including mechanic strategies utilizing Tradingview's native backtester.
Key takeaways
Liquidity prints are activated when price is showing signs of grind against path of greater resistance, leaving path of least resistance to the opposite direction.
Liquidity prints with ideal attributes are marked separately as print confluence, giving further color into print strength and duration of influence.
Liquidity prints are backtested using price rate of change, print invalidation mark and peak magnitude metrics.
Liquidity prints can be backtested and utilized in any other Tradingview script, including mechanic strategies utilizing Tradingview's native backtester.
Liquidity prints are detected using price action based methodology. They principally work on any chart or timeframe, including charts with no volume data.
Liquidity prints are activated real-time after a confirmed bar close and are not repainted.
For practical guide with practical examples, see last section.
Accessing script 🔑
See "Author's instructions" section, found at bottom of the script page.
Disclaimer
Liquidity prints are not buy/sell signals, a standalone trading strategy or financial advice. They also do not substitute knowing how to trade. Example charts and ideas shown for use cases are textbook examples under ideal conditions, not guaranteed to repeat as they are presented. Liquidity prints notify when a set of conditions (various reversal patterns, overextended price etc.) are in place from a purely technical standpoint. Liquidity prints should be viewed as one tool providing one kind of evidence, to be used in conjunction with other means of analysis.
Liquidity print quality is backtested using metrics that reasonably depict their expected behaviour, such as historical likelihood of price slowing down or turning shortly after a print. Print quality metrics are not intended to be elaborate and perfect, but to serve as a general barometer for print feedback. Backtesting is done first and foremost to exclude scenarios where prints clearly don't work or work suboptimally, in which case they can't be considered as valid evidence. Even when print metrics indicate historical reactions of good quality, price impact can and inevitably does deviate from the expected. Past results do not guarantee future performance.
- Example charts
Chart #1: BTCUSDT
Chart #2: DXY
Chart #3: NQ futures
Chart #4: Crude oil futures
Chart #5: Custom timeframes
- Print confluence
Attributes that make prints ideal in one way or another are marked separately as print confluence, giving clue into potential strength and duration of print influence. Prints with important or multiple confluence factors can be considered as heavier and more reliable evidence of price being on a path of resistance. Users can choose which confluence to show/hide (by default all) and set a minimum amount of confluence for confluence text to activate (by default 1).
Confluence type #1: Trend extensions
Price trending for abnormally long time doesn't happen too often and requires effort to sustain. Prints taking place at extended trends often have a longer duration influence, indicating a potential larger scale topping/bottoming process being close. Trend extension confluence is indicated using a numbered label, equal to amount of bars price has been in a trending state.
Confluence type #2: Consecutive prints
Prints that take place consecutively imply heavier resistance ahead, as required conditions trigger multiple times within a short period. Consecutive prints tend to lead to more clean, aggressive and heavier magnitude reactions relative to prints with no confluence. Consecutive print confluence is indicated using a numbered label with an x in front, equal to amount of prints that have taken place consecutively.
Confluence type #3: Deviations
When price closes above/below prior print highs/lows and closes right back in with a print, odds are some market participants are stuck in an awkward position. When market participants are stuck, potential for a snowball effect of covering underwater positions is higher, driving price further away. Prints into deviations act similarly to consecutive prints, elevating potential for more aggressive reactions relative to prints with no confluence. Deviation confluence is indicated using a label with a curve symbol.
- Backtesting
Built-in backtesting is based on metrics that are considered to reasonably quantify expected behaviour of prints. Main purpose of the metrics is to form a general barometer for monitoring whether or not prints can be viewed as valid evidence. When prints are clearly not working optimally, one should adjust expectations accordingly or take action to improve print performance. To make any valid conclusions of print performance, sample size should also be significant enough to eliminate randomness effectively. If sample size on any individual chart is insufficient, one should view feedback scores on multiple correlating and comparable charts to make up for the loss.
For more elaborate backtesting, prints can be used in any other script that has a source input, including fully mechanic strategies utilizing Tradingview's native backtester. Print plots are created separately for regular prints and prints with each type of confluence.
Print feedback
Print feedback is monitored for 3 bars following a print. Feedback is considered to be 100% successful when all 3/3 bars show a supportive reaction. When 2/3 bars are supportive, feedback rate is 66%, 1/3 bars = 33% and 0/3 = 0%. After print backtesting period is finished, performance of given print is added to average calculations.
Metric #1 : Rate of change
Rate of change used for backtesting is based on OHLC4 average (open + high + low + close / 4) with a length of 3. Rate of change trending up is considered valid feedback for bullish liquidity prints, trending down for bearish liquidity prints. Note that trending rate of change does not always correlate with trending price, but sometimes simply means current trend in price is slowing down.
Metric #2 : Invalidation mark
Print invalidation marks are set at print low/high with a little bit of "wiggle room". Wiggle room applied is always 1/10th of print bar range. E.g. for a bullish print with bar range of 2%, invalidation mark is set to 0.20% below print low. For most prints this is practically at print low/high, but in the case of prints with high volatility a more noticeable excess is given, due to the expectation of greater adverse reaction without necessarily meaning invalidation. A low being above invalidation mark is considered valid feedback for bullish prints and a high being below invalidation mark for bearish prints.
Metric #3 : Peak increase/decrease
Unlike prior two metrics, peak increase/decrease is not feedback the same way, but rather an assisting factor to be viewed with feedback scores. Peak increase/decrease is measured from print close to highest high/lowest low during backtesting period and added to average calculations
Feedback scores
When liquidity prints are working optimally, quality threshold for both feedback metrics are met. By default, threshold is set to 66%, indicating valid feedback on 2/3 of backtesting periods on average. When threshold is met, a tick will appear next to feedback scores, otherwise an exclamation mark indicating suboptimal performance on either or both.
By default, the prints are filtered as little as possible, idea behind being that it is better to have more poor prints filtered with discretion/mechanically afterwards than potentially filtering too much from the get go. Sometimes filtering is insufficient, leading to failed reactions beyond a tolerable level. When this is the case, print sensitivity can be adjusted via input menu, separately for bullish and bearish prints. Print filter sensitivity ranges from 1 to 5, by default set to 1. Lower sensitivity sets looser criteria for print activation, higher sensitivity sets stricter criteria. For most charts and timeframes default sensitivity works just fine, but when this is not the case, filters can be tweaked in search of better settings. If feedback score threshold is met, it's better to keep filter sensitivity intact and use discretion, which is much more nuanced and capable than any mechanical process. If feedback scores are still insufficient after tweaking, depending on the severity of lack, prints should be vetted extra carefully using other means of analysis or simply avoided.
Verifying backtest calculations
Backtest metrics can be toggled on via input menu, separately for bullish and bearish prints. When toggled on, both cumulative and average counters used in print backtesting will appear on "Data Window" tab. Calculation states are shown at a point in time where cursor is hovered. E.g. when hovering cursor on 4th of January 2021, backtest calculations as they were during this date will be shown. Backtest calculations are updated after backtest period of a print has finished (3 bars). Assisting backtest visuals are also plotted on chart to ease inspection.
- Alerts
Available alerts are the following.
- Bullish/bearish liquidity print
- Bullish/bearish liquidity print with specified print confluence
- Bullish/bearish liquidity print with set minimum print confluence amount exceeded
- Visuals
Visual impact of prints can be managed by adjusting width and length via input menu. Length of prints is available in 3 modes (1-3 from shortest to longest) and width in 10 modes (1-10 from narrowest to widest).
Print confluence text can be embedded inside print nodes, eliminating visuals outside the chart.
Metric table is available in two themes, Classic and Stealth.
Metric table can be offsetted horizontally or vertically from any four corners of the chart, allowing space for tables from other scripts.
Table sizes, label sizes and colors are fully customizable via input menu.
-Practical guide
Key in maximizing success with prints is knowing when they are likely reliable and when not. In general, the more volatile and ranging the market regime, the better liquidity prints will work. Any type of volatile spike in price, parabola or a clean range is where liquidity prints provide optimal feedback. On the other hand low volatility and trending environments are suboptimal and tend to provide more mute/lagged or completely failed feedback. Anomalies such as market wide crashes are also environments where prints can't be expected to work reliably.
Being aware of events on multiple timeframes is crucial for establishing bias for any individual timeframe. Not often it makes sense to go against higher timeframe moves on lower timeframes and this principle of timeframe hierarchy also applies to prints. In other words, higher timeframe prints dictate likelihood of successful prints on lower timeframes. If hard way on a weekly chart is up, same likely applies to daily chart during weekly print influence time. In such scenarios, it's best to not swim in upstream and avoid contradicting lower timeframe prints, at least until clear evidence suggesting otherwise has developed.
Points in price where it anyway makes sense to favor one side over the other are key points of confluence for prints as well. Prints into clean range highs/lows with clean taps can be valuable for optimal entry timing. This is especially true if simultaneously previous pivot gets taken out, increasing odds of liquidity indicated by a print being swept stop-losses.
Prints that don't match underlying bias (e.g. bullish prints at range high, bearish prints at range low) should be avoided until clear evidence has developed favoring them, such as a convincing break through a level followed by a re-test.
Prints that are immediately rejected aggressively are more likely prints that end up failing. Next bar following a print closing below print lows/above print highs is a strong hint of print failure. To consider print still valid in such cases, there should be quick and clear defending of print lows/highs. Failed prints are an inevitable bummer, but never useless. Failed prints are ideal for future reference, as liquidity still likely exists there. Re-tests into these levels often provide sensible entries.
Stacked confluence doesn't come too often and is worth paying special attention to, as multiple benefitting factors are in place simultaneously.
From a more zoomed out perspective, any larger zone with multiple prints taking place inside are potential topping/bottoming processes taking place, also worth paying attention to.

Refracted EMA for trendThis script is an evolution of "Refracted EMA" by fract, that you can find here:
The differences are in the design and intended uses of its early and pretty reliable signals.
This is a trend indicator, with signals and alerts, usable on any timeframe.
Note: 3 color themes are included: Light, dark, and my personal dark one. Feel free to change them in the code, and to remove the ones you don't need.
HOW TO USE IT?
When it gives a signal (arrow), a horizontal line starts, and expands until there's a signal in the opposite direction.
As long as the price moves away from this line, then the move should logically be profitable
If the price ranges, or turns back in direction of the line, then it might be time to reconsider.
The background colors offer a complement of information:
- When the price moves away from the line, the bgcolor is normal.
- When there has been 2 candles in the opposite direction, then the bgcolor turns a little darker. It might be an early sign of range or reversal.
- When the current price breaks through the signal's closing price, the bgcolor turns gray or black (depending on the theme and colors you chose), signaling a significative divergence with the signal, and a possible reversal. It is common though, for the first candle after the signal to go in the opposite direction. It might be a good idea to wait at least 2 candles after the signal.
You can switch the alerts on, by right clicking the chart and clicking "add alert". Alerts happen only after the close of the candle. They display the timeframe they were added on.
TRICKS
- If up and down arrows alternate quickly, then the market is undecided, and it might not be a good idea to trade. Or maybe on other timeframes.
- Trading against the indicator's direction is probably not a good idea, unless there is a very VERY good reason for this (like buying the dip of an up trend, for ex).
- Looking at different timeframes quickly reveals the bigger picture of the price movements. For ex, if the 4h, 1h, 30 min are bullish, but the 5 min bearish, then there might be a long opportunity. But if the 5 min is bearish, and the 10 min turns bearish, and the 30 min turns bearish too, then there might be a reversal on its way.
- The line can be used as a reference to decide where to place your stop loss. It is rare that the price crosses this line, but it can absolutely happen. So use this idea with caution, manage and protect your positions wisely.
- You can, and probably should, use the alerts on different timeframes at the same time, to constantly update your understanding of the trend.
DO NOT BASE YOUR TRADING DECISIONS ON 1 SINGLE INDICATOR'S SIGNALS.
Always confirm your ideas by other means, like price action and indicators of a different nature.

Degen IndicatorThis indicator uses candle patterns I have identified by studying cryptocurrency charts. The main goal is to help you tune out noise and price swings so you are better able to trade with the trend. If you can trade with the trend you will be profitable. Don’t fight the trend.
Signals:
Orange T with Orange Bar - Top
Grey T - Weak Top
Orange P - Pause (Minimal pullback expected before additional upside)
Grey B - Weak Bottom
Green B - Possible Bottom
Blue B with Blue Bar - Likely Bottom
Grey D - Weak Dump
Pink D - Possible Dump
Red D - Likely Dump
Bar Colors:
Grey Green #699969 (Slightly Bullish)
Green #2ca02c (Bullish)
Bright Green #00ff00 (Strong Bullish)
Light Pink #cf6666 (Slightly Bearish)
Red #d62728 (Bearish)
Bright Red #ff0000 (Strong Bearish)
Orange Top #ff9800 (Local price maximum)
Blue Bottom #0066ff (Local price minimum)
Recommended Settings:
Change the Body and the Wick to be Grey. Deselect Border.
Purpose:
Making the default bar colors Grey will help you tune into the trend. Look for clusters of candles where only one non Grey color is present. If there are 3 - 5 or more of the same color also pay attention to the size of the candles. You can see the strength of the moves if they are growing or shrinking in size. Oftentimes a trend will end with an Engulfing Candle after a cluster of candles with the other color. Use this as a sign to exit your position and/or enter a new position.
Advice:
Start on HTF and find the clusters of Tops and Bottoms. Dial into lower timeframes to find the local Tops and Bottoms for entry points. Look for clusters of signals. Be ready for one candle to signify a change in the trend then look for confirmation with additional candles. Do not think about Tops or Bottoms as absolutes. A Top that gets beat with a Bullish Engulfing candle is telling you the Bullish strength is strong. Do not short Grey D’s. Do not long Grey B’s. As always, use these signals in conjunction with your other preferred methods of trading to find confluence and trade with the trend. On LTF this indicator will be very noisy. On HTF it will be more stable.
Logic:
Signals were developed by myself and subjected to extensive backtesting. Each signal uses various combinations of: candle names (Doji, Morning Star, Bearish Engulfing, Bullish Engulfing, etc), volume, price change as a percent, price change as an absolute number, length of the wick the open, close, high, and low candle values. The signals incorporate these values ranging from one candle prior to many candles prior attempting to predict the trend.
Logic not used:
Moving Averages, RSI, OBV, VPVR and Bollinger Bands.

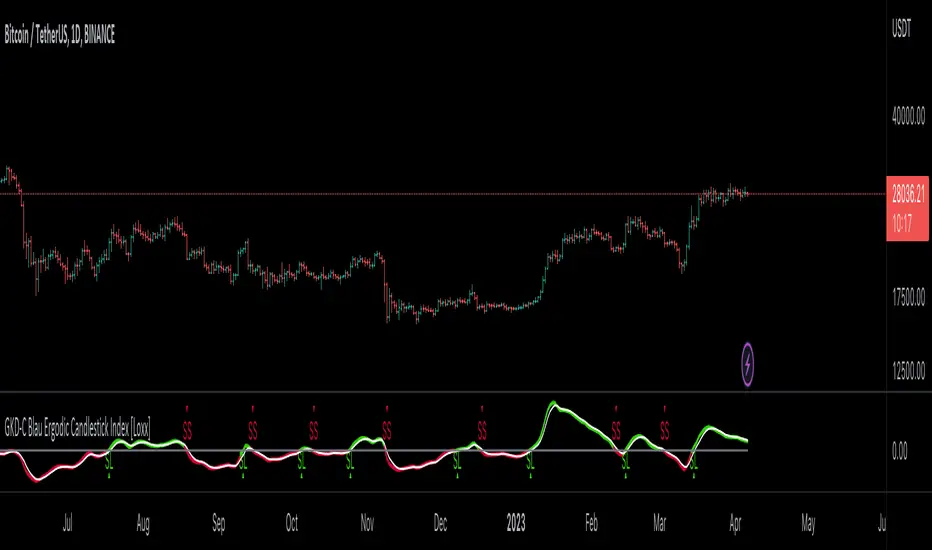
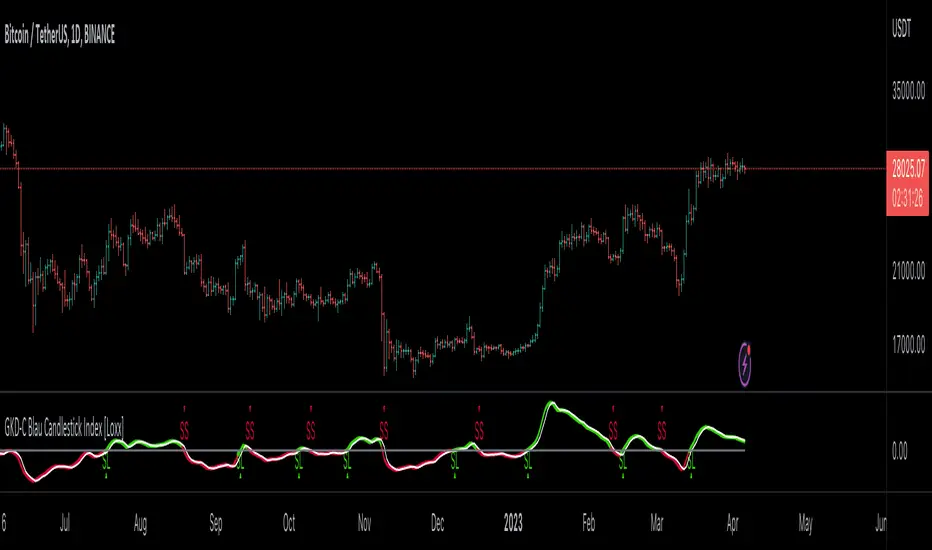
GKD-C Blau Ergodic Candlestick Index [Loxx]Giga Kaleidoscope GKD-C Blau Ergodic Candlestick Index is a Confirmation module included in Loxx's "Giga Kaleidoscope Modularized Trading System".
█ Giga Kaleidoscope Modularized Trading System
What is Loxx's "Giga Kaleidoscope Modularized Trading System"?
The Giga Kaleidoscope Modularized Trading System is a trading system built on the philosophy of the NNFX (No Nonsense Forex) algorithmic trading.
What is the NNFX algorithmic trading strategy?
The NNFX (No-Nonsense Forex) trading system is a comprehensive approach to Forex trading that is designed to simplify the process and remove the confusion and complexity that often surrounds trading. The system was developed by a Forex trader who goes by the pseudonym "VP" and has gained a significant following in the Forex community.
The NNFX trading system is based on a set of rules and guidelines that help traders make objective and informed decisions. These rules cover all aspects of trading, including market analysis, trade entry, stop loss placement, and trade management.
Here are the main components of the NNFX trading system:
1. Trading Philosophy: The NNFX trading system is based on the idea that successful trading requires a comprehensive understanding of the market, objective analysis, and strict risk management. The system aims to remove subjective elements from trading and focuses on objective rules and guidelines.
2. Technical Analysis: The NNFX trading system relies heavily on technical analysis and uses a range of indicators to identify high-probability trading opportunities. The system uses a combination of trend-following and mean-reverting strategies to identify trades.
3. Market Structure: The NNFX trading system emphasizes the importance of understanding the market structure, including price action, support and resistance levels, and market cycles. The system uses a range of tools to identify the market structure, including trend lines, channels, and moving averages.
4. Trade Entry: The NNFX trading system has strict rules for trade entry. The system uses a combination of technical indicators to identify high-probability trades, and traders must meet specific criteria to enter a trade.
5. Stop Loss Placement: The NNFX trading system places a significant emphasis on risk management and requires traders to place a stop loss order on every trade. The system uses a combination of technical analysis and market structure to determine the appropriate stop loss level.
6. Trade Management: The NNFX trading system has specific rules for managing open trades. The system aims to minimize risk and maximize profit by using a combination of trailing stops, take profit levels, and position sizing.
Overall, the NNFX trading system is designed to be a straightforward and easy-to-follow approach to Forex trading that can be applied by traders of all skill levels.
Core components of an NNFX algorithmic trading strategy
The NNFX algorithm is built on the principles of trend, momentum, and volatility. There are six core components in the NNFX trading algorithm:
1. Volatility - price volatility; e.g., Average True Range, True Range Double, Close-to-Close, etc.
2. Baseline - a moving average to identify price trend
3. Confirmation 1 - a technical indicator used to identify trends
4. Confirmation 2 - a technical indicator used to identify trends
5. Continuation - a technical indicator used to identify trends
6. Volatility/Volume - a technical indicator used to identify volatility/volume breakouts/breakdown
7. Exit - a technical indicator used to determine when a trend is exhausted
What is Volatility in the NNFX trading system?
In the NNFX (No Nonsense Forex) trading system, ATR (Average True Range) is typically used to measure the volatility of an asset. It is used as a part of the system to help determine the appropriate stop loss and take profit levels for a trade. ATR is calculated by taking the average of the true range values over a specified period.
True range is calculated as the maximum of the following values:
-Current high minus the current low
-Absolute value of the current high minus the previous close
-Absolute value of the current low minus the previous close
ATR is a dynamic indicator that changes with changes in volatility. As volatility increases, the value of ATR increases, and as volatility decreases, the value of ATR decreases. By using ATR in NNFX system, traders can adjust their stop loss and take profit levels according to the volatility of the asset being traded. This helps to ensure that the trade is given enough room to move, while also minimizing potential losses.
Other types of volatility include True Range Double (TRD), Close-to-Close, and Garman-Klass
What is a Baseline indicator?
The baseline is essentially a moving average, and is used to determine the overall direction of the market.
The baseline in the NNFX system is used to filter out trades that are not in line with the long-term trend of the market. The baseline is plotted on the chart along with other indicators, such as the Moving Average (MA), the Relative Strength Index (RSI), and the Average True Range (ATR).
Trades are only taken when the price is in the same direction as the baseline. For example, if the baseline is sloping upwards, only long trades are taken, and if the baseline is sloping downwards, only short trades are taken. This approach helps to ensure that trades are in line with the overall trend of the market, and reduces the risk of entering trades that are likely to fail.
By using a baseline in the NNFX system, traders can have a clear reference point for determining the overall trend of the market, and can make more informed trading decisions. The baseline helps to filter out noise and false signals, and ensures that trades are taken in the direction of the long-term trend.
What is a Confirmation indicator?
Confirmation indicators are technical indicators that are used to confirm the signals generated by primary indicators. Primary indicators are the core indicators used in the NNFX system, such as the Average True Range (ATR), the Moving Average (MA), and the Relative Strength Index (RSI).
The purpose of the confirmation indicators is to reduce false signals and improve the accuracy of the trading system. They are designed to confirm the signals generated by the primary indicators by providing additional information about the strength and direction of the trend.
Some examples of confirmation indicators that may be used in the NNFX system include the Bollinger Bands, the MACD (Moving Average Convergence Divergence), and the MACD Oscillator. These indicators can provide information about the volatility, momentum, and trend strength of the market, and can be used to confirm the signals generated by the primary indicators.
In the NNFX system, confirmation indicators are used in combination with primary indicators and other filters to create a trading system that is robust and reliable. By using multiple indicators to confirm trading signals, the system aims to reduce the risk of false signals and improve the overall profitability of the trades.
What is a Continuation indicator?
In the NNFX (No Nonsense Forex) trading system, a continuation indicator is a technical indicator that is used to confirm a current trend and predict that the trend is likely to continue in the same direction. A continuation indicator is typically used in conjunction with other indicators in the system, such as a baseline indicator, to provide a comprehensive trading strategy.
What is a Volatility/Volume indicator?
Volume indicators, such as the On Balance Volume (OBV), the Chaikin Money Flow (CMF), or the Volume Price Trend (VPT), are used to measure the amount of buying and selling activity in a market. They are based on the trading volume of the market, and can provide information about the strength of the trend. In the NNFX system, volume indicators are used to confirm trading signals generated by the Moving Average and the Relative Strength Index. Volatility indicators include Average Direction Index, Waddah Attar, and Volatility Ratio. In the NNFX trading system, volatility is a proxy for volume and vice versa.
By using volume indicators as confirmation tools, the NNFX trading system aims to reduce the risk of false signals and improve the overall profitability of trades. These indicators can provide additional information about the market that is not captured by the primary indicators, and can help traders to make more informed trading decisions. In addition, volume indicators can be used to identify potential changes in market trends and to confirm the strength of price movements.
What is an Exit indicator?
The exit indicator is used in conjunction with other indicators in the system, such as the Moving Average (MA), the Relative Strength Index (RSI), and the Average True Range (ATR), to provide a comprehensive trading strategy.
The exit indicator in the NNFX system can be any technical indicator that is deemed effective at identifying optimal exit points. Examples of exit indicators that are commonly used include the Parabolic SAR, the Average Directional Index (ADX), and the Chandelier Exit.
The purpose of the exit indicator is to identify when a trend is likely to reverse or when the market conditions have changed, signaling the need to exit a trade. By using an exit indicator, traders can manage their risk and prevent significant losses.
In the NNFX system, the exit indicator is used in conjunction with a stop loss and a take profit order to maximize profits and minimize losses. The stop loss order is used to limit the amount of loss that can be incurred if the trade goes against the trader, while the take profit order is used to lock in profits when the trade is moving in the trader's favor.
Overall, the use of an exit indicator in the NNFX trading system is an important component of a comprehensive trading strategy. It allows traders to manage their risk effectively and improve the profitability of their trades by exiting at the right time.
How does Loxx's GKD (Giga Kaleidoscope Modularized Trading System) implement the NNFX algorithm outlined above?
Loxx's GKD v1.0 system has five types of modules (indicators/strategies). These modules are:
1. GKD-BT - Backtesting module (Volatility, Number 1 in the NNFX algorithm)
2. GKD-B - Baseline module (Baseline and Volatility/Volume, Numbers 1 and 2 in the NNFX algorithm)
3. GKD-C - Confirmation 1/2 and Continuation module (Confirmation 1/2 and Continuation, Numbers 3, 4, and 5 in the NNFX algorithm)
4. GKD-V - Volatility/Volume module (Confirmation 1/2, Number 6 in the NNFX algorithm)
5. GKD-E - Exit module (Exit, Number 7 in the NNFX algorithm)
(additional module types will added in future releases)
Each module interacts with every module by passing data between modules. Data is passed between each module as described below:
GKD-B => GKD-V => GKD-C(1) => GKD-C(2) => GKD-C(Continuation) => GKD-E => GKD-BT
That is, the Baseline indicator passes its data to Volatility/Volume. The Volatility/Volume indicator passes its values to the Confirmation 1 indicator. The Confirmation 1 indicator passes its values to the Confirmation 2 indicator. The Confirmation 2 indicator passes its values to the Continuation indicator. The Continuation indicator passes its values to the Exit indicator, and finally, the Exit indicator passes its values to the Backtest strategy.
This chaining of indicators requires that each module conform to Loxx's GKD protocol, therefore allowing for the testing of every possible combination of technical indicators that make up the six components of the NNFX algorithm.
What does the application of the GKD trading system look like?
Example trading system:
Backtest: Strategy with 1-3 take profits, trailing stop loss, multiple types of PnL volatility, and 2 backtesting styles
Baseline: Hull Moving Average
Volatility/Volume: Hurst Exponent
Confirmation 1: Blau Ergodic Candlestick Index as shown on the chart above
Confirmation 2: Williams Percent Range
Continuation: Fisher Transform
Exit: Rex Oscillator
Each GKD indicator is denoted with a module identifier of either: GKD-BT, GKD-B, GKD-C, GKD-V, or GKD-E. This allows traders to understand to which module each indicator belongs and where each indicator fits into the GKD protocol chain.
Giga Kaleidoscope Modularized Trading System Signals (based on the NNFX algorithm)
Standard Entry
1. GKD-C Confirmation 1 Signal
2. GKD-B Baseline agrees
3. Price is within a range of 0.2x Volatility and 1.0x Volatility of the Goldie Locks Mean
4. GKD-C Confirmation 2 agrees
5. GKD-V Volatility/Volume agrees
Baseline Entry
1. GKD-B Baseline signal
2. GKD-C Confirmation 1 agrees
3. Price is within a range of 0.2x Volatility and 1.0x Volatility of the Goldie Locks Mean
4. GKD-C Confirmation 2 agrees
5. GKD-V Volatility/Volume agrees
6. GKD-C Confirmation 1 signal was less than 7 candles prior
Continuation Entry
1. Standard Entry, Baseline Entry, or Pullback; entry triggered previously
2. GKD-B Baseline hasn't crossed since entry signal trigger
3. GKD-C Confirmation Continuation Indicator signals
4. GKD-C Confirmation 1 agrees
5. GKD-B Baseline agrees
6. GKD-C Confirmation 2 agrees
1-Candle Rule Standard Entry
1. GKD-C Confirmation 1 signal
2. GKD-B Baseline agrees
3. Price is within a range of 0.2x Volatility and 1.0x Volatility of the Goldie Locks Mean
Next Candle:
1. Price retraced (Long: close < close or Short: close > close )
2. GKD-B Baseline agrees
3. GKD-C Confirmation 1 agrees
4. GKD-C Confirmation 2 agrees
5. GKD-V Volatility/Volume agrees
1-Candle Rule Baseline Entry
1. GKD-B Baseline signal
2. GKD-C Confirmation 1 agrees
3. Price is within a range of 0.2x Volatility and 1.0x Volatility of the Goldie Locks Mean
4. GKD-C Confirmation 1 signal was less than 7 candles prior
Next Candle:
1. Price retraced (Long: close < close or Short: close > close )
2. GKD-B Baseline agrees
3. GKD-C Confirmation 1 agrees
4. GKD-C Confirmation 2 agrees
5. GKD-V Volatility/Volume Agrees
PullBack Entry
1. GKD-B Baseline signal
2. GKD-C Confirmation 1 agrees
3. Price is beyond 1.0x Volatility of Baseline
Next Candle:
1. Price is within a range of 0.2x Volatility and 1.0x Volatility of the Goldie Locks Mean
3. GKD-C Confirmation 1 agrees
4. GKD-C Confirmation 2 agrees
5. GKD-V Volatility/Volume Agrees
█ GKD-C Blau Ergodic Candlestick Index
What is Blau Ergodic Candlestick Index?
The Blau Ergodic CSI-Oscillator is a technical analysis indicator developed by William Blau and described in his book “Momentum, Direction, and Divergence: Applying the Latest Momentum Indicators for Technical Analysis”. It is based on the Candlestick Index (CSI), which measures the difference between the current close price and the open price of a certain number of bars ago. The values of the CSI are normalized by the price range and mapped into the interval.
The Ergodic CSI-Oscillator is calculated using the following formula:
Ergodic_CSI(price1,price2,q,r,s,u) = CSI(price1,price2,q,r,s,u)
SignalLine(price1,price2,q,r,s,u,ul) = EMA(Ergodic_CSI(price1,price2,q,r,s,u),ul)
where:
- Ergodic_CSI(): Ergodic - Candlestick Index CSI(price1,price2,q,r,s,u)
- SignalLine(): Signal Line - exponentially smoothed moving average EMA(ul), applied to Ergodic
- ul: period of a signal line ¹.
The input parameters for this indicator are:
- q: number of bars used in calculation of Candlestick Momentum (default value is 1)
- r: period of the first EMA applied to Candlestick Momentum (default value is 20)
- s: period of the second EMA applied to result of the first smoothing (default value is 5)
- u: period of the third EMA applied to result of the second smoothing (default value is 3)
- ul: period of the Signal Line - EMA(ul), applied to Ergodic (default value is 3)
- AppliedPrice1: price type (default value is PRICE_CLOSE)
- AppliedPrice2: price type (default value is PRICE_OPEN) ¹.
I hope this information helps you understand what Blau Ergodic CSI-Oscillator is and how it works.
(2) William Blau's Indicators and Trading Systems in MQL5. Part 1 .... www.mql5.com Accessed 4/6/2023.
(3) Ergodic CSI-Oscillator Blau_Ergodic_CSI – indicator for MetaTrader 5. www.forexmt4indicators.com Accessed 4/6/2023.
(4) Free download of the 'Ergodic CSI-Oscillator Blau_Ergodic_CSI .... www.mql5.com Accessed 4/6/2023.
Requirements
Inputs
Confirmation 1 and Solo Confirmation: GKD-V Volatility / Volume indicator
Confirmation 2: GKD-C Confirmation indicator
Outputs
Confirmation 2 and Solo Confirmation Complex: GKD-E Exit indicator
Confirmation 1: GKD-C Confirmation indicator
Continuation: GKD-E Exit indicator
Solo Confirmation Simple: GKD-BT Backtest strategy
Additional features will be added in future releases.
GKD-C Blau Candlestick Index [Loxx]Giga Kaleidoscope GKD-C Blau Candlestick Index is a Confirmation module included in Loxx's "Giga Kaleidoscope Modularized Trading System".
█ Giga Kaleidoscope Modularized Trading System
What is Loxx's "Giga Kaleidoscope Modularized Trading System"?
The Giga Kaleidoscope Modularized Trading System is a trading system built on the philosophy of the NNFX (No Nonsense Forex) algorithmic trading.
What is the NNFX algorithmic trading strategy?
The NNFX (No-Nonsense Forex) trading system is a comprehensive approach to Forex trading that is designed to simplify the process and remove the confusion and complexity that often surrounds trading. The system was developed by a Forex trader who goes by the pseudonym "VP" and has gained a significant following in the Forex community.
The NNFX trading system is based on a set of rules and guidelines that help traders make objective and informed decisions. These rules cover all aspects of trading, including market analysis, trade entry, stop loss placement, and trade management.
Here are the main components of the NNFX trading system:
1. Trading Philosophy: The NNFX trading system is based on the idea that successful trading requires a comprehensive understanding of the market, objective analysis, and strict risk management. The system aims to remove subjective elements from trading and focuses on objective rules and guidelines.
2. Technical Analysis: The NNFX trading system relies heavily on technical analysis and uses a range of indicators to identify high-probability trading opportunities. The system uses a combination of trend-following and mean-reverting strategies to identify trades.
3. Market Structure: The NNFX trading system emphasizes the importance of understanding the market structure, including price action, support and resistance levels, and market cycles. The system uses a range of tools to identify the market structure, including trend lines, channels, and moving averages.
4. Trade Entry: The NNFX trading system has strict rules for trade entry. The system uses a combination of technical indicators to identify high-probability trades, and traders must meet specific criteria to enter a trade.
5. Stop Loss Placement: The NNFX trading system places a significant emphasis on risk management and requires traders to place a stop loss order on every trade. The system uses a combination of technical analysis and market structure to determine the appropriate stop loss level.
6. Trade Management: The NNFX trading system has specific rules for managing open trades. The system aims to minimize risk and maximize profit by using a combination of trailing stops, take profit levels, and position sizing.
Overall, the NNFX trading system is designed to be a straightforward and easy-to-follow approach to Forex trading that can be applied by traders of all skill levels.
Core components of an NNFX algorithmic trading strategy
The NNFX algorithm is built on the principles of trend, momentum, and volatility. There are six core components in the NNFX trading algorithm:
1. Volatility - price volatility; e.g., Average True Range, True Range Double, Close-to-Close, etc.
2. Baseline - a moving average to identify price trend
3. Confirmation 1 - a technical indicator used to identify trends
4. Confirmation 2 - a technical indicator used to identify trends
5. Continuation - a technical indicator used to identify trends
6. Volatility/Volume - a technical indicator used to identify volatility/volume breakouts/breakdown
7. Exit - a technical indicator used to determine when a trend is exhausted
What is Volatility in the NNFX trading system?
In the NNFX (No Nonsense Forex) trading system, ATR (Average True Range) is typically used to measure the volatility of an asset. It is used as a part of the system to help determine the appropriate stop loss and take profit levels for a trade. ATR is calculated by taking the average of the true range values over a specified period.
True range is calculated as the maximum of the following values:
-Current high minus the current low
-Absolute value of the current high minus the previous close
-Absolute value of the current low minus the previous close
ATR is a dynamic indicator that changes with changes in volatility. As volatility increases, the value of ATR increases, and as volatility decreases, the value of ATR decreases. By using ATR in NNFX system, traders can adjust their stop loss and take profit levels according to the volatility of the asset being traded. This helps to ensure that the trade is given enough room to move, while also minimizing potential losses.
Other types of volatility include True Range Double (TRD), Close-to-Close, and Garman-Klass
What is a Baseline indicator?
The baseline is essentially a moving average, and is used to determine the overall direction of the market.
The baseline in the NNFX system is used to filter out trades that are not in line with the long-term trend of the market. The baseline is plotted on the chart along with other indicators, such as the Moving Average (MA), the Relative Strength Index (RSI), and the Average True Range (ATR).
Trades are only taken when the price is in the same direction as the baseline. For example, if the baseline is sloping upwards, only long trades are taken, and if the baseline is sloping downwards, only short trades are taken. This approach helps to ensure that trades are in line with the overall trend of the market, and reduces the risk of entering trades that are likely to fail.
By using a baseline in the NNFX system, traders can have a clear reference point for determining the overall trend of the market, and can make more informed trading decisions. The baseline helps to filter out noise and false signals, and ensures that trades are taken in the direction of the long-term trend.
What is a Confirmation indicator?
Confirmation indicators are technical indicators that are used to confirm the signals generated by primary indicators. Primary indicators are the core indicators used in the NNFX system, such as the Average True Range (ATR), the Moving Average (MA), and the Relative Strength Index (RSI).
The purpose of the confirmation indicators is to reduce false signals and improve the accuracy of the trading system. They are designed to confirm the signals generated by the primary indicators by providing additional information about the strength and direction of the trend.
Some examples of confirmation indicators that may be used in the NNFX system include the Bollinger Bands, the MACD (Moving Average Convergence Divergence), and the MACD Oscillator. These indicators can provide information about the volatility, momentum, and trend strength of the market, and can be used to confirm the signals generated by the primary indicators.
In the NNFX system, confirmation indicators are used in combination with primary indicators and other filters to create a trading system that is robust and reliable. By using multiple indicators to confirm trading signals, the system aims to reduce the risk of false signals and improve the overall profitability of the trades.
What is a Continuation indicator?
In the NNFX (No Nonsense Forex) trading system, a continuation indicator is a technical indicator that is used to confirm a current trend and predict that the trend is likely to continue in the same direction. A continuation indicator is typically used in conjunction with other indicators in the system, such as a baseline indicator, to provide a comprehensive trading strategy.
What is a Volatility/Volume indicator?
Volume indicators, such as the On Balance Volume (OBV), the Chaikin Money Flow (CMF), or the Volume Price Trend (VPT), are used to measure the amount of buying and selling activity in a market. They are based on the trading volume of the market, and can provide information about the strength of the trend. In the NNFX system, volume indicators are used to confirm trading signals generated by the Moving Average and the Relative Strength Index. Volatility indicators include Average Direction Index, Waddah Attar, and Volatility Ratio. In the NNFX trading system, volatility is a proxy for volume and vice versa.
By using volume indicators as confirmation tools, the NNFX trading system aims to reduce the risk of false signals and improve the overall profitability of trades. These indicators can provide additional information about the market that is not captured by the primary indicators, and can help traders to make more informed trading decisions. In addition, volume indicators can be used to identify potential changes in market trends and to confirm the strength of price movements.
What is an Exit indicator?
The exit indicator is used in conjunction with other indicators in the system, such as the Moving Average (MA), the Relative Strength Index (RSI), and the Average True Range (ATR), to provide a comprehensive trading strategy.
The exit indicator in the NNFX system can be any technical indicator that is deemed effective at identifying optimal exit points. Examples of exit indicators that are commonly used include the Parabolic SAR, the Average Directional Index (ADX), and the Chandelier Exit.
The purpose of the exit indicator is to identify when a trend is likely to reverse or when the market conditions have changed, signaling the need to exit a trade. By using an exit indicator, traders can manage their risk and prevent significant losses.
In the NNFX system, the exit indicator is used in conjunction with a stop loss and a take profit order to maximize profits and minimize losses. The stop loss order is used to limit the amount of loss that can be incurred if the trade goes against the trader, while the take profit order is used to lock in profits when the trade is moving in the trader's favor.
Overall, the use of an exit indicator in the NNFX trading system is an important component of a comprehensive trading strategy. It allows traders to manage their risk effectively and improve the profitability of their trades by exiting at the right time.
How does Loxx's GKD (Giga Kaleidoscope Modularized Trading System) implement the NNFX algorithm outlined above?
Loxx's GKD v1.0 system has five types of modules (indicators/strategies). These modules are:
1. GKD-BT - Backtesting module (Volatility, Number 1 in the NNFX algorithm)
2. GKD-B - Baseline module (Baseline and Volatility/Volume, Numbers 1 and 2 in the NNFX algorithm)
3. GKD-C - Confirmation 1/2 and Continuation module (Confirmation 1/2 and Continuation, Numbers 3, 4, and 5 in the NNFX algorithm)
4. GKD-V - Volatility/Volume module (Confirmation 1/2, Number 6 in the NNFX algorithm)
5. GKD-E - Exit module (Exit, Number 7 in the NNFX algorithm)
(additional module types will added in future releases)
Each module interacts with every module by passing data between modules. Data is passed between each module as described below:
GKD-B => GKD-V => GKD-C(1) => GKD-C(2) => GKD-C(Continuation) => GKD-E => GKD-BT
That is, the Baseline indicator passes its data to Volatility/Volume. The Volatility/Volume indicator passes its values to the Confirmation 1 indicator. The Confirmation 1 indicator passes its values to the Confirmation 2 indicator. The Confirmation 2 indicator passes its values to the Continuation indicator. The Continuation indicator passes its values to the Exit indicator, and finally, the Exit indicator passes its values to the Backtest strategy.
This chaining of indicators requires that each module conform to Loxx's GKD protocol, therefore allowing for the testing of every possible combination of technical indicators that make up the six components of the NNFX algorithm.
What does the application of the GKD trading system look like?
Example trading system:
Backtest: Strategy with 1-3 take profits, trailing stop loss, multiple types of PnL volatility, and 2 backtesting styles
Baseline: Hull Moving Average
Volatility/Volume: Hurst Exponent
Confirmation 1: Blau Candlestick Index as shown on the chart above
Confirmation 2: Williams Percent Range
Continuation: Fisher Transform
Exit: Rex Oscillator
Each GKD indicator is denoted with a module identifier of either: GKD-BT, GKD-B, GKD-C, GKD-V, or GKD-E. This allows traders to understand to which module each indicator belongs and where each indicator fits into the GKD protocol chain.
Giga Kaleidoscope Modularized Trading System Signals (based on the NNFX algorithm)
Standard Entry
1. GKD-C Confirmation 1 Signal
2. GKD-B Baseline agrees
3. Price is within a range of 0.2x Volatility and 1.0x Volatility of the Goldie Locks Mean
4. GKD-C Confirmation 2 agrees
5. GKD-V Volatility/Volume agrees
Baseline Entry
1. GKD-B Baseline signal
2. GKD-C Confirmation 1 agrees
3. Price is within a range of 0.2x Volatility and 1.0x Volatility of the Goldie Locks Mean
4. GKD-C Confirmation 2 agrees
5. GKD-V Volatility/Volume agrees
6. GKD-C Confirmation 1 signal was less than 7 candles prior
Continuation Entry
1. Standard Entry, Baseline Entry, or Pullback; entry triggered previously
2. GKD-B Baseline hasn't crossed since entry signal trigger
3. GKD-C Confirmation Continuation Indicator signals
4. GKD-C Confirmation 1 agrees
5. GKD-B Baseline agrees
6. GKD-C Confirmation 2 agrees
1-Candle Rule Standard Entry
1. GKD-C Confirmation 1 signal
2. GKD-B Baseline agrees
3. Price is within a range of 0.2x Volatility and 1.0x Volatility of the Goldie Locks Mean
Next Candle:
1. Price retraced (Long: close < close or Short: close > close )
2. GKD-B Baseline agrees
3. GKD-C Confirmation 1 agrees
4. GKD-C Confirmation 2 agrees
5. GKD-V Volatility/Volume agrees
1-Candle Rule Baseline Entry
1. GKD-B Baseline signal
2. GKD-C Confirmation 1 agrees
3. Price is within a range of 0.2x Volatility and 1.0x Volatility of the Goldie Locks Mean
4. GKD-C Confirmation 1 signal was less than 7 candles prior
Next Candle:
1. Price retraced (Long: close < close or Short: close > close )
2. GKD-B Baseline agrees
3. GKD-C Confirmation 1 agrees
4. GKD-C Confirmation 2 agrees
5. GKD-V Volatility/Volume Agrees
PullBack Entry
1. GKD-B Baseline signal
2. GKD-C Confirmation 1 agrees
3. Price is beyond 1.0x Volatility of Baseline
Next Candle:
1. Price is within a range of 0.2x Volatility and 1.0x Volatility of the Goldie Locks Mean
3. GKD-C Confirmation 1 agrees
4. GKD-C Confirmation 2 agrees
5. GKD-V Volatility/Volume Agrees
█ GKD-C Blau Candlestick Index
What is Blau Candlestick Index?
The Blau Candlestick Index (CSI) is a technical analysis indicator developed by William Blau and described in his book “Momentum, Direction, and Divergence: Applying the Latest Momentum Indicators for Technical Analysis”. It is based on the Candlestick Momentum Indicator, which measures the difference between the current close price and the open price of a certain number of bars ago. The values of the CSI are normalized by the price range and mapped into the interval ³.
The CSI is calculated using the following formula:
CSI(price1,price2,q,r,s,u) = 100 * CMtm(price1,price2,q,r,s,u) / EMA(EMA(EMA(HH(q)-LL(q),r),s),u)
where:
- price1: close price
- price2: open price q bars ago
- q: number of bars used in calculation of Candlestick Momentum
- cmtm(price1,price2,q): Candlestick Momentum
- CMtm(price1,price2,q,r,s,u): Triple smoothed Candlestick Momentum
- LL(q): lowest price of the q bars
- HH(q): highest price of the q bars
- EMA(...,r): first smoothing - exponentially smoothed moving average with period r, applied to Candlestick Momentum and q-period Price Range
- EMA(EMA(...,r),s): second smoothing - EMA of period s, applied to result of the first smoothing
- EMA(EMA(EMA(...,r),s),u): third smoothing - EMA of period u, applied to result of the second smoothing ³.
The input parameters for this indicator are:
- q: number of bars used in calculation of Candlestick Momentum (default value is 1)
- r: period of the first EMA applied to Candlestick Momentum (default value is 20)
- s: period of the second EMA applied to result of the first smoothing (default value is 5)
- u: period of the third EMA applied to result of the second smoothing (default value is 3)
- AppliedPrice1: price type (default value is PRICE_CLOSE)
- AppliedPrice2: price type (default value is PRICE_OPEN) ³.
(1) Candlestick Index Blau_CSI - indicator for MetaTrader 5 - MQL5. www.mql5.com Accessed 4/6/2023.
(2) The Blau Candlestick Index trading indicator for MT5. www.fxtradingrevolution.com Accessed 4/6/2023.
(3) True Strength Index (TSI) - StockCharts.com. school.stockcharts.com Accessed 4/6/2023.
Requirements
Inputs
Confirmation 1 and Solo Confirmation: GKD-V Volatility / Volume indicator
Confirmation 2: GKD-C Confirmation indicator
Outputs
Confirmation 2 and Solo Confirmation Complex: GKD-E Exit indicator
Confirmation 1: GKD-C Confirmation indicator
Continuation: GKD-E Exit indicator
Solo Confirmation Simple: GKD-BT Backtest strategy
Additional features will be added in future releases.
GKD-C Blau Candlestick Momentum Indicator [Loxx]Giga Kaleidoscope GKD-C Blau Candlestick Momentum Indicator is a Confirmation module included in Loxx's "Giga Kaleidoscope Modularized Trading System".
█ Giga Kaleidoscope Modularized Trading System
What is Loxx's "Giga Kaleidoscope Modularized Trading System"?
The Giga Kaleidoscope Modularized Trading System is a trading system built on the philosophy of the NNFX (No Nonsense Forex) algorithmic trading.
What is the NNFX algorithmic trading strategy?
The NNFX (No-Nonsense Forex) trading system is a comprehensive approach to Forex trading that is designed to simplify the process and remove the confusion and complexity that often surrounds trading. The system was developed by a Forex trader who goes by the pseudonym "VP" and has gained a significant following in the Forex community.
The NNFX trading system is based on a set of rules and guidelines that help traders make objective and informed decisions. These rules cover all aspects of trading, including market analysis, trade entry, stop loss placement, and trade management.
Here are the main components of the NNFX trading system:
1. Trading Philosophy: The NNFX trading system is based on the idea that successful trading requires a comprehensive understanding of the market, objective analysis, and strict risk management. The system aims to remove subjective elements from trading and focuses on objective rules and guidelines.
2. Technical Analysis: The NNFX trading system relies heavily on technical analysis and uses a range of indicators to identify high-probability trading opportunities. The system uses a combination of trend-following and mean-reverting strategies to identify trades.
3. Market Structure: The NNFX trading system emphasizes the importance of understanding the market structure, including price action, support and resistance levels, and market cycles. The system uses a range of tools to identify the market structure, including trend lines, channels, and moving averages.
4. Trade Entry: The NNFX trading system has strict rules for trade entry. The system uses a combination of technical indicators to identify high-probability trades, and traders must meet specific criteria to enter a trade.
5. Stop Loss Placement: The NNFX trading system places a significant emphasis on risk management and requires traders to place a stop loss order on every trade. The system uses a combination of technical analysis and market structure to determine the appropriate stop loss level.
6. Trade Management: The NNFX trading system has specific rules for managing open trades. The system aims to minimize risk and maximize profit by using a combination of trailing stops, take profit levels, and position sizing.
Overall, the NNFX trading system is designed to be a straightforward and easy-to-follow approach to Forex trading that can be applied by traders of all skill levels.
Core components of an NNFX algorithmic trading strategy
The NNFX algorithm is built on the principles of trend, momentum, and volatility. There are six core components in the NNFX trading algorithm:
1. Volatility - price volatility; e.g., Average True Range, True Range Double, Close-to-Close, etc.
2. Baseline - a moving average to identify price trend
3. Confirmation 1 - a technical indicator used to identify trends
4. Confirmation 2 - a technical indicator used to identify trends
5. Continuation - a technical indicator used to identify trends
6. Volatility/Volume - a technical indicator used to identify volatility/volume breakouts/breakdown
7. Exit - a technical indicator used to determine when a trend is exhausted
What is Volatility in the NNFX trading system?
In the NNFX (No Nonsense Forex) trading system, ATR (Average True Range) is typically used to measure the volatility of an asset. It is used as a part of the system to help determine the appropriate stop loss and take profit levels for a trade. ATR is calculated by taking the average of the true range values over a specified period.
True range is calculated as the maximum of the following values:
-Current high minus the current low
-Absolute value of the current high minus the previous close
-Absolute value of the current low minus the previous close
ATR is a dynamic indicator that changes with changes in volatility. As volatility increases, the value of ATR increases, and as volatility decreases, the value of ATR decreases. By using ATR in NNFX system, traders can adjust their stop loss and take profit levels according to the volatility of the asset being traded. This helps to ensure that the trade is given enough room to move, while also minimizing potential losses.
Other types of volatility include True Range Double (TRD), Close-to-Close, and Garman-Klass
What is a Baseline indicator?
The baseline is essentially a moving average, and is used to determine the overall direction of the market.
The baseline in the NNFX system is used to filter out trades that are not in line with the long-term trend of the market. The baseline is plotted on the chart along with other indicators, such as the Moving Average (MA), the Relative Strength Index (RSI), and the Average True Range (ATR).
Trades are only taken when the price is in the same direction as the baseline. For example, if the baseline is sloping upwards, only long trades are taken, and if the baseline is sloping downwards, only short trades are taken. This approach helps to ensure that trades are in line with the overall trend of the market, and reduces the risk of entering trades that are likely to fail.
By using a baseline in the NNFX system, traders can have a clear reference point for determining the overall trend of the market, and can make more informed trading decisions. The baseline helps to filter out noise and false signals, and ensures that trades are taken in the direction of the long-term trend.
What is a Confirmation indicator?
Confirmation indicators are technical indicators that are used to confirm the signals generated by primary indicators. Primary indicators are the core indicators used in the NNFX system, such as the Average True Range (ATR), the Moving Average (MA), and the Relative Strength Index (RSI).
The purpose of the confirmation indicators is to reduce false signals and improve the accuracy of the trading system. They are designed to confirm the signals generated by the primary indicators by providing additional information about the strength and direction of the trend.
Some examples of confirmation indicators that may be used in the NNFX system include the Bollinger Bands, the MACD (Moving Average Convergence Divergence), and the MACD Oscillator. These indicators can provide information about the volatility, momentum, and trend strength of the market, and can be used to confirm the signals generated by the primary indicators.
In the NNFX system, confirmation indicators are used in combination with primary indicators and other filters to create a trading system that is robust and reliable. By using multiple indicators to confirm trading signals, the system aims to reduce the risk of false signals and improve the overall profitability of the trades.
What is a Continuation indicator?
In the NNFX (No Nonsense Forex) trading system, a continuation indicator is a technical indicator that is used to confirm a current trend and predict that the trend is likely to continue in the same direction. A continuation indicator is typically used in conjunction with other indicators in the system, such as a baseline indicator, to provide a comprehensive trading strategy.
What is a Volatility/Volume indicator?
Volume indicators, such as the On Balance Volume (OBV), the Chaikin Money Flow (CMF), or the Volume Price Trend (VPT), are used to measure the amount of buying and selling activity in a market. They are based on the trading volume of the market, and can provide information about the strength of the trend. In the NNFX system, volume indicators are used to confirm trading signals generated by the Moving Average and the Relative Strength Index. Volatility indicators include Average Direction Index, Waddah Attar, and Volatility Ratio. In the NNFX trading system, volatility is a proxy for volume and vice versa.
By using volume indicators as confirmation tools, the NNFX trading system aims to reduce the risk of false signals and improve the overall profitability of trades. These indicators can provide additional information about the market that is not captured by the primary indicators, and can help traders to make more informed trading decisions. In addition, volume indicators can be used to identify potential changes in market trends and to confirm the strength of price movements.
What is an Exit indicator?
The exit indicator is used in conjunction with other indicators in the system, such as the Moving Average (MA), the Relative Strength Index (RSI), and the Average True Range (ATR), to provide a comprehensive trading strategy.
The exit indicator in the NNFX system can be any technical indicator that is deemed effective at identifying optimal exit points. Examples of exit indicators that are commonly used include the Parabolic SAR, the Average Directional Index (ADX), and the Chandelier Exit.
The purpose of the exit indicator is to identify when a trend is likely to reverse or when the market conditions have changed, signaling the need to exit a trade. By using an exit indicator, traders can manage their risk and prevent significant losses.
In the NNFX system, the exit indicator is used in conjunction with a stop loss and a take profit order to maximize profits and minimize losses. The stop loss order is used to limit the amount of loss that can be incurred if the trade goes against the trader, while the take profit order is used to lock in profits when the trade is moving in the trader's favor.
Overall, the use of an exit indicator in the NNFX trading system is an important component of a comprehensive trading strategy. It allows traders to manage their risk effectively and improve the profitability of their trades by exiting at the right time.
How does Loxx's GKD (Giga Kaleidoscope Modularized Trading System) implement the NNFX algorithm outlined above?
Loxx's GKD v1.0 system has five types of modules (indicators/strategies). These modules are:
1. GKD-BT - Backtesting module (Volatility, Number 1 in the NNFX algorithm)
2. GKD-B - Baseline module (Baseline and Volatility/Volume, Numbers 1 and 2 in the NNFX algorithm)
3. GKD-C - Confirmation 1/2 and Continuation module (Confirmation 1/2 and Continuation, Numbers 3, 4, and 5 in the NNFX algorithm)
4. GKD-V - Volatility/Volume module (Confirmation 1/2, Number 6 in the NNFX algorithm)
5. GKD-E - Exit module (Exit, Number 7 in the NNFX algorithm)
(additional module types will added in future releases)
Each module interacts with every module by passing data between modules. Data is passed between each module as described below:
GKD-B => GKD-V => GKD-C(1) => GKD-C(2) => GKD-C(Continuation) => GKD-E => GKD-BT
That is, the Baseline indicator passes its data to Volatility/Volume. The Volatility/Volume indicator passes its values to the Confirmation 1 indicator. The Confirmation 1 indicator passes its values to the Confirmation 2 indicator. The Confirmation 2 indicator passes its values to the Continuation indicator. The Continuation indicator passes its values to the Exit indicator, and finally, the Exit indicator passes its values to the Backtest strategy.
This chaining of indicators requires that each module conform to Loxx's GKD protocol, therefore allowing for the testing of every possible combination of technical indicators that make up the six components of the NNFX algorithm.
What does the application of the GKD trading system look like?
Example trading system:
Backtest: Strategy with 1-3 take profits, trailing stop loss, multiple types of PnL volatility, and 2 backtesting styles
Baseline: Hull Moving Average
Volatility/Volume: Hurst Exponent
Confirmation 1: Blau Candlestick Momentum Indicator as shown on the chart above
Confirmation 2: Williams Percent Range
Continuation: Fisher Transform
Exit: Rex Oscillator
Each GKD indicator is denoted with a module identifier of either: GKD-BT, GKD-B, GKD-C, GKD-V, or GKD-E. This allows traders to understand to which module each indicator belongs and where each indicator fits into the GKD protocol chain.
Giga Kaleidoscope Modularized Trading System Signals (based on the NNFX algorithm)
Standard Entry
1. GKD-C Confirmation 1 Signal
2. GKD-B Baseline agrees
3. Price is within a range of 0.2x Volatility and 1.0x Volatility of the Goldie Locks Mean
4. GKD-C Confirmation 2 agrees
5. GKD-V Volatility/Volume agrees
Baseline Entry
1. GKD-B Baseline signal
2. GKD-C Confirmation 1 agrees
3. Price is within a range of 0.2x Volatility and 1.0x Volatility of the Goldie Locks Mean
4. GKD-C Confirmation 2 agrees
5. GKD-V Volatility/Volume agrees
6. GKD-C Confirmation 1 signal was less than 7 candles prior
Continuation Entry
1. Standard Entry, Baseline Entry, or Pullback; entry triggered previously
2. GKD-B Baseline hasn't crossed since entry signal trigger
3. GKD-C Confirmation Continuation Indicator signals
4. GKD-C Confirmation 1 agrees
5. GKD-B Baseline agrees
6. GKD-C Confirmation 2 agrees
1-Candle Rule Standard Entry
1. GKD-C Confirmation 1 signal
2. GKD-B Baseline agrees
3. Price is within a range of 0.2x Volatility and 1.0x Volatility of the Goldie Locks Mean
Next Candle:
1. Price retraced (Long: close < close or Short: close > close )
2. GKD-B Baseline agrees
3. GKD-C Confirmation 1 agrees
4. GKD-C Confirmation 2 agrees
5. GKD-V Volatility/Volume agrees
1-Candle Rule Baseline Entry
1. GKD-B Baseline signal
2. GKD-C Confirmation 1 agrees
3. Price is within a range of 0.2x Volatility and 1.0x Volatility of the Goldie Locks Mean
4. GKD-C Confirmation 1 signal was less than 7 candles prior
Next Candle:
1. Price retraced (Long: close < close or Short: close > close )
2. GKD-B Baseline agrees
3. GKD-C Confirmation 1 agrees
4. GKD-C Confirmation 2 agrees
5. GKD-V Volatility/Volume Agrees
PullBack Entry
1. GKD-B Baseline signal
2. GKD-C Confirmation 1 agrees
3. Price is beyond 1.0x Volatility of Baseline
Next Candle:
1. Price is within a range of 0.2x Volatility and 1.0x Volatility of the Goldie Locks Mean
3. GKD-C Confirmation 1 agrees
4. GKD-C Confirmation 2 agrees
5. GKD-V Volatility/Volume Agrees
█ GKD-C Blau Candlestick Momentum Indicator
What is Blau Candlestick Momentum Indicator?
The Candlestick Momentum Indicator is a technical analysis indicator developed by William Blau and described in his book “Momentum, Direction, and Divergence: Applying the Latest Momentum Indicators for Technical Analysis”. It measures the difference between the current close price and the open price of a certain number of bars ago. The values of the Candlestick Momentum Indicator are normalized by absolute values and mapped into the interval .
The Candlestick Momentum Indicator is calculated using the following formula:
CMtm(price1,price2,q,r,s,u) = 100 * EMA(EMA(EMA(cmtm(price1,price2,q),r),s),u)
where:
- price1: close price
- price2: open price q bars ago
- q: number of bars used in calculation of Candlestick Momentum
- cmtm(price1,price2,q): Candlestick Momentum
- CMtm(price1,price2,q,r,s,u): Triple smoothed Candlestick Momentum
- EMA(...,r): first smoothing - exponentially smoothed moving average with period r, applied to Candlestick Momentum
- EMA(EMA(...,r),s): second smoothing - EMA of period s, applied to result of the first smoothing
- EMA(EMA(EMA(...,r),s),u): third smoothing - EMA of period u, applied to result of the second smoothing .
The input parameters for this indicator are:
- q: number of bars used in calculation of Candlestick Momentum (default value is 1)
- r: period of the first EMA applied to Candlestick Momentum (default value is 20)
- s: period of the second EMA applied to result of the first smoothing (default value is 5)
- u: period of the third EMA applied to result of the second smoothing (default value is 3)
- AppliedPrice1: price type (default value is PRICE_CLOSE)
- AppliedPrice2: price type (default value is PRICE_OPEN) .
Requirements
Inputs
Confirmation 1 and Solo Confirmation: GKD-V Volatility / Volume indicator
Confirmation 2: GKD-C Confirmation indicator
Outputs
Confirmation 2 and Solo Confirmation Complex: GKD-E Exit indicator
Confirmation 1: GKD-C Confirmation indicator
Continuation: GKD-E Exit indicator
Solo Confirmation Simple: GKD-BT Backtest strategy
Additional features will be added in future releases.
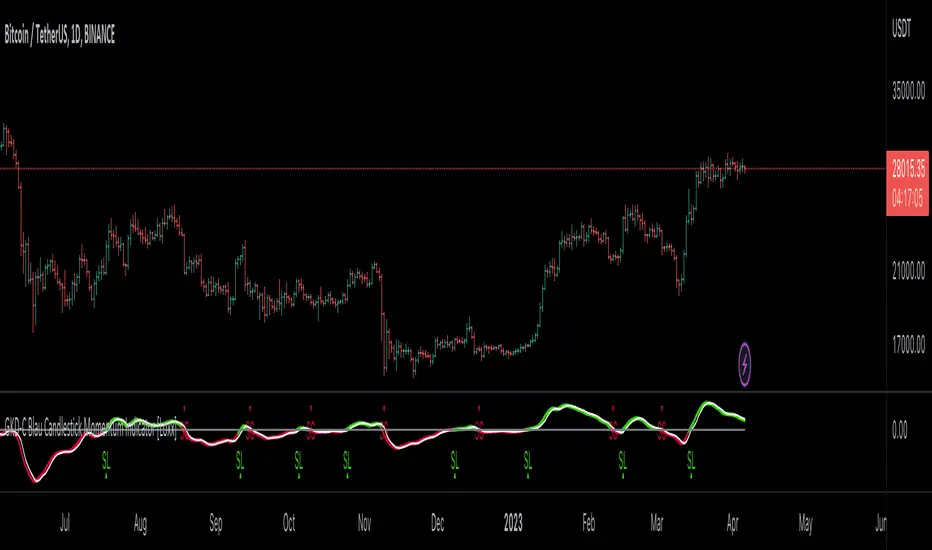
Price Action Oscillator with RSI--------- ENGLISH ---------
This oscillator combines the Price Action and the Relative Strength Index (RSI) to help identify potential buy and sell signals in a market. The Price Action Oscillator measures the difference between the closing price and a 20-period moving average, and then normalizes this value by dividing it by the standard deviation of the closing price from the same moving average. The result is an oscillator that oscillates around zero, with positive values indicating that the closing price is above the moving average and negative values indicating the opposite. The oscillator is then normalized again to smooth out the curve.
The RSI is also calculated using a 14-period setting. The color of the oscillator line is determined by its normalized value and the RSI level. A green color is used for averaging values, black for values when the RSI is above 70, and red for values when the RSI is below 30. A dashed line is also plotted at the zero level to help identify potential buy and sell signals.
Traders can use this script to identify potential buy and sell signals based on the cross of the oscillator line with the zero line, as well as the color of the oscillator line. A buy signal may be identified when the oscillator line crosses above the zero line and is colored black, while a sell signal may be identified when the oscillator line crosses below the zero line and is colored red.
---------- ITALIAN -------------
Questo oscillatore combina l'oscillatore Price Action e l'Indice di Forza Relativa (RSI) per aiutare a identificare potenziali segnali di acquisto e vendita in un mercato. L'oscillatore Price Action misura la differenza tra il prezzo di chiusura e una media mobile a 20 periodi, e poi normalizza questo valore dividendo la differenza per la deviazione standard della chiusura dalla stessa media mobile. Il risultato è un oscillatore che oscilla intorno allo zero, con valori positivi che indicano che il prezzo di chiusura è sopra la media mobile e valori negativi che indicano il contrario. L'oscillatore viene poi nuovamente normalizzato per levigare la curva.
L'RSI viene anche calcolato utilizzando una configurazione a 14 periodi. Il colore della linea dell'oscillatore è determinato dal suo valore normalizzato e dal livello RSI. Viene utilizzato il colore verde per i valori medi, nero per i valori quando l'RSI è superiore al 70 e rosso per i valori quando l'RSI è inferiore al 30. Viene anche disegnata una linea tratteggiata a livello dello zero per aiutare a identificare potenziali segnali di acquisto e vendita.
I trader possono utilizzare questo script per identificare potenziali segnali di acquisto e vendita in base all'incrocio della linea dell'oscillatore con la linea dello zero, nonché al colore della linea dell'oscillatore. Un segnale di acquisto può essere identificato quando la linea dell'oscillatore incrocia sopra la linea dello zero e viene colorata di nero, mentre un segnale di vendita può essere identificato quando la linea dell'oscillatore incrocia sotto la linea dello zero e viene colorata di rosso.
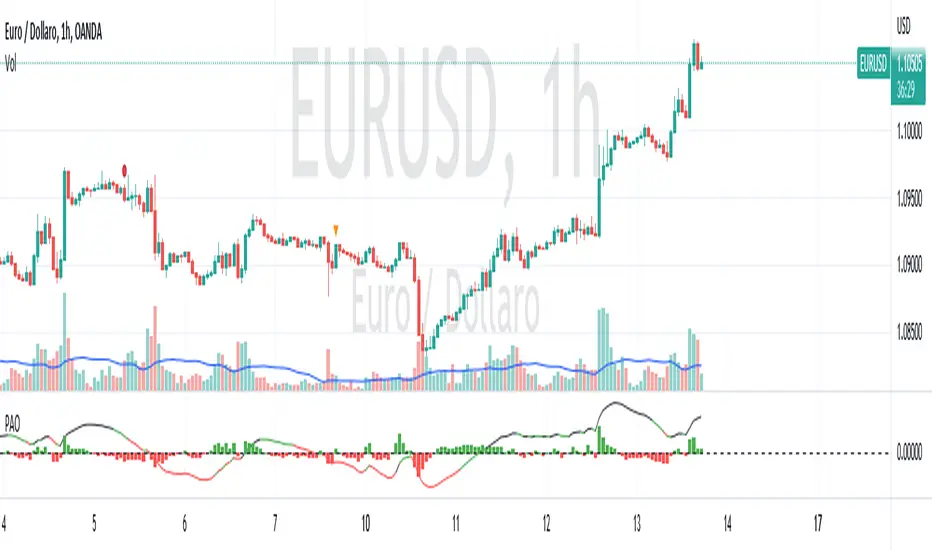
Rangemeter [theEccentricTrader]█ OVERVIEW
This indicator simply displays candle and peak to trough ranges in points or pips, depending on the symbol type, in a table, which can be repositioned and resized at the user's discretion.
█ CONCEPTS
Green and Red Candles
• A green candle is one that closes with a close price equal to or above the price it opened.
• A red candle is one that closes with a close price that is lower than the price it opened.
Open Green and Red Candles
• An open green candle is one that has a close price equal to or above the price it opened, but has not yet closed to confirm the condition.
• An open red candle is one that has a close price lower than the price it opened, but has not yet closed to confirm the condition.
Swing Highs and Swing Lows
• A swing high is a green candle or series of consecutive green candles followed by a single red candle to complete the swing and form the peak.
• A swing low is a red candle or series of consecutive red candles followed by a single green candle to complete the swing and form the trough.
Peak and Trough Prices (Basic)
• The peak price of a complete swing high is the high price of either the red candle that completes the swing high or the high price of the preceding green candle, depending on which is higher.
• The trough price of a complete swing low is the low price of either the green candle that completes the swing low or the low price of the preceding red candle, depending on which is lower.
Historic Peaks and Troughs
The current, or most recent, peak and trough occurrences are referred to as occurrence zero. Previous peak and trough occurrences are referred to as historic and ordered numerically from right to left, with the most recent historic peak and trough occurrences being occurrence one.
Range
The range is simply the difference between the current peak and current trough prices, generally expressed in terms of points or pips.
Open Range
An open range is here defined as one that is forming but has not yet completed. For example, a swing low that has an open green candle proceeding a red candle or series of red candles. Or a swing high that has an open red candle proceeding a green candle or series of green candles.
The table will only display the open range under the aforementioned circumstances, otherwise it will display the current, or previous, range.
█ FEATURES
Inputs
• Show Candle Ranges
• Show Largest and Smallest Candle Ranges
• Average Candle Range Lookback
• Show Ranges
• Show Largest and Smallest Ranges
• Average Range Lookback
• Position
• Text Size
█ HOW TO USE
The indicator can be used for strategy filtering and development, gauging current market conditions versus historic and helping to make more informed discretionary trading decisions. It can also be used like my Wavemeter indicator to objectively set the angle and projection ratio for my Fan Projections and Parallel Projections indicators.
█ LIMITATIONS
Some higher timeframe candles on tickers with larger lookbacks such as the DXY , do not actually contain all the open, high, low and close (OHLC) data at the beginning of the chart. Instead, they use the close price for open, high and low prices. So, while we can determine whether the close price is higher or lower than the preceding close price, there is no way of knowing what actually happened intra-bar for these candles. And by default candles that close at the same price as the open price, will be counted as green. You can avoid this problem by ensuring the lookback for the average range does not reach as far back as the start of the chart. If you are unsure about the candle count you can use my Candle Counter indicator to find out how many candles are displayed on the chart.
The green and red candle calculations are based solely on differences between open and close prices, as such I have made no attempt to account for green candles that gap lower and close below the close price of the preceding candle, or red candles that gap higher and close above the close price of the preceding candle. I can only recommend using 24-hour markets, if and where possible, as there are far fewer gaps and, generally, more data to work with. Alternatively, you can replace the scenarios with your own logic to account for the gap anomalies, if you are feeling up to the challenge.
It is also worth noting that the lookback will be limited to your Trading View subscription plan. Premium users get 20,000 candles worth of data, pro+ and pro users get 10,000, and basic users get 5,000.

Intra-Candles*For use with <=24 hour Hollow Candles *
Indicator for more informative candle plotting. Select from 2-6 lower timeframe candles and view the price action of the lower bars within the normal chart's candles. Plotting short time frame candles with a semi-transparent body lets you see reversals that occurred during the larger candle's formation. Use the information provided to inform your own trading decisions.
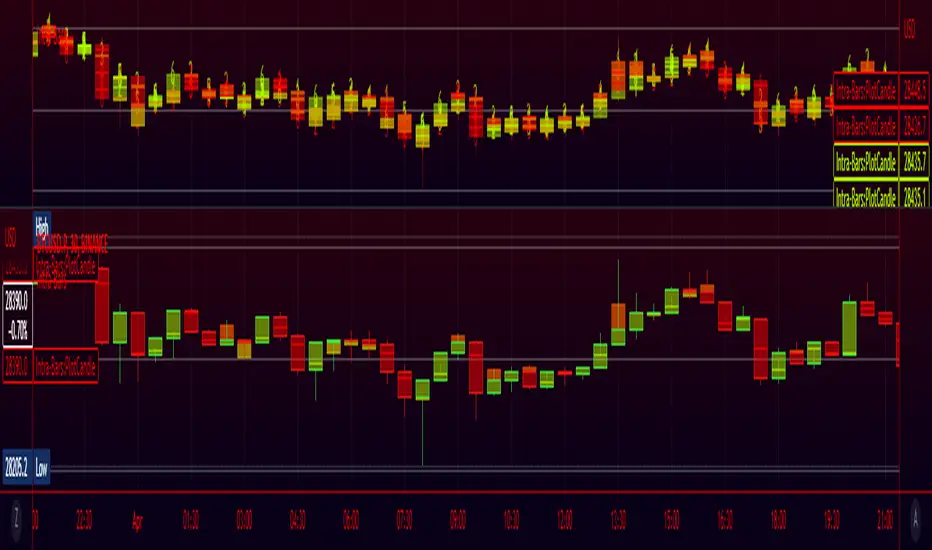
Candle Counter [theEccentricTrader]█ OVERVIEW
This indicator counts the number of confirmed candle scenarios on any given candlestick chart and displays the statistics in a table, which can be repositioned and resized at the user's discretion.
█ CONCEPTS
Green and Red Candles
A green candle is one that closes with a high price equal to or above the price it opened.
A red candle is one that closes with a low price that is lower than the price it opened.
Upper Candle Trends
A higher high candle is one that closes with a higher high price than the high price of the preceding candle.
A lower high candle is one that closes with a lower high price than the high price of the preceding candle.
A double-top candle is one that closes with a high price that is equal to the high price of the preceding candle.
Lower Candle Trends
A higher low candle is one that closes with a higher low price than the low price of the preceding candle.
A lower low candle is one that closes with a lower low price than the low price of the preceding candle.
A double-bottom candle is one that closes with a low price that is equal to the low price of the preceding candle.
█ FEATURES
Inputs
Start Date
End Date
Position
Text Size
Show Sample Period
Show Plots
Table
The table is colour coded, consists of three columns and twenty-two rows. Blue cells denote all candle scenarios, green cells denote green candle scenarios and red cells denote red candle scenarios.
The candle scenarios are listed in the first column with their corresponding total counts to the right, in the second column. The last row in column one, row twenty-two, displays the sample period which can be adjusted or hidden via indicator settings.
Rows two and three in the third column of the table display the total green and red candles as percentages of total candles. Rows four to nine in column three, coloured blue, display the corresponding candle scenarios as percentages of total candles. Rows ten to fifteen in column three, coloured green, display the corresponding candle scenarios as percentages of total green candles. And lastly, rows sixteen to twenty-one in column three, coloured red, display the corresponding candle scenarios as percentages of total red candles.
Plots
I have added plots as a visual aid to the various candle scenarios listed in the table. Green up-arrows denote higher high candles when above bar and higher low candles when below bar. Red down-arrows denote lower high candles when above bar and lower low candles when below bar. Similarly, blue diamonds when above bar denote double-top candles and when below bar denote double-bottom candles. These plots can also be hidden via indicator settings.
█ HOW TO USE
This indicator is intended for research purposes and strategy development. I hope it will be useful in helping to gain a better understanding of the underlying dynamics at play on any given market and timeframe. It can, for example, give you an idea of any inherent biases such as a greater proportion of green candles to red. Or a greater proportion of higher low green candles to lower low green candles. Such information can be very useful when conducting top down analysis across multiple timeframes, or considering trailing stop loss methods.
What you do with these statistics and how far you decide to take your research is entirely up to you, the possibilities are endless.
This is just the first and most basic in a series of indicators that can be used to study objective price action scenarios and develop a systematic approach to trading.
█ LIMITATIONS
Some higher timeframe candles on tickers with larger lookbacks such as the DXY, do not actually contain all the open, high, low and close (OHLC) data at the beginning of the chart. Instead, they use the close price for open, high and low prices. So, while we can determine whether the close price is higher or lower than the preceding close price, there is no way of knowing what actually happened intra-bar for these candles. And by default candles that close at the same price as the open price, will be counted as green. You can avoid this problem by utilising the sample period filter.
The green and red candle calculations are based solely on differences between open and close prices, as such I have made no attempt to account for green candles that gap lower and close below the close price of the preceding candle, or red candles that gap higher and close above the close price of the preceding candle. I can only recommend using 24-hour markets, if and where possible, as there are far fewer gaps and, generally, more data to work with. Alternatively, you can replace the scenarios with your own logic to account for the gap anomalies, if you are feeling up to the challenge.
It is also worth noting that the sample size will be limited to your Trading View subscription plan. Premium users get 20,000 candles worth of data, pro+ and pro users get 10,000, and basic users get 5,000. If upgrading is currently not an option, you can always keep a rolling tally of the statistics in an excel spreadsheet or something of the like.
