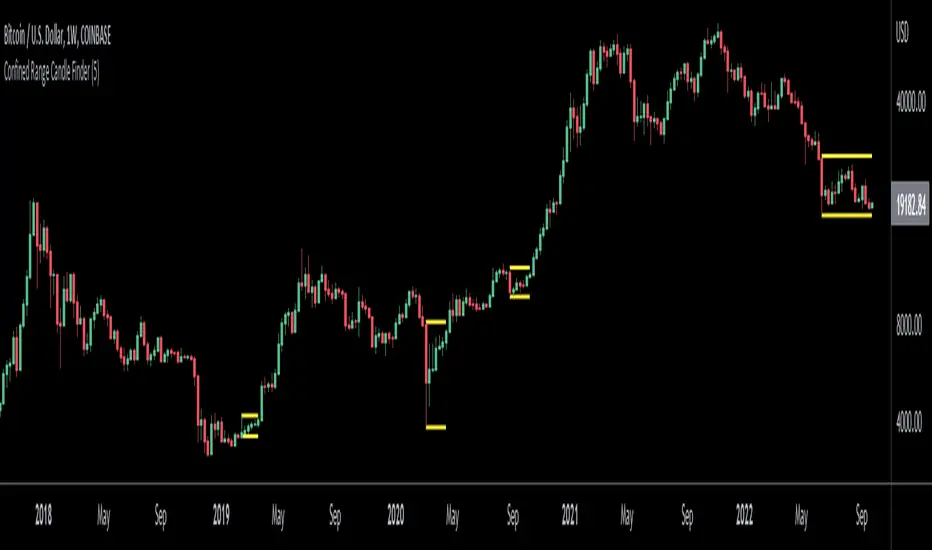
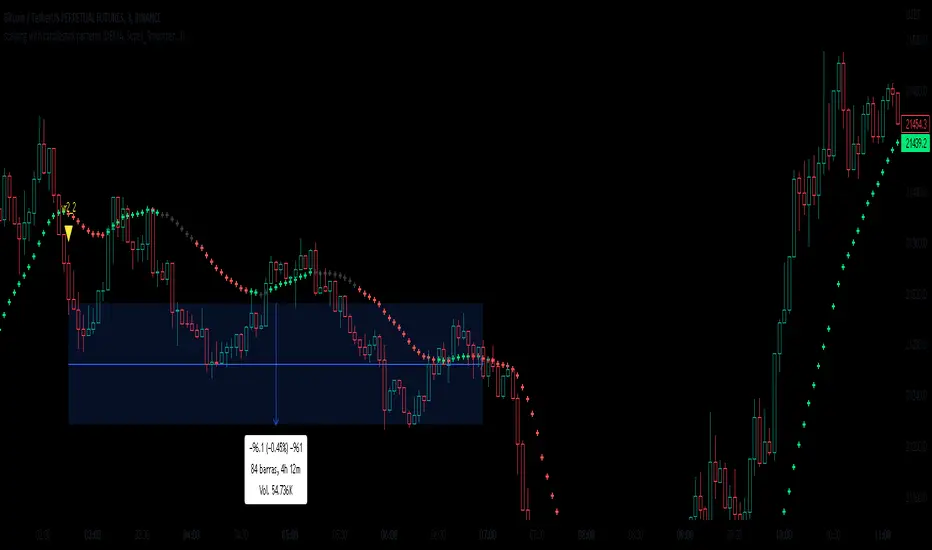
Confined Range Candle FinderThis indicator finds candlesticks which are confined within the range of a previous candlestick. This indicates volatility contraction which often leads to volatility expansion, i.e. large price movements.
While every confined range will contain at least 1 inside bar, this indicator differs from the Inside Bar Finder which only finds consecutive inside bars.
This indicator includes options such as:
- The minimum number of candlesticks confined within the range of a previous candlestick to trigger the indicator
- Labels to indicate the number of confined candles
- Signal lines to indicate the high and low of the containing candlestick
Try out this indicator with different options on different timeframes to see if confined ranges increase the probability of identifying the direction of price movements. Breaks or closes outside signal lines can be used to trigger trade signals.
Candlestick Analysis
Price Line Extended to the Right with Price Label | by Octopu$🔖 Price Line Extended to the Right with Price Label | by Octopu$
This is an Add-On customization tool for your Chart Price Level.
Tired of having the TradingView's priceline all across the Chart?
And not having the Option to turn it off/extend to right only?
Worry you not. Got solutions for any problems you may have!
As well as many arms.
This Indicator provides an extended price line to the right only,
Starting from the current candle, towards the price levels.
Additionally, provides a quick price label for fast reference.
You can turn on/off the line,
As well as on/off the label.
Colors change according to candle direction:
Up/Down matching Green/Red.
Please remember to turn OFF TradingView's price line.
Otherwise it'll overlap. Price Line/Tag "replaces" that.
Works in Any Time Frame.
On Any Ticker.
(Using ES 5m just as an example:)
www.tradingview.com
SPY
Features:
• Price Tag
• Price Line
• Extend to Right
• Automatic color change
Options:
• Toggle On/Off Price Line
• Toggle On/Off Price Tag
Notes:
v1.0
Indicator release
Changes and updates can come in the future for additional functionalities or per requests.
Did you like it? Boost it. Shoot a message! I'd appreciate if you dropped by to say thanks.
- Octopu$
🐙

Minimalist Doji HighlighterThis minimalism focused indicator was designed specifically to highlight doji candles (gravestone, long-legged, and dragonfly) that generally signal indecision/neutrality within price structure to improve trading accessibility for the disabled/visually impaired, visual charting cues or pattern visibility, and educational/learning purposes.
HOW TO USE IT:
Highlight doji candles to improve visual cues on chart.
Default size of 0.15-0.02 works best, yet can be modified thus ensuring flexibility of use and experimentation.
Additionally, there is an option to add crosses above doji candles for additional visual cues; this feature is set to false by default to avoid cluttering charts.
MARKET USAGE:
All time frames and assets.
MARKET CONDITIONS:
All conditions.

FVG / Imbalance ZONES (@JP7FX)Fair Value Gaps / Imbalance are created when Price moves away in one direction at speed / impulsively.
A gap is created between the first and third candle wick which creates the Imbalance / Fair Value Gap and is sometimes a potential area of where the market could return
making the area a good place to look to trade from or to aim for.
This Imbalance / Fair Value Gap indicator will change the color of the candles where these gaps have been created and also create a zone.
Although the candle color will not change, the zone however will be removed when price has closed the Gap making it easier to look for the untouched Fair Value Gaps / Imbalance when opening the charts or changing between timeframes and allowing you to create your potential areas to trade from or areas to target.
You can set alerts for when a FVG / Imbalance zones are created and also for when the zone gets mitigated by price.
Hope you find it useful and happy safe trading :)

Regression Channel, Candles and Candlestick Patterns by MontyRegression Candles by ugurvu
Regression Channel by Tradingview
All Candlestick Patterns By Tradingview
This script was combined for a friend of mine who needed this.
This Script has regression candles by ugurvu, Regression channel and Candlestick patterns by tradingview.
The intention was to fuse these together so more information can be processed on the cost of a single indicator.

MTFT Patterns Noob, TheStrat Suite (1of5)Multi Time Frame Tools
Multi Time Frame Tools (MTFT) is a suite of scripts aimed to establish a standard timeframe-based color scheme. This can be utilized to overlay different timeframes calculations/values over a single timeframe. As one example, this would allow to observe the 5-month moving average, 5-week moving average, and 5-day moving average overlaid over each other. This would allow to study a chart, get accustomed to the color scheme and study all these at the same time much easier.
All indicators calculated using the below specific timeframes as input, will always use the color scheme outlined below. This is to get you in habit of recognizing the different timeframes overlaid in top of each other. These can be personalized.
Longer TF analysis.
Yearly - Black
Semi-Annual - Yellow
Quarterly - White
Monthly - Maroon
Weekly - Royal Blue
Daily - Lime
Shorter TF analysis.
4 hour - Fuchsia
1 hour - Orange
30 min - Red
15 min - Brown
10 min - Purple
5 min - Lilac
All color coordination is able to be modified in either the “Inputs” or “Style” section. If you need to make changes, make sure to select “Save as Default” on the bottom right of the settings menu.
Recommended Chart Color Layout
I played around with color coordination a lot. The final product was what worked best for me. I personally use the following chart settings to accent all available TF colors.
-> Click on the settings wheel on your chart. -> Click on “Appearance”.
Background - Solid -> On the top row pick the 6th color from the left.
Vert Grid Lines and Horz Grid Lines -> On the top row pick the 7th color from the left.
You may of course change these and the indicator line colors as you like.
Adding indicator to Chart
-> Open the TradingView “Indicators & Strategies” library, the icon has “ƒx”. -> All premium scripts will be located under “Invite-Only Scripts” -> Click indicator to add to your chart.
MTFT TheStrat Suite (5 Scripts)
Rob Smith is the creator of ‘TheStrat’ trading strategy. For ‘TheStrat’ I have put together a suite of 5 premium scripts that combined will offer people interested in learning ‘TheStrat’ a cleaner learning process. For 2 of the 5 scripts specifically, the MTFT approach of overlaying multiple longer timeframes(TF) over a shorter TF selected as a display cannot be utilized. The other 2 scripts will have full MTFT functionality and they are my personal favorite. I will be providing very basic info to utilize this script; it is up to you to dive deep into learning this strategy. I am not an expert with the tool or a financial advisor. As with all aspects of life, I recommend you research, learn, discern and practice extensively in order to become a master.
*1. MTFT Patterns Pro/Noob
2. MTFT Full Time Frame Continuity Table
3. MTFT Last HML wOpen
4. MTFT Actionable Signal Targets
5. MTFT Reversal Lines
MTFT Patterns Pro/Noob, TheStrat Suite (1of5)
Features includes:
1.) Absolute Truth #. This setting will provide the candlesticks absolute truth # below the CS.
2.) Color bars based on Absolute Truth. This setting will color all inside candlesticks yellow, all Green Outside Candlesticks White and all Red Outside Candlesticks Fuchsia. Scenario 2 candlesticks are left as is and will color based on the color of the original candlestick. This setting is default enabled and needs to be disabled in the “Style” tab under the indicator settings wheel. I found this more practical in getting used to the 3 absolute truth scenarios.
3.) Reversals. This setting will mark when reversal patterns as discussed by Rob are posted. Noob version will also include the description of the reversal pattern, while the Pro version will only plot an ‘R’ without the text description. Note: There should never be back-to-back green Rs or red Rs. I found this issue a lot on many of the other ‘TheStrat’ scripts out there. TradingView development team note: The plotchar function does not allow dynamic text so this is the only reason on why there needs to be two separate versions of the script. ‘Pro’ is important for experienced users that already identify the patterns without the text and ‘Noob’ is important for beginner users that still need the text description of the pattern.
4. Continuations. This setting will mark when continuation patterns as discussed by Rob are posted. Noob version will also include the description of the continuation pattern, while the Pro version will only plot a ‘C’ without the text description.
TradingView Admin note: The plotchar function does not allow dynamic text so this is the only reason why there needs to be two separate versions of the script. ‘Pro’ is important for experienced users that already identify the patterns without the text and ‘Noob’ is important for beginner users that still need the text description of the pattern.
5. Actionable Signals and Complex Actionable Signals (CAS). This has several objective parameters as defined by Rob’s course. ‘Complex Actionable Signals’ is a name I used when speaking of actionable signals that require a combination of 2 or more candlesticks.
Actionable Signals.
• All inside candlesticks(Absolute Truth #1)
• Hammers
• Shooting Stars
Complex Actionable Signals.
• (Absolute Truth Combo 1-3-1 )Inside Outside Inside
• Outside -> Hammer
• Outside -> Shooting Star
• Inside -> Hammer
• Inside -> Shooting Star
• Momentum Inside
• Momentum Hammer
• Momentum Shooting Star
• Hammer -> Shooting Star
• Shooting Star -> Hammer
5a. Example CAS 1-3G-1. I am including only one example of several of the CAS that are included in this script. The star is utilized for all CAS, the color and location designate the direction that the CAS would have you act on. Note the “Entry” and “Target” line were added manually and are not part of the script. This is one successful setup; don’t get excited thinking this is how it always works. I will let you discover and learn for yourself that there is many failed setups and many setups that never trigger the actionable signal. This is where setting alerts is very handy.
6. Alerts. Press on the “Create Alert” Icon for TradingView. When the prompt opens select the preferred script either “TheStrat Pro” or “TheStrat Noob” under “Condition” and then under the sub-menu select any of the following scenarios.
• C ▲/ ▼ = If the active CS shows a continuation up/down pattern, remember this CS is active and can still change direction and trigger a reversal in the other direction.
• R ▲/▼ = If the active CS shows a reversal up/down pattern, remember this CS is active and can still change direction and trigger a continuation in the previous trend direction.
• HM Trigger(Last High Cross) = Alert when the active CS breaks the high of the previous CS. As a new CS opens, it re-adjusts its values and is just constantly waiting for the active CS break through the previous CS high.
• SS Trigger(Last Low Cross) = Alert when the active CS breaks the low of the previous CS. As a new CS opens, it re-adjusts its values and is just constantly waiting for the active CS break through the previous CS low.
• Inside Trigger (Last High/Low Cross) = Alert when the active CS breaks the low or the high of the previous CS. As a new CS opens, it re-adjusts its values and is just constantly waiting for the active CS break through either the previous CS low or the high.
• Last CS Inside
• Last CS H
• Last CS S
• Last CS Actionable Signal (inside, H or S)
• Last CS Complex Actionable Signal
• Last CS Any Actionable Signal

MTFT Patterns Pro, TheStrat Suite (1of5)Multi Time Frame Tools
Multi Time Frame Tools (MTFT) is a suite of scripts aimed to establish a standard timeframe-based color scheme. This can be utilized to overlay different timeframes calculations/values over a single timeframe. As one example, this would allow to observe the 5-month moving average, 5-week moving average, and 5-day moving average overlaid over each other. This would allow to study a chart, get accustomed to the color scheme and study all these at the same time much easier.
All indicators calculated using the below specific timeframes as input, will always use the color scheme outlined below. This is to get you in habit of recognizing the different timeframes overlaid in top of each other. These can be personalized.
Longer TF analysis.
Yearly - Black
Semi-Annual - Yellow
Quarterly - White
Monthly - Maroon
Weekly - Royal Blue
Daily - Lime
Shorter TF analysis.
4 hour - Fuchsia
1 hour - Orange
30 min - Red
15 min - Brown
10 min - Purple
5 min - Lilac
All color coordination is able to be modified in either the “Inputs” or “Style” section. If you need to make changes, make sure to select “Save as Default” on the bottom right of the settings menu.
Recommended Chart Color Layout
I played around with color coordination a lot. The final product was what worked best for me. I personally use the following chart settings to accent all available TF colors.
-> Click on the settings wheel on your chart. -> Click on “Appearance”.
Background - Solid -> On the top row pick the 6th color from the left.
Vert Grid Lines and Horz Grid Lines -> On the top row pick the 7th color from the left.
You may of course change these and the indicator line colors as you like.
Adding indicator to Chart
-> Open the TradingView “Indicators & Strategies” library, the icon has “ƒx”. -> All premium scripts will be located under “Invite-Only Scripts” -> Click indicator to add to your chart.
MTFT TheStrat Suite (5 Scripts)
Rob Smith is the creator of ‘TheStrat’ trading strategy. For ‘TheStrat’ I have put together a suite of 5 premium scripts that combined will offer people interested in learning ‘TheStrat’ a cleaner learning process. For 2 of the 5 scripts specifically, the MTFT approach of overlaying multiple longer timeframes(TF) over a shorter TF selected as a display cannot be utilized. The other 2 scripts will have full MTFT functionality and they are my personal favorite. I will be providing very basic info to utilize this script; it is up to you to dive deep into learning this strategy. I am not an expert with the tool or a financial advisor. As with all aspects of life, I recommend you research, learn, discern and practice extensively in order to become a master.
*1. MTFT Patterns Pro/Noob
2. MTFT Full Time Frame Continuity Table
3. MTFT Last HML wOpen
4. MTFT Actionable Signal Targets
5. MTFT Reversal Lines
MTFT Patterns Pro/Noob, TheStrat Suite (1of5)
Features includes:
1.) Absolute Truth #. This setting will provide the candlesticks absolute truth # below the CS.
2.) Color bars based on Absolute Truth. This setting will color all inside candlesticks yellow, all Green Outside Candlesticks White and all Red Outside Candlesticks Fuchsia. Scenario 2 candlesticks are left as is and will color based on the color of the original candlestick. This setting is default enabled and needs to be disabled in the “Style” tab under the indicator settings wheel. I found this more practical in getting used to the 3 absolute truth scenarios.
3.) Reversals. This setting will mark when reversal patterns as discussed by Rob are posted. Noob version will also include the description of the reversal pattern, while the Pro version will only plot an ‘R’ without the text description. Note: There should never be back-to-back green Rs or red Rs. I found this issue a lot on many of the other ‘TheStrat’ scripts out there. TradingView development team note: The plotchar function does not allow dynamic text so this is the only reason on why there needs to be two separate versions of the script. ‘Pro’ is important for experienced users that already identify the patterns without the text and ‘Noob’ is important for beginner users that still need the text description of the pattern.
4. Continuations. This setting will mark when continuation patterns as discussed by Rob are posted. Noob version will also include the description of the continuation pattern, while the Pro version will only plot a ‘C’ without the text description.
TradingView Admin note: The plotchar function does not allow dynamic text so this is the only reason why there needs to be two separate versions of the script. ‘Pro’ is important for experienced users that already identify the patterns without the text and ‘Noob’ is important for beginner users that still need the text description of the pattern.
5. Actionable Signals and Complex Actionable Signals (CAS). This has several objective parameters as defined by Rob’s course. ‘Complex Actionable Signals’ is a name I used when speaking of actionable signals that require a combination of 2 or more candlesticks.
Actionable Signals.
• All inside candlesticks(Absolute Truth #1)
• Hammers
• Shooting Stars
Complex Actionable Signals.
• (Absolute Truth Combo 1-3-1 )Inside Outside Inside
• Outside -> Hammer
• Outside -> Shooting Star
• Inside -> Hammer
• Inside -> Shooting Star
• Momentum Inside
• Momentum Hammer
• Momentum Shooting Star
• Hammer -> Shooting Star
• Shooting Star -> Hammer
5a. Example CAS 1-3G-1. I am including only one example of several of the CAS that are included in this script. The star is utilized for all CAS, the color and location designate the direction that the CAS would have you act on. Note the “Entry” and “Target” line were added manually and are not part of the script. This is one successful setup; don’t get excited thinking this is how it always works. I will let you discover and learn for yourself that there is many failed setups and many setups that never trigger the actionable signal. This is where setting alerts is very handy.
6. Alerts. Press on the “Create Alert” Icon for TradingView. When the prompt opens select the preferred script either “TheStrat Pro” or “TheStrat Noob” under “Condition” and then under the sub-menu select any of the following scenarios.
• C ▲/ ▼ = If the active CS shows a continuation up/down pattern, remember this CS is active and can still change direction and trigger a reversal in the other direction.
• R ▲/▼ = If the active CS shows a reversal up/down pattern, remember this CS is active and can still change direction and trigger a continuation in the previous trend direction.
• HM Trigger(Last High Cross) = Alert when the active CS breaks the high of the previous CS. As a new CS opens, it re-adjusts its values and is just constantly waiting for the active CS break through the previous CS high.
• SS Trigger(Last Low Cross) = Alert when the active CS breaks the low of the previous CS. As a new CS opens, it re-adjusts its values and is just constantly waiting for the active CS break through the previous CS low.
• Inside Trigger (Last High/Low Cross) = Alert when the active CS breaks the low or the high of the previous CS. As a new CS opens, it re-adjusts its values and is just constantly waiting for the active CS break through either the previous CS low or the high.
• Last CS Inside
• Last CS H
• Last CS S
• Last CS Actionable Signal (inside, H or S)
• Last CS Complex Actionable Signal
• Last CS Any Actionable Signal
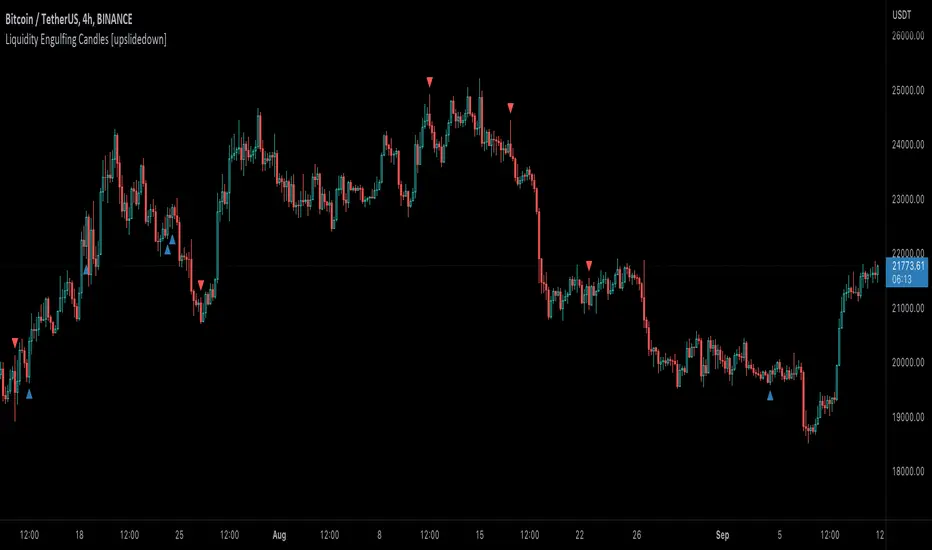
Liquidity Engulfing Candles [upslidedown]Liquidity engulfing candles (LEC) are a variant of a common candlestick pattern: engulfing candles but with a couple extra conditions applied. These conditions expect highs/lows to be taken out in order to show a continuation or reversal signal.
Filter 1: Stop Hunt Wick Filter
This filter requires the candle to wick into the prior candles high or low ( bullish = wick below prior candle lows). This is the stop hunt.
Filter 2: Close Filter
This filter requires the candle to close above or below above the prior candle ( bullish = close above prior candle high). This is the confirmation.
This idea was introduced to me by @attrk632. Thanks, mate!
The $trat | by Octopu$1️⃣2️⃣3️⃣ The $trat | by Octopu$
The $trat: The Strat by Octopu$
Absolute Solution for The Strat Traders!
The Strat is a Strategy created by Rob Smith's and is well known by being an innovative trading system.
Continues to grow in popularity as more traders discover this method.
It is a simplified way to understand Price Action. It is based on three principles: Types of candles, 1, 2, and 3.
Other things to be known about The Strat are Actionable Signals and Time Frame Continuity.
The $trat has it all.
This Indicator includes Bar Types (1, 2 and 3) also known as Inside Bars, Twos (Up or Down) and Outside Bars.
It is also well crafted with a built-in Time Frame Continuity (TFC) which shows Price Movement at a glimpse.
On top of that, in the best of both worlds, also comes with information about the Bars Status for other TFs as well.
It means that you can know how another TF of you preference is performing. Right there.
Works in Any Time Frame.
On Any Ticker.
(Using SPY 5m just as an example:)
www.tradingview.com
SPY
Features:
• Candle Types (1, 2 and 3) IB, 2U & 2D and OB.
• Time Frame Continuity (TFC) for Price Movement/Trend Check
• Bar Status shortcut. So you can know Price Action/Direction fast.
• Reversal indicators for Action-taking and Situational Awareness
• Combos Labels. So nothing ever goes unnoticed.
Options:
• Absolutely fully Customizable: Colors, Sizes, Numbers. Everything.
• On/Off Switches for most of the Information and Optionable Selections
• Hammer/Shooter Indicator automatically inserted to Chart
• Candle/Bars Coloring for ease of reading.
• Highlight options for specific setups
Notes:
v1.0
$trat Indicator release
Changes and updates can come in the future for additional functionalities or per requests.
Did you like it? Boost it. Shoot a message! I'd appreciate if you dropped by to say thanks.
- Octopu$
🐙

Gap FinderThe Gap Finder Indicator will allow you to quickly identify gaps on the chart. Gaps in this indicator are defined as the "black space" between candles with the space being as small as $0.01. A gap up is one where the previous candle's high is lower than the current candle's low. A gap down is one where the previous candle's low is higher than the current candle's high.
Features:
Highlight Gap Area will show the price levels for the last found gap.
Show Last Only - will show only the last gap to help declutter the chart.
Basic guidelines for Gap trading:
Wait 3-5 Periods to allow the momentum to settle
Take trade on reversal candle with stop above recent high
Exit for profit when the gap fills.
This indicator will work for all timeframes using the definitions above so good for day traders, swing traders and any other style of trader using gaps in their strategy.

Candle Info by MontyThis indicator was made to help my friend.
This indicator basically calculates the MOVE in percentage and shows the OHLC of candle in a label.
-> Panel Index: How much index you want the label to be.
-> Show Candle OHLC: Shows Open High Low and Close of the candle in the panel/label
-> % Calculation Mode:
1: Calculated by Candle Wick Low to Candle Wick High for Green candle and Vice Versa for Red Candle
2: Calculated by Open of a candle to the current price.
-> Label Text Color: Used to change the color of the Label Text
-> Label Background Color: Used to change the color of Label background
Join the free Discord: discord.gg/chuffgang

Scallop Pattern built for scalping NQ & MNQ
The Scallop Pattern identifies momentum reversal.
The pattern consists of two candles and the direction to trade is confirmed in the following candle.
An example trade is shown in the picture. s3.tradingview.com
A Stop Limit order is generally used to enter the long position.

scalping with candlestick patterns VJThis indicator will show you when a volume-based candlestick pattern forms.
It contains different candlestick patterns to be able to use it in scalping.
Each pattern has a specific name to identify it
It is recommended to use it in 1 minute charts.
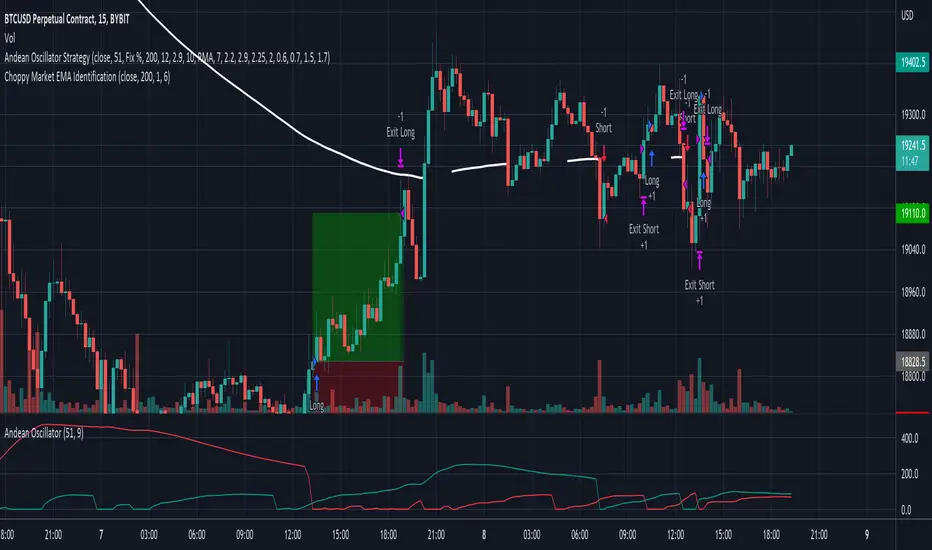
Choppy Market EMA IdentificationThis indicator could be used to identify choppy Market Conditions based on the EMA.
It is an EMA that could be configured to only show up, if the last 1..n candles are NOT crossing the EMA in any direction.
I figured out that lower timeframes ( < 30 min) often the price bounces around the 200 EMA and gives lot of false signals using different strategies.
So i decided to write a small indicator to avoid taking trades in those market conditions.
The Indicator could be configured for the length of the EMA and how many crosses must be happened in the defined numbers of candles.
Candlestick Channels [LuxAlgo]Candlestick Channels return channels whose extremities converge towards the price when a corresponding candlestick pattern is detected. This allows for us to obtain more reactive extremities in the presence of a cluster of candlestick patterns.
The detected candlestick patterns are also highlighted with labels on your chart automatically.
Settings
Trend Length: Period of the stochastic oscillator used to determine trend sentiment; this sentiment is used to detect certain candlestick patterns.
Convergence: Convergence percentage of the channel extremities used during the occurrence of a candlestick pattern. A lower value will return extremities converging more slowly toward the price.
Smooth: Determines the degree of smoothness of the channel extremities.
Patterns
This category determines which patterns are detected by the indicator. Patterns toggled off will not be detected and won't affect the channels.
Usage
Candlesticks patterns are commonly used by traders to detect potential reversals or continuation periods in the price. It can be of interest to use them as core elements in the calculation of more classical indicators, this can allow us to filter out potential false signals returned by candlestick patterns by shifting the source of interpretation towards the channel extremities instead.
In this indicator extremities converge towards the price when a corresponding pattern is detected. As such bullish patterns will make the upper extremity converge towards the price, facilitating a cross with price. Using a lower convergence percentage will require a greater number of patterns to make the extremity converge closer towards the price.
Users can use the channel like most indicators returning extremities, with an uptrend being detected when price cross over the upper extremity and a downtrend being detected when price cross under the lower extremity.
An approach solely making use of crosses between the price and the average line can be used but the user should expect further whipsaws signals.
Users can eventually use the candlestick patterns as entries and use the extremities for confirmation. For example, users can follow a candlestick pattern return an indication in accordance with the detected trend by the channels.
This approach would lead to the following of bullish patterns when they occur in an uptrend, that is when the price is above the average line (in orange). The same logic applies to bearish patterns.
The chart above highlights the candlesticks patterns in accordance with a detected trend.
Notes
- Bullish/Bearish engulfing patterns are turned off by default due their more frequent appearance.
- Candlestick patterns relying on gaps were not included, since they would be more uncommon in cryptocurrencies, thus leading to a disparity between the indicator performance on the cryptocurrency and stock market.
Sneaky VolumeSneaky Volume
An experimental script that marks the highest and lowest candle of the day with above average volume.
New candles that meet the criteria will repaint until daily close
How to use
They can be interpreted in a number of ways. Potential sign of consolidation, reversal, continuation or retest zones. Use on own discretion.
In action

Price Action CandlesThis simple script provides a visual aid for price action traders by coloring outside & inside candles, which in effect leaves the trader with 6 possible candle colors:
-Regular bullish candle
-Outside bullish candle
-Inside bullish candle
-Regular bearish candle
-Outside bearish candle
-Inside bearish candle
These candlesticks may provide powerful signals when used in conjunction with key levels, market structure and chart patterns.
Make sure to disable the regular candlesticks (body, borders and wicks) in the symbol tab inside the configuration menu!
Hope it can help someone!
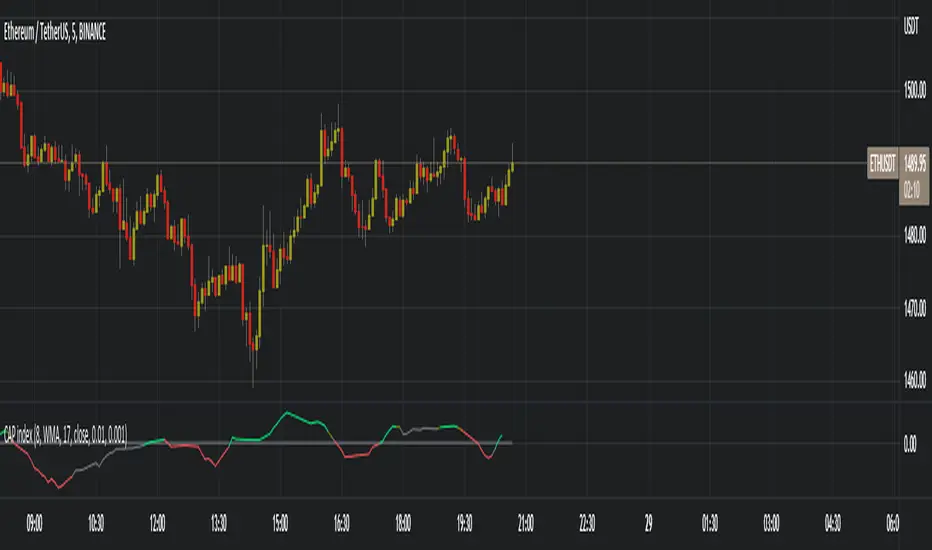
Constantly Applied Pressure Index (CAP index)BINANCE:ETHUSDT
The CAP index is my own homebrew trend indicator made to help traders see the slightly bigger picture, because we all know that as traders we can tend to hyper-focus in on a few candles and end up making a stupid trade because of it, or is it just me ? On a more serious note this indicator helps you find the short term trend by looking at bullish and bearish candles comparing their sizes, volumes and predominance.
The indicator has many technical settings for you to play around with but on the defaults it will render in a few colors which I will explain. Gray means no trend or that the current trend has died, bright green or red mean that a trend has formed, is playing out or that there is a good change a strong trend is about to form. Obviously green means bullish and red means bearish. Finally darker green and red mean a weak or weakening trend, this serves as a warning if you are about to take a trade in the trend direction.
The way I recommend using the indicator is the same way many trend indicators are used, as a filter to either a different indicator creating trading signals or to your own strategy's signals. I would add an illustration here that I prepared but I cannot because of tradingview's reputation rules
Mark StructureMark Structure is building the market swing structure, minor and sub structure and marks all possible insignificant pivots
Building such structure is really complex task to do, that has a lot of obstacles and challenges. I'm doing my best to develop this indicator behaving in absolutely expectable and right way. Fill free to leave any comments or bug reports.
it supports:
- Marking all pivots with labels or join them continuously with trend lines.
- Marking minor and sub structured swings with labels or join them continuously with trend lines. Marking BOS or SMS BOS, which are mbos. Minor and substructure are structures inside swing structure and it can differ from the structure of lower timeframe
- Marking swings of swing structure with labels or join them continuously with trend lines. Marking BOS or SMS BOS of swing structure
- Changing bullish and bearish colors of each kind of structures
- Changing pivot labelings
- Changing colors of BOSs
Remarks:
- As I told you guys before, it has a lot of challenging cases. eg we have swing low and high on the same candle and in order to decide which pivot goes first I take lower time frame data to figure out what pivot is the first, but it happens that on lower time frame the same issue takes place, due to limitation of TradingView I can't go infinitely to lower timeframes to solve this issue, so I mark those cases with labels
- Another issue is very beginning of the trend its hard to detect swing structure there due to missing historical data. so skip a few waves in the very beginning
- Don't expect to have minor and sub structure in each swing waves, its totally fine when you don't have them at all
- Swing structure is the most significant structure and shows real price direction. Trend change is confirmed when for bull->bear the last HLbull LH>HH and HH-HL-HH are confirmed. You can change labelling for unconfirmed swing trend in the settings. By default its already done

Mark FVGsMark FVGs is marking FVG (stands for Fair Value Gap, other name is Imbalance or IMB) on your chart so that you can instantly detect them
It supports:
- marking bullish and bearish partly filled or unfilled FVGs of the current timeframe
- marking bullish and bearish already filled FVGs of the current timeframe
- marking bullish and bearish FVGs of the any 4 timeframes on your current timeframe
technically it re-builds them on the last bar or as soon as new realtime bar is updated. it looks with 1k bars back to find the nearest specific number of FGVs
Adjustments:
- changing the maximum number of FVGs to display.
- changing the color of FVG area
- displaying already filled FVG of the current time frame
- changing the mode of displaying area it can either extended or fixed width
- displaying labels of other time frame FVGs

Inside Bar HighlightInside Bar have at least 2 candles.
They include one mother candle and multiple child candles. Mother candle will cover whole child candles ( child candles have high and low within mother candle)
This script will highlight Inside Bars
How to use :
When we analyze market structure, we can combine mother candle and children candles and see them as a candle.
This script will help us do this easily.

Engulfing Candles AlertThis is a Engulfing Candle Indicator with Alerts.
This is not like any other Engulfing candle indicator present on TV. There are some special rules that are being used to identify specific engulfing candles.
Also, the user can choose if they like nice body engulfing or they want to ignore them.
The indicator have the following highlights:
1) Ability to choose the color of the engulfing candle body.
2) Ability to choose a different color for the Liq (liquidity) swap engulfing candle body.
Bullish Engulfing after Liq Swap
Bearish Engulfing after Liq Swap
3) With above 2 options, you can get the desired information without plotting any extra information on the chart.
4) You can put the alerts for getting notified when these patterns forms on the chart.
5) Ability to choose between getting notified or not on the chart if the engulfing candle body is less than 40% of the whole candle size. This is useful in order to identify if the engulfing is really powerful or not.
After selecting the option to ignore such engulfing
6) Ability to choose between getting notified or not on the chart if the engulfed candle body is really small. This is in particular useful for avoiding the engulfing of Doji which in turn might not be that powerful.
After selecting the option to ignore such engulfing
We will keep on making the improvements/Enhancements over the time (Check the changelog for such features)
NOTE: The indicator is of best use if you have a defined & back tested strategy which relies on this type of candlestick pattern.