Bearish Engulfing AlertThis is a Bearish Engulfing Candle Indicator with Alerts.
This is not like any other Bearish Engulfing candle indicator present on TV. There are some special rules that are being used to identify specific engulfing candles.
Also, the user can choose if they like nice body engulfing or they want to ignore them.
The indicator have the following highlights:
1) Ability to choose the color of the engulfing candle body.
2) Ability to choose a different color for the Liq (liquidity) swap engulfing candle body.
3) With above 2 options, you can get the desired information without plotting any extra information on the chart.
4) You can put the alerts for getting notified when these patterns forms on the chart.
5) Ability to choose between getting notified or not on the chart if the engulfing candle body is less than 40% of the whole candle size. This is useful in order to identify if the engulfing is really powerful or not.
6) Ability to choose between getting notified or not on the chart if the engulfed candle body is really small. This is in particular useful for avoiding the engulfing of Doji which in turn might not be that powerful.
We will keep on making the improvements/Enhancements over the time (Check the changelog for such features)
NOTE: The indicator is of best use if you have a defined & back tested strategy which relies on this type of candlestick pattern.
Candlestick Analysis

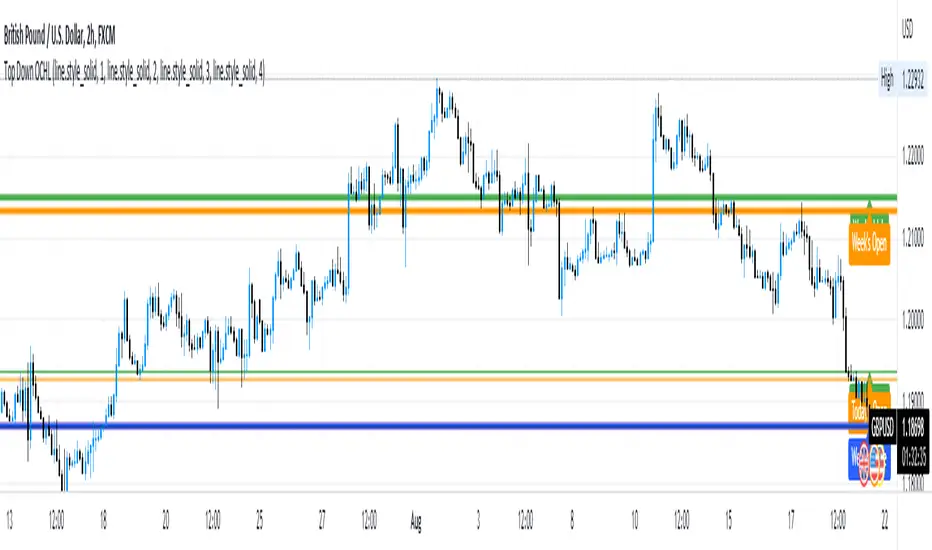
Opens, Closes, Highs and Lows.Hello Traders, the script below is designed to display the monthly, weekly, previous days' and current days' open, close, high and low.
I designed it to assist in top down analysis by knowing the monthly and weekly opens and closes it makes it a lot easier to make trading decisions on the lower timeframes.
As the user you can choose which price values you'd like displayed on the chart by selecting them in the user inputs.
Enjoy!!
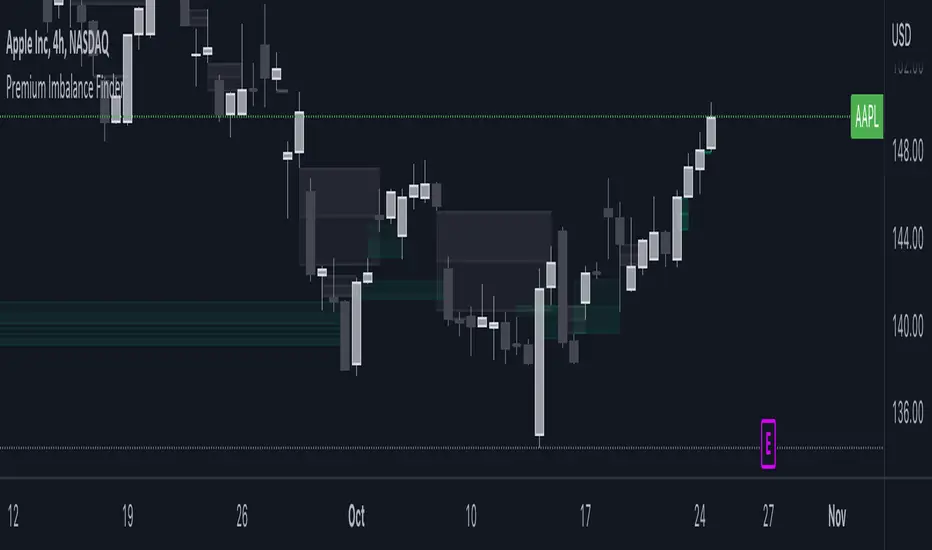
Sonarlab - MTF Imbalance/ FVGAn imbalance is created when the order block creates such impulsive volume in the market that it throws off the equilibrium between buyers and sellers, forming a gap. This is referred to as imbalance or FVG. These gaps act as a magnet for price to retrace to, in order to correct the disturbance in market equilibrium.
Imbalances = FVG
This image above shows you how an imbalance is created in the market using 3 candles. As we all know, candle sticks represent a specific time-range - for example: 1H. This means that inside 1 candle stick, there are 60 1 minute candle sticks resting. What I'm trying to say with this is that you get a totally different picture when you are on the lower timeframes. An imbalance can be overlooked, so it can be very helpful to have the multiple timeframe Imbalances on your screen, so you understand what is actually going on in the bigger picture.
Usage
Focused on combining with SMC:
When trading SMC, Imbalances can be great for POI's (point of interests) or using as targets in the market. Imbalances work like magnets in the market. When the market is imbalanced, it mostly wants to balance those gaps and can sometimes react perfectly from the area's. Besides that, it can really give you an idea who is in control at that moment.
Here you can see an example of an Imbalance when on the 1H timeframe - in the next picture below you can see the exact same imbalance, but then on the 3M. Now you understand why it can be overlooked?
So, imbalances/ FVG's:
- Increase probability of certain Point of Interests
- Can be a sign of strong interest in price areas
- Can be used as targets
- Can be used as POI's
What makes this Imbalance indicator different?
The Sonarlab MTF Imbalance indicator makes it possible to show up to 3 higher timeframes, which makes it easier to do your analysis and spot these areas when trading.
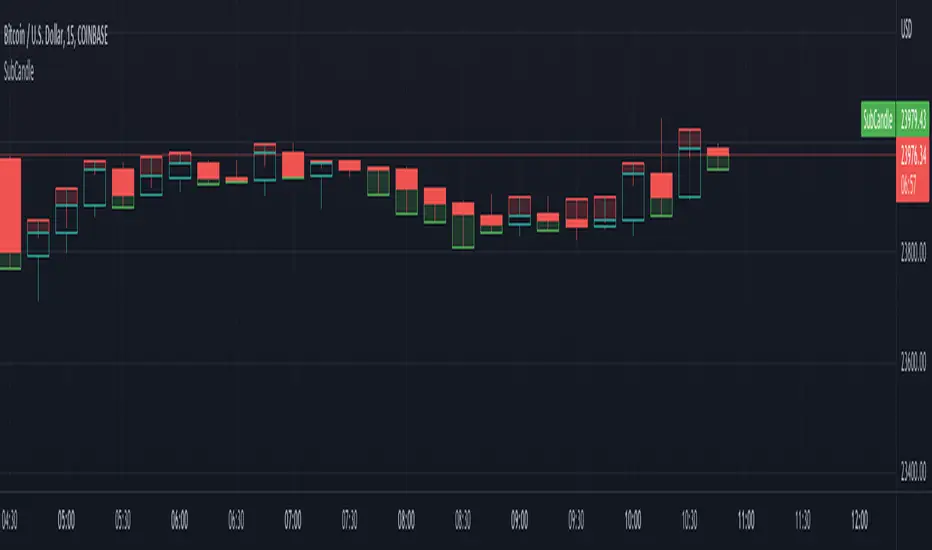
SubCandleI created this script as POC to handle specific cases where not having tick data on historical bars create repainting. Happy to share if this serves purpose for other coders.
What is the function of this script?
Script plots a sub-candle which is remainder of candle after forming the latest peak.
Higher body of Sub-candle refers to strong retracement of price from its latest peak. Color of the sub-candle defines the direction of retracement.
Higher wick of Sub-candle refers to higher push in the direction of original candle. Meaning, after price reaching its peak, price retraced but could not hold.
Here is a screenshot with explanation to visualise the concept:
Settings
There is only one setting which is number of backtest bars. Lower timeframe resolution which is used for calculating the Sub-candle uses this number to automatically calculate maximum possible lower timeframe so that all the required backtest windows are covered without having any issue.
We need to keep in mind that max available lower timeframe bars is 100,000. Hence, with 5000 backtest bars, lower timeframe resolution can be about 20 (100000/5000) times lesser than that of regular chart timeframe. We need to also keep in mind that minimum resolution available as part of security_lower_tf is 1 minute. Hence, it is not advisable to use this script for chart timeframes less than 15 mins.
Application
I have been facing this issue in pattern recognition scripts where patterns are formed using high/low prices but entry and targets are calculated based on the opposite side (low/high). It becomes tricky during extreme bars to identify entry conditions based on just the opposite peak because, the candle might have originated from it before identifying the pattern and might have never reached same peak after forming the pattern. Due to lack of tick data on historical bars, we cannot use close price to measure such conditions. This leads to repaint and few unexpected results. I am intending to use this method to overcome the issue up-to some extent.
Inside Bar SetupScript Details
- This script plots Inside Bar for given day in selected time-frame (applicable only for Timeframes < Day)
- Basis plotted inside bar, relevant targets are marked on the chart
- Targets can be customised from script settings. Example, if range of mother candle is 10 points, then T1 is 10 * x above/below mother candle and T2 is 10 * y above/below mother candle. This x & y are configured via script settings
How to use this script ?
- This script works well on 10-15 mins timeframe for stocks, 15/30 mins timeframe for nifty index and 30/60 mins time frame for bank nifty index
- If mother candle high is broken, take long trade with SL of mother candle low and if low is broken, take short trade with SL of mother candle high
Remember:
1. Above logic is to be combined with support/resistances i.e. price action. This script is an add-on to price action analysis giving you more conviction.
2. If range of mother candle is very high, it is recommended to avoid the trade.
3. Basis inside bar formed on higher time frame, take trade on basis of lower time frame i.e if inside bar is formed on 60 mins, take trade on the basis of 10-15 mins time frame
Example:
1. As seen in the chart, Nifty is near it's resistance and we are seeing Inside Bar being formed, In such scenario, even if High of Mother Candle is broken, we should be more interested to short as we are near resistance and probability of getting our targets in long side is less.
2. So, if I see breakdown of mother candle i.e. price going below low of mother candle, we will short with SL of high of mother candle.
3. As seen in the chart, both the targets are achieved.
Additional Info:
1. Targets on Long/Short Side can be configured via settings. For indices 1 times/1.5 times the range works well.
2. This script plots targets basis the first inside bar formed in the day for selected time frame.
3. Inside bars formed through out the day are coloured separately but lines are plotted only on the basis of 1st formed inside bar as this strategy works well for the first formed inside bar)
4. Don't forget to check volume in case of breakout/breakdown.
Note:
1. Mother Candle - First Candle of Inside Bar
2. Child Candle - Candle formed inside Mother Candle (Second Candle of Inside Bar)
Happy Trading :)

Heinkin-Ashi Shadow Candles// Public Domain
// By JollyWizard
// For overlaying Heikin Ashi candles over basic charts, or for use in it's own panel as an oscillator.
// Enjoy the visual cues of HA candles, without giving up price action awareness.
// Good for learning and comparison.

MTF Heikinashi BarOVERVIEW
This indicator shows whether Heikin Ashi is up or down, represented by a bar. This indicator is compatible with MTF.
CONCEPTS
What do you want to know about market analysis?
Do you want a hard analysis? You can look for it.
All I want to know is whether the commonly known technical analysis is 'UP' or 'DOWN'.
All I want to know is whether the current market price is going up or down. Not only for the current, but also for the monthly, weekly, and daily status.
I want to make a decision in a moment. Without even thinking about it.
That is why I created a color-coded bar indicator to show the status.
No need to frown anymore.
DETAILS
Heikin means average. Ashi means legs. In this case, it means a candle.
Close = (Close + Open + High + Low) / 4
For more information, click here.
tradingview.com
Heikin Ashi Up ⇒ green
Heikin Ashi Down ⇒ red

50% Strat RetracementThe purpose of this script is to show/alert you when there is a 50% Strat Reversal. It works very well to find possible 3 candles.
The arrows, and line can be turned on and off.
You can change the 50% to say 45% so that you will be alerted before it actually hits the 50% retracement.
The script will only alert if the reversal is a 2up red candle, a 2up green candle which will hopefully turn into a 3 candle.

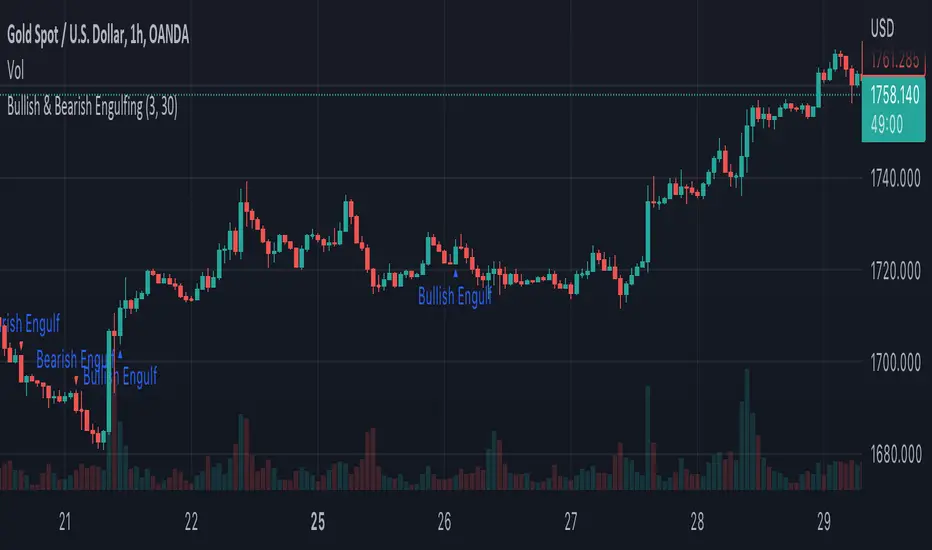
Bullish & Bearish EngulfingA simple script to filter out bullish and bearish engulfing candles. Size of candles can be filtered.
Engulfing Candle Marker (Full Candle)A simple indicator that marks FULL CANDLE engulfing candles...
current high > previous high
current low < previous low
bullish: close > open (triangle below)
bearish: close < open (triangle above)
A lot of the engulfing indicators available are body only. I created a FULL CANDLE indicator because that's what I prefer using.
Can be useful for spotting both reversal and continuation price action. Always have a complete trading plan and backtest it for yourself, engulfing candles in themselves to not guarantee a profit.
You are more powerful than you know...keep expanding!

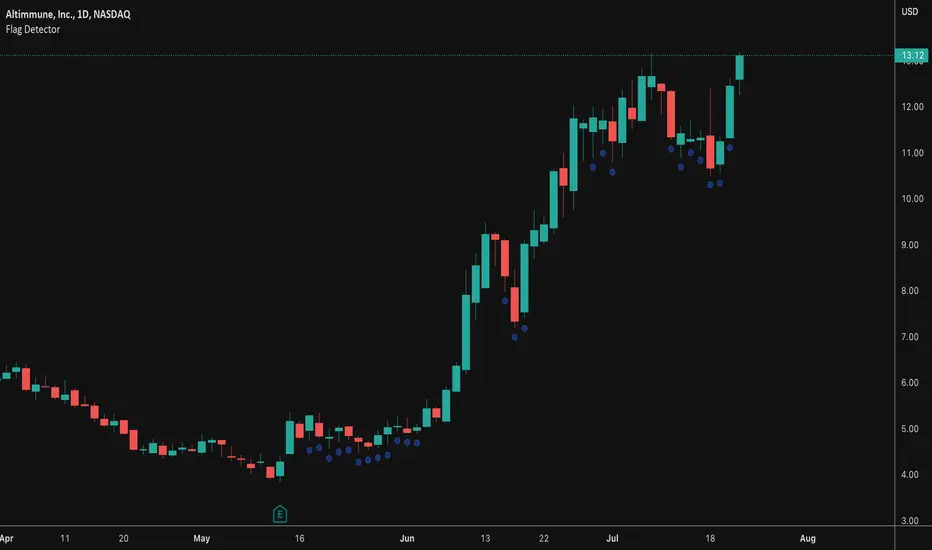
Flag DetectorThis script attempts to find consolidations or retracements within the context of a previous uptrend - basically looking for flag type patterns. It first measures an initial move (referred to as the flag pole in this script) and then looks for consolidation after that move within a certain range. If the consolidation is within the rage, it plots a dot under the candle to show you the consolidation areas. It's not fool proof, but seems to do a decent job of identifying pullbacks and sideways consolidations reasonably well.
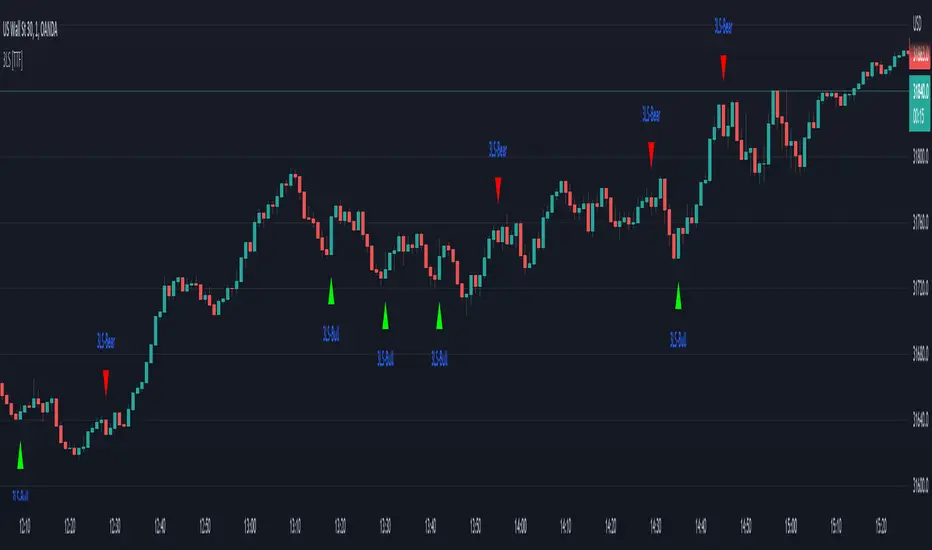
Watchlist Screening Hammer & Engulfing Strategies [By MUQWISHI]A trading strategy screener is an idea of a visual alert for those who're trading particular strategies and facing a lack of capability of monitoring many symbols simultaneously, so this kind of tool could be more efficient to keep managing trading plans smoothly and quickly. I developed this screener as an idea more than providing legend strategies.
This screener indicator performs scanning 4 different strategies with customizable 10 symbols inputs, and 5 min is the preferable timeframe.
Strategies
1. Hammer at Low of the day.
2. Shooting Star at High of the day.
3. Bull Engulfing at Low of the day.
4. Bear Engulfing at High of the day.
Screener Overview
Disclaimer
I'm an amateur, and I'm not a qualified licensed investment advisor.
I don't recommend the use of showing signals as a sole means of trading decisions.

3 Line Strike [TTF]This indicator is a spin-off of the popular TMA Overlay indicator made by request of the original author that narrows down the scope to simply identifying a couple of key candlestick patterns - Engulfing candles and 3 Line Strikes.
In addition to being a far more tailored and purpose-specific indicator, we have also update the indicator code to the latest version of Pinescript and added some enhanced alerts.
Candle Stick UpdateHeikin ashi chart so powerful that you can understand trend direction easily. But sometimes, this type of chart doesn't update properly and make no sense on real time. So I made this script. You can now change candle stick style default to heikin ashi (default / modified version) on the real time default chart without switching heikin ashi chart. Enjoy traders!!! And don't forget to press the like button :)

DB Trend Break FinderDB Trend Break Finder
What does the indicator do?
The DB Trend Break Finder indicator is designed to allow for easy visualization of price action trends and works on multiple timeframes (weekly+ recommended). The indicator is faily simple at it's core with background color changes for the following scenarios:
Lower Lows
Lower Highs (Lagging)
Higher Highs
Lower Lows & Higher High Combos (Lagging)
Higher Lows & Lower Highs Combos (Lagging)
How should this indicator be used?
The DB Trend Break Finder indicator should be used for an easy visual reference of the current price action in respect to the previous closing. It can be hopeful for quickly locating price trend changes and possible price action patterns.
Does the indicator include any alerts?
Yes, the script contains alerts for "Lower Low", "Lower High" and "Higher High" conditions. Please note the indicators should be used for alerts to price action changes for manual review and should not be used for robot trading. Some of the plotting is lagging and all of the plots repain in realtime.
Enjoy!

Dante Bullish/Bearish EngulfingBearish and Bullish engulfings as taught by Tom Dante Piccin. Different from other bullish/bearish engulfing indicators because other indicators only want the body of the current candle to engulf the previous body.
This indicator needs the low and high of the current candle to engulf the previous one and also in the example of a bullish engulfing close above the previous candle high or in a bearish engulfing example close below the low of the previous candle.

RSI In-Chart Indicator with Candle StickSimplified RSI with in Chart Indicator for better analysis, What is does? it simply plot OB/OS over candles for better understanding. Also you can on/of candle stick along side in setting but the RSI is always on.
Candle stick Patterns
Three White Soldier (TWS)
Three Black Crows (TBS)

Fake breakHi Traders,
I've developed an indicator which can detect fake-breaks on the chart.
In the following you'll find the definition of the fake break candles and also you will find how to recognize it on the chart with practical examples.
What is the fake break pattern?
Sometimes support and resistance lines broke with a full body and strong candles that gives us the idea of sharp movements on the chart but suddenly the next candle returns all the path of the previous candle. in this case we can say fake break is happening on the chart.
This indicator detect fake break patterns based on two criteria:
1. It uses AverageTrueRange indicator to measure the strength of the pattern.
2. The returning candle should engulf minimum 75% of the break candle.
This indicator plot 2 terms in the name of "FB-D" and "FB-U" that are abbreviations of the "Fake Break Down" and "Fake Break Up".
You can also set alerts to get notified when fake breakout happens on the chart.
Notice: This pattern is only acceptable in valid support and resistance zones and you can not rely on it everywhere on the chart (specially in the middle of the waves).
Notice: The source code of this indicator is open and you are allowed to use it on your scripts by mentioning the name of author.
Disclaimer: This is not a financial advice or any signal to buy or sell, the goal of developing such an indicator is to use for educational purposes.

PopGun Trading, PG Pattern DetectorPopGun Bar Pattern Strategy
PG Trading
The indicator does the following:
It detects the Outside Bar, the smaller inside Bar and the 3rd Pop Gun that is bigger, than the inside Bar.
When the Pop Gun was detected, the indicator will calculate 3 targets for long and short trades.
In our understanding, a Pop Gun is neutral. The next candles after the Pop Gun will decide if the PG breakout is bullish or bearish.
So if one of the next candles after the PG is breaking the high or low of the PG Candle, this is a breakout confirmation and can traded long or short.
We are using the PG Indicator for Stock, Futures and Index Trading.
The Script uses 3 targets per default, but you can extend the target dots up to 6.
If you want to see the targets in plain text, you can activate the PG Box.
The targets are calculated really easy: Just the height of the candle multiplied with 1, 2 and 3 (4,5 and 6 additionally). In some communities there is an ATR calculation for more extended targets but it seems, that the ATR Calculation will sometimes lead to unreachable targets if the ATR is really high intraday...
We trade PopGuns starting at M15 chart. I think PGs smaler than M15 are not worth a trade...
Maybe i will add the ATR Function in the future just to compare the 2 ways to calculate PG targets. We are really doing well with 1,2,3 targets based on the PG Candle size. (Low to High).
Please leave a comment if you have some feature requests or input to make this the best Pop Gun Indicator in Trading View ;-)

Doji FinderModified version of HPotter's "Doji and Near Doji automatic finding script".
Candles are classified based on not just the size of the body but also the distance from the close to the high/low. This avoids classifying a reversal candle with a long wick but a strong close as a doji.

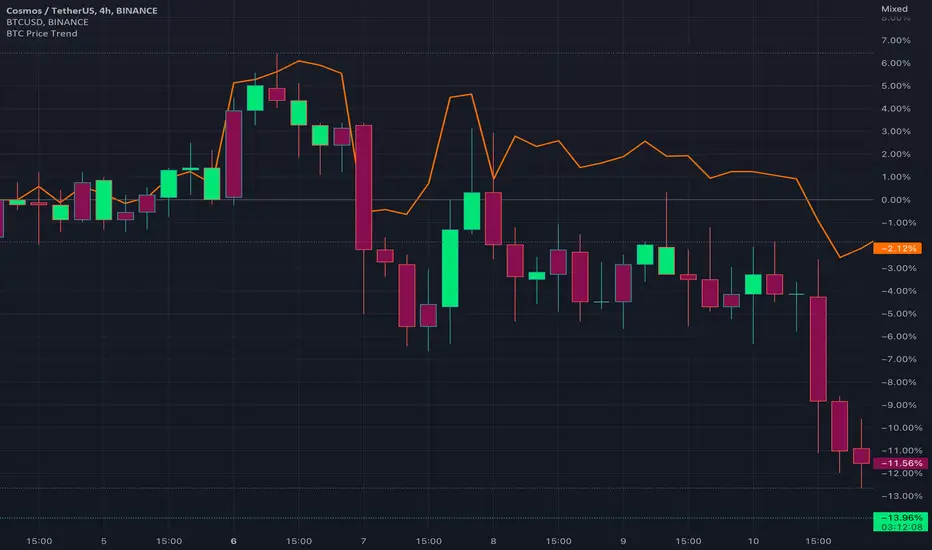
BTC Price TrendThe crypto market is reacting very quickly based on BTC price, thus monitoring the BTC price is very helpful.
This script will color the candles based on the BTC price trend. Set the timeframe and down/up percentage to monitor the BTC price trend, and the script should not repaint.
The indicator will monitor the BTC price in a high frame, for example, for 4 hours, if the price goes down the set percentage during one candle, will change the candle color. Thereafter, if the price goes up within a small timeframe (as you set) then the candle color will be changed.
So, in case the bar color is red, then it is recommended to avoid trading since the BTC price is down trending.
The indicator is requesting the BTC price as of now, and the previous closed price, then it will calculate the price difference, if it result is minus, then the price is in a downtrend, else it is in an uptrend.
Better Heiken-Ashi Candles w/ Expanded Source Types [Loxx]Better Heiken-Ashi Candles w/ Expanded Source Types is an indicator to compare regular candles to traditional Heiken-Ashi candles to "better" Heiken Ashi candles. This indicator and comparison study appears an oscillator. The purpose of this indicator is to demonstrate a better way to calculate HA candles and also to demonstrate expanded source types. This indicator is meant to be used by advanced Pine Coders who wish to add fine-tuning to their indicators and strategies.
What are Heiken Ashi "better" candles?
The "better formula" was proposed in an article/memo by BNP-Paribas (In Warrants & Zertifikate, No. 8, August 2004 (a monthly German magazine published by BNP Paribas, Frankfurt), there is an article by Sebastian Schmidt about further development (smoothing) of Heikin-Ashi chart.)
They proposed to use the following :
(Open+Close)/2+(((Close-Open)/(High-Low))*ABS((Close-Open)/2))
instead of using :
haClose = (O+H+L+C)/4
According to that document the HA representation using their proposed formula is better than the traditional formula.
What are traditional Heiken-Ashi candles?
The Heikin-Ashi technique averages price data to create a Japanese candlestick chart that filters out market noise.
Heikin-Ashi charts, developed by Munehisa Homma in the 1700s, share some characteristics with standard candlestick charts but differ based on the values used to create each candle. Instead of using the open, high, low, and close like standard candlestick charts, the Heikin-Ashi technique uses a modified formula based on two-period averages. This gives the chart a smoother appearance, making it easier to spots trends and reversals, but also obscures gaps and some price data.
What's going on with this indicator?
- First, we have the options to select the candlestick type: Regular, HA, HA Better
- Next, and to demonstrate the expanded source types, I've added a simple moving average. In the drop down for the SMA source you'll notice something very different from the typical TradingView source selector. Here's how to decode the new names for the sources:
Close = close
Open = open
High = high
Low = low
Median = hl2
Typical = hlc3
Weighted = hlcc4
Average = ohlc4
Average Median Body = (open+close)/2
Trend Biased = (see code, too complex to explain here)
Trend Biased (extreme) = (see code, too complex to explain here)
... for HA and HA better, see the same set up as above but with different open and close values to calcualate the other source types
- For the HA better calculations, we run the close value through either an Adaptive, Kaufman, or T3 smoothing filter. The length for these smoothing filters, either 2 or 3, can be found in the code and is a constant value that shouldn't be changed. This smoothing is in inline with what is described in the article mentioned above
- Lastly, I've placed an SMA over the oscillator so that the user can test out the various sources explained above
Included:
- Toggle on/off bar coloring

Neo's Divergence FractalsDivergence Fractals combine divergence candlestick patterns with concepts pioneered by Bill Williams and George Lane to create a precise trend following tool that responds very well to the FX market. This indicator is built off of my Neo Fractal data set, which unlike traditional Williams fractals, track highest and lowest closes instead of higher highs and lower lows. Through my own research, I've found Neo Fractals to be a much more accurate way of pinpointing %K and RSI extremes than Williams fractals, especially in scenarios where markets make higher highs or lower lows, but fail to close higher or lower. This can lead to false divergence signals because the stochastic and RSI values aren't referenced at their highest or lowest point.
If divergence is detected between the previous close and the closest fractal above or below the close, the script then waits for a close above (bullish), or below (bearish) the close where divergence was present, at which point, an up (bullish) or down (bearish) fractal will appear on the chart. Divergence signals followed by engulfing candles are also colored, so they're easy to spot. These are the highest quality reversal or in some cases trend continuation signals! Divergence Fractals can be a great entry tool, but can also be great for managing and closing active trades as well. This indicator was designed to work in tandem with my %K as well as my proprietary Lucky7 indicator, mainly on the 1HR chart.
