Kz GC1! ORBStrategy that trades breakouts on GC1! futures on the 5min timeframe. It also works on MGC1! for lower drawdown and to manage Apex and Top Step accounts with the lower risk.
Risk Disclaimer:
Past results as well as strategy tester reports do not indicate future performance. Guarantees do not exist in trading. By using this strategy you risk losing all your money.
Important:
It trades all days that markets are open. Set times may be seen on settings. Trades multiple times a day sometimes.
It works on the 5 and 15min timeframe only. Results are better on 5min timeframe.
The settings are optimized already for GC1! on the 5min timeframe.
How it works:
Every trading day it measures the range of the first 15min candle of pre-selected hours. As soon as price closes above or below on the 15min timeframe, it will trade the breakout targeting a set risk to reward ratio. SL on the opposite side of the range.
Settings:
Hourly Trading Hours: These are the times that worked best for this strategy. All boxes should be checked for best results. Excluded times were when it performed bad which is why those times have been left out.
ORB Formation Period: This setting determines on which timeframe candle has to close outside the opening range box in order to take a trade. It's set to 15min by default because this is what worked by far the best
Entry Type: Entries are immediate instead of waiting for a pull back to enter on a limit order.
Limit Orders: If enabled, the strategy will place a pending order x points from the current price, instead of a market order. Immediate orders are enabled by default for a better performance. Important: It doesn't actually place a limit order. The strategy will just wait for a pullback and then enter with a market order. It's more like a hidden limit order.
Limit Order Offset Points: If you have limit orders enabled, this setting determines how many points from the current price the limit order will be placed.
FVG Detection Type: How fast it detects the fair value gaps. Standard detection over immediate had better performance
Risk Type: You can chose either between Fixed USD Amount, Risk per Trade in % or Fixed Contract Size. By default it's set to fixed contract size.
Risk Amount (USD or Contracts): This setting is to set how many USD or how many contracts you want to risk per trade. Make sure to check which risk type you have selected before you choose the risk amount.
Take Profit Multiplier: This is simply the total SL size in points multiplied by x.
Example: If you put 2, you get a 2:1 Risk to Reward Ratio. By Default it's set to 2.5 because this gave the best results in backtests.
Stop Loss Padding: This is simply the buffer in points that is added to the SL for safety reasons. If you have it on 0, the SL will be at the exact price of the opposite side of the range. By default it's set to 5 because this is what delivered the best results in backtests.
Stop Loss Placement: This determines where the stop loss gets placed for the order. It has been set to ORB Range by default as this delivered the best results.
Max Trades Per Hour: This allows the user to decide how many trades are taken an hour. 1 is been set to default for best results
Visual Settings: Check boxes to show orb range, FVG's, Entry points, and trade visualization boxes.
Backtest Settings:
For the backtest the commissions were set to 1.29USD per contract and .35USD for micros which is the highest amount Tradovate charges Margin was not accounted for because typically on prop accounts you can use way more contracts than you need for the extremely low max drawdown. Margin would be important on personal accounts but even there typically it's not an issue at all especially because this strategy runs on the 15min timeframe so it won't use a lot of contracts anyways.
Why the source code is hidden:
The source code is hidden because I invested a lot of time and money into developing this strategy and optimizing it with paid 3rd party software.
Candlestick analysis

SMC Strategy with RSI/OB at Market PriceTakes trade using smc with rsi confirmation
Buy Signal Triggers When:
Scenario 1 (Immediate Touch): Price touches/enters bullish OB boundaries AND previous candle closed with RSI ≤ 35
Scenario 2 (Close Inside): Current candle closes inside bullish OB AND current RSI ≤ 35
Sell Signal Triggers When:
Scenario 1 (Immediate Touch): Price touches/enters bearish OB boundaries AND previous candle closed with RSI ≥ 65
Scenario 2 (Close Inside): Current candle closes inside bearish OB AND current RSI ≥ 65
TPFX - Unified Strategy v8.1 (COT + Valuation + S/D + Seasonal)
TPFX - Unified Strategy v8.1: A 5-in-1 Confluence Model
The TPFX Unified Strategy is a comprehensive trading model that integrates five distinct market analysis modules into a single indicator. Its primary function is to generate high-confluence entry and exit signals by requiring validation across multiple layers of market analysis. This approach aims to minimize noise and focus trading activity on moments of strong directional agreement.
Core Analytical Modules:
1. COT Index (Commitment of Traders): Quantifies the relative extreme positioning of major market participants (Commercials, Large Speculators) over a user-defined lookback period to identify overextended sentiment.
2. COT Momentum: Utilizes Commercial net positioning to detect momentum shifts, based on either a new high/low logic or a Moving Average crossover.
3. Valuation Trigger: Compares the relative performance of the current symbol against a reference asset (e.g., DXY) to determine periods of comparative overvaluation or undervaluation.
4. Supply and Demand (S/D) Zones: Automatically identifies and plots institutional S/D zones based on specific candle patterns. These zones provide precise entry, stop-loss, and dynamic take-profit targets upon activation and retest.
5. Seasonal Filter: Applies a calendar-based constraint to limit trade entry to historically favorable or unfavorable periods for the specific asset.
Key Strategy Features:
* Modular Control: All five modules can be independently enabled or disabled via input settings, allowing the user to customize the required confluence level for signal generation.
* Flexible Exit Management: The strategy supports four primary exit methodologies:
* Fixed TP/SL: Standard point or percentage-based risk management.
* Dynamic (S/D Zones): Uses the S/D zone boundaries for stop-loss and either a fixed R:R ratio or the nearest opposite zone for take-profit.
* Opposite Signal: Closes a position when a full, confirmed signal in the opposite direction is generated.
* Mean Reversion: Closes the position when the COT Index or Valuation Line reverts to a defined mean level.
* Risk Parameters: Includes configurable order size, trade direction filtering (Long, Short, Both), and adjustable parameters for S/D zone detection logic.
v8.1 Update: This version features a syntax correction within the Supply/Demand Zones calculation block to ensure reliable zone detection and trigger logic.
This tool is designed for systematic traders seeking to align their decisions with fundamental flows and order book imbalances.
(Note: Full functionality relies on access to the Commitment of Traders data feed, which may require a subscription.)

高频策略优化版-空头Open Condition Reversal: Change the condition of the TEMA fast line above the slow line to the condition of the fast line below the slow line RSI condition from " buy above the threshold " to " short below the threshold ", and adjust the default threshold from 30 to 70 (more suitable for shorting overbought area) moving average direction judgment from up to down stop-loss direction adjustment: Short stop-loss Settings above the entry price (entry price * (1 + i _ sl) ) Short stop-loss set below the entry price (entry price * (1-tp) Tracking stop-loss level adjusted to below the entry price MACD logic adjustment: Preferred use of the bearish pattern as a short signal bullish pattern for closing risk management: Maintained a dynamic stop-loss mechanism, adjusted to protect the market from the bottom of the visual stop-loss strategy: The visual marking of the ACD energy column is convenient for monitoring signals to be fully tested before use, especially for adjusting RSI thresholds and stop-loss parameters to suit the characteristics of specific trading varieties.

SMC 自動交易 - 4HR- BTC適用# SMC Automated Trading Strategy Whitepaper - Stepped Enhanced Edition
## 1. Strategy Overview
This strategy is designed based on the Smart Money Concept (SMC), integrating Order Block (OB), Change of Character (CHoCH), and strict pullback confirmation conditions. The goal is to enhance trading accuracy and strictly control risk, specifically tailored for trading competitions, meeting the requirements of stability and efficiency.
### Core Strategy Concepts:
- Precise identification of key trend reversal points.
- Strict pullback confirmation to avoid chasing tops or bottoms.
- Clear risk management and take-profit mechanisms to maintain stable risk-reward ratio.
- Supports trading time filtering (Kill Zone) to capture prime volatility windows.
- Multiple visual aids for quick in-trade signal recognition.
## 2. Strategy Logic Flow
### 1. Kill Zone (Optional Activation)
- Default trading time: Taiwan time 15:00 - 18:00.
- Purpose: Focus on high-volatility periods to reduce false signals in choppy markets.
### 2. Order Block Detection
- Current candle range exceeds the previous candle by a specified multiplier (default 0.8).
- Bullish OB: Bullish candle with expanded range.
- Bearish OB: Bearish candle with expanded range.
- Flexible OB sensitivity adjustment according to market volatility.
### 3. Change of Character (CHoCH)
- Initial trend reversal confirmation:
- Bullish CHoCH: Close above previous candle’s high.
- Bearish CHoCH: Close below previous candle’s low.
### 4. Pullback Confirmation (Core Condition)
- Avoid premature entries by requiring a pullback to the prior OB:
- Long: Pullback touches the previous Bullish OB high.
- Short: Pullback touches the previous Bearish OB low.
### 5. Fair Value Gap (FVG) Detection (Optional)
- Detect price imbalances as additional confirmation signals.
## 3. Entry Logic
### Long Position:
- Previous Bullish OB is formed.
- Current candle completes a pullback to the prior OB high.
- Current candle closes above the previous high (CHoCH confirmation).
- (Optional) Within Kill Zone.
### Short Position:
- Previous Bearish OB is formed.
- Current candle completes a pullback to the prior OB low.
- Current candle closes below the previous low (CHoCH confirmation).
- (Optional) Within Kill Zone.
## 4. Risk Management & Exit Strategy
### Stop Loss:
- Long: Current candle’s low minus buffer points (default 50 points).
- Short: Current candle’s high plus buffer points (default 50 points).
### Take Profit:
- Default Risk-Reward Ratio (RR): 2.0 (customizable).
- Automatically calculates target take-profit level.
### Full Automation:
- This is a fully automated strategy. Orders are placed automatically upon conditions being met, requiring no manual intervention.
## 5. Visual Aids
- Bullish OB: Green upward triangle.
- Bearish OB: Red downward triangle.
- Bullish CHoCH: Blue circle.
- Bearish CHoCH: Orange circle.
- FVG: Highlighted zones (optional).
> **Advantage:** Quick market status recognition during trades, improving strategy transparency.
## 6. Strategy Advantages
✅ Dual trend reversal confirmation: OB + CHoCH.
✅ Strict pullback requirement to reduce false breakouts.
✅ Clear risk control and stable risk-reward ratio.
✅ Visual aids + time filter for clear in-trade decisions.
✅ Fully automated trading reduces human error.
## 7. Application Scenarios
- Trading competitions: Designed for high win-rate and strict risk control.
- FTMO and similar evaluation challenges.
- Intraday or swing trading strategy frameworks.
- High-volatility assets: Crypto / Forex / Index CFDs.
## 8. Risk Warning
- Strategy is based on historical backtesting; live trading should consider slippage and liquidity risks.
- During high volatility periods, use proper money management tools and strictly execute stop losses.
## 9. Version Note
Version: Stepped Enhanced Edition (Updated April 2025)
Developer: natwad3000

AstraAlgo BacktesterOVERVIEW
The AstraAlgo Backtester allows traders to simulate and evaluate trading strategies directly on TradingView. By simulating trades across different timeframes and markets, it provides valuable insights into win rates, drawdowns, and overall strategy effectiveness.
SIGNAL MODES
Signal Modes generate proprietary trade signals based on live price data. Users can choose between Off, Basic, Advanced, or Custom modes to evaluate strategies under different conditions and refine their trading approach.
ADJUSTABLE BACKTESTING
Parameters for historical simulations can be customized to test different market conditions and trading scenarios. This allows traders to measure strategy performance, including win rate, profit/loss, and risk/reward ratios, helping refine and optimize strategies before live execution.
BAR COLORING
Bar Coloring highlights bullish and bearish bars on historical charts, allowing traders to visually assess trend direction and trade outcomes during backtesting. This makes it easier to analyze momentum and strategy effectiveness at a glance.
ASTRA CLOUD
Astra Cloud overlays dynamic support and resistance levels on live price data. These zones adapt automatically to past market movements, helping traders identify areas where trades would have reacted, aiding strategy evaluation and optimization.

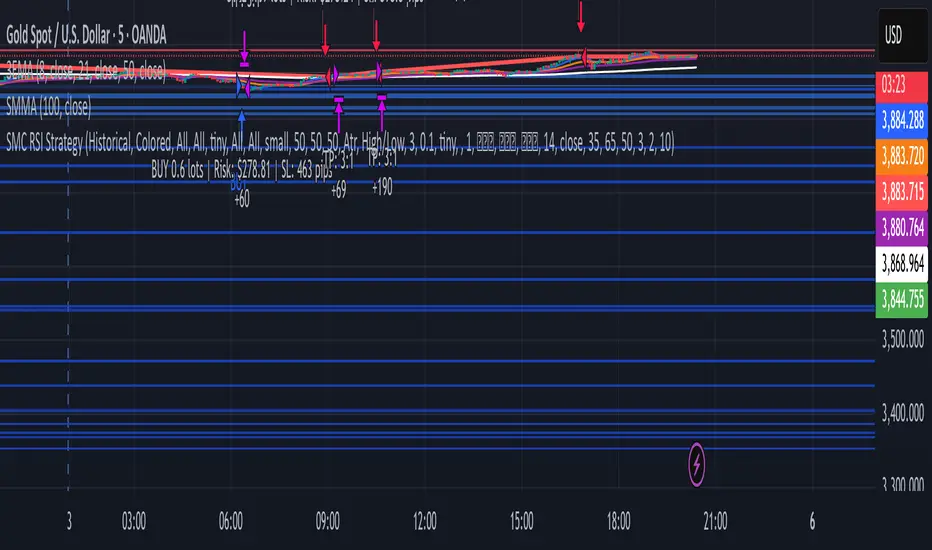
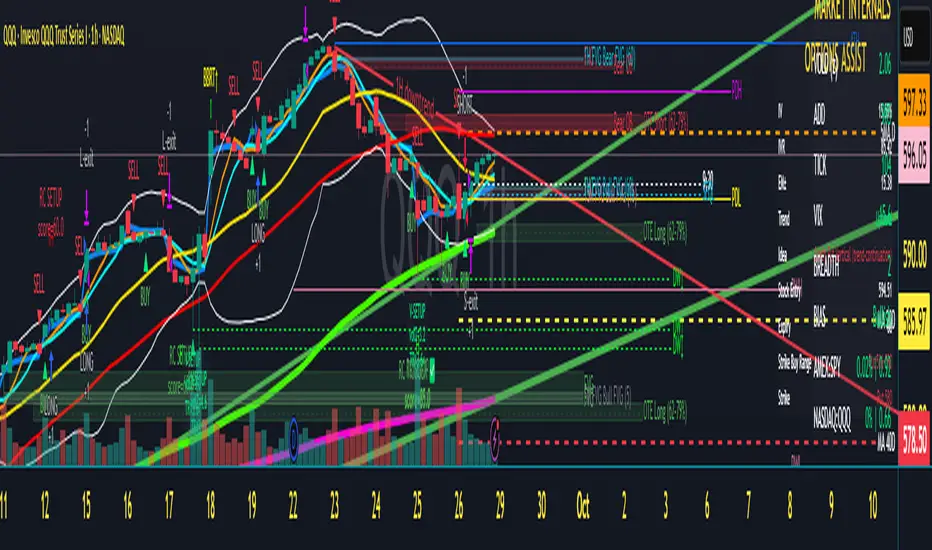
Scalper's Dream by Chino,CHINO’S ICT MES/MNQ Strategy — FVG/BOS/OTE/PD + VWAP + SMA + BB Squeeze/Failure
Summary
Intraday ICT-inspired toolkit tuned for MES/MNQ (also effective on equities/ETFs and crypto). It blends Fair Value Gaps (FVG) — including multi-timeframe FVG (MTF FVG) with first-touch and min-gap filters — Break of Structure (BOS), Optimal Trade Entry (OTE), and Prior-Day levels with VWAP, SMA gates, 9:30 Open, Session Equilibrium (EQ), custom ORB, and Key Rejection Levels (KRL). It also includes Accumulation/Distribution phase reads and Manipulation cues (e.g., liquidity sweeps/stop-runs) to contextualize trend transitions. On top, it adds Bollinger Band squeeze breakouts & failure reversals, V/A shape reversal detectors, Volume-boosted buy/sell signals with Reversal Candle Assist, Asia/London/New York sessions, an Options Assist HUD, and a Market Internals HUD.
Disclaimer: This tool is for education and research purposes only and is not financial advice. Test thoroughly in replay/paper before live trading.
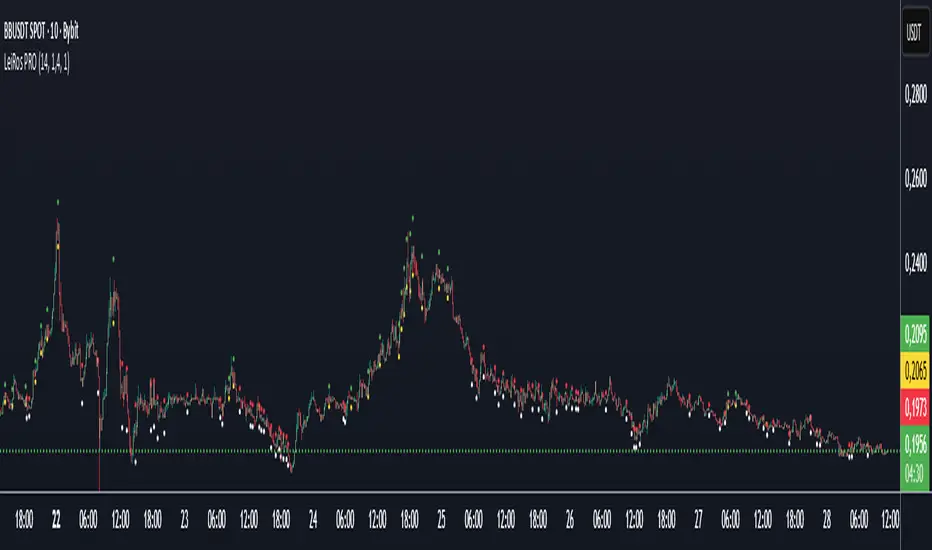
LeiRos PRO — Smart Entry & Target System⚡ Short Description
LeiRos PRO is more than an indicator.
It is an intelligent next-generation analytical tool designed to visualize the true trajectory of market movement.
It reveals the hidden mechanics of price — the attraction points where liquidity is collected and extremes are updated before reversal.
🟢 During bullish phases, the market often reaches for previous highs.
Green points of LeiRos PRO highlight the levels price is most likely to reach before completing the impulse.
⚪ In bearish phases, the market tends to sweep uncollected lows.
White points indicate where stop hunts and local reversals commonly occur.
Built upon the interaction of EMA20 / EMA50 / EMA200, volatility analysis and momentum strength,
LeiRos PRO doesn’t just mark levels — it displays realistic targets price is drawn to with high probability.
📈 The higher the timeframe, the clearer and more stable the picture becomes.
On H1 and above, the plotted points act as reference zones for those seeking structured, logical price behavior rather than noise.
💡 The main advantage of LeiRos PRO is clarity — it removes guessing.
You see where price tends to move and where impulses are likely to end.
This is not theory — it’s market behavior visualized.
📘 Full Description
LeiRos PRO is a proprietary analytical tool created to precisely visualize directional bias, target zones, and protective stop areas.
It combines trend structure, volatility, and price action logic — helping traders see the key areas where the market’s intent becomes clear.
📈 Core Features:
Automatic trend detection: analyzes direction using EMA20, EMA50, and EMA200 to define the dominant side of the market.
Target visualization (Take-Profit): marks potential liquidity-grab zones where price often completes its move.
Protective stop zones (Stop-Loss): highlights areas where logical stops can be placed based on current structure.
Adaptive to timeframe: higher timeframes provide cleaner and more reliable reference points, suitable for short-, medium-, and long-term analysis.
⚙️ Recommended Use:
As a visual analytical tool for confirming trade direction.
On lower TFs — for identifying intraday entry points and potential objectives.
On higher TFs (H1 and above) — for building overall market context and defining major targets.
Marked points are not entry signals,
but contextual reference zones showing potential areas of liquidity collection or impulse completion.
⚠️ Disclaimer:
LeiRos PRO is an analytical and visualization tool, not a trading signal or guarantee of results.
All trading decisions, entries, exits, and risk management remain solely the responsibility of the user.
✳️ Note:
This indicator is part of the LeiRos Project, which develops intelligent systems for advanced market analysis and visualization.
Displayed levels adapt dynamically to volatility and timeframe, providing a flexible view of current market structure.
Elliott Wave Auto + Fib Targets + Scalper Strategy (Fixed)// Elliott Wave Auto + Fib Targets + Scalper Strategy
//
// Fixed by expert trader:
// - Replaced table with label-based visualization to avoid 'Column 2 is out of table bounds' error.
// - Uses label.new to display buy/sell signal counts in top-right corner, mimicking table layout.
// - Fixed array.sum() error: Replaced invalid range-based array.sum() with custom sum_array_range() function.
// - Removed barstate usage to fix 'Undeclared identifier barstate' error.
// - Replaced barstate.isconfirmed with true (process every bar).
// - Replaced barstate.isfirstconfirmed with bar_index == 0 (first bar).
// - Replaced strategy.alert with label.new for long/short entry signals (buy/sell markers).
// - Fixed array index out-of-bounds: Protected array.get() calls with size checks.
// - Fixed pyramiding: Set constant pyramiding=4 (max 5 entries); use allow_pyramiding to limit entries.
// - Fixed default_qty_value: Set constant default_qty_value=100.0; use entry_size_pct to scale qty.
// - Replaced alertcondition with labels for Elliott Wave patterns.
// - Fixed partial exits: 50% at TP1 with fixed SL, 50% at TP2 with fixed SL or trailing.
// - Fixed Elliott Wave pivot indexing for alternating H/L check.
// - Ensured proper position sizing and exit logic.
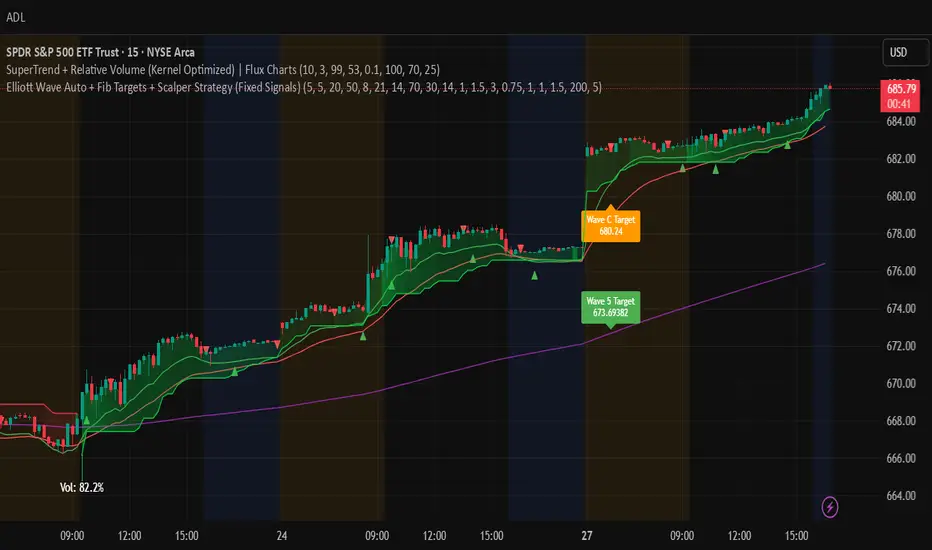
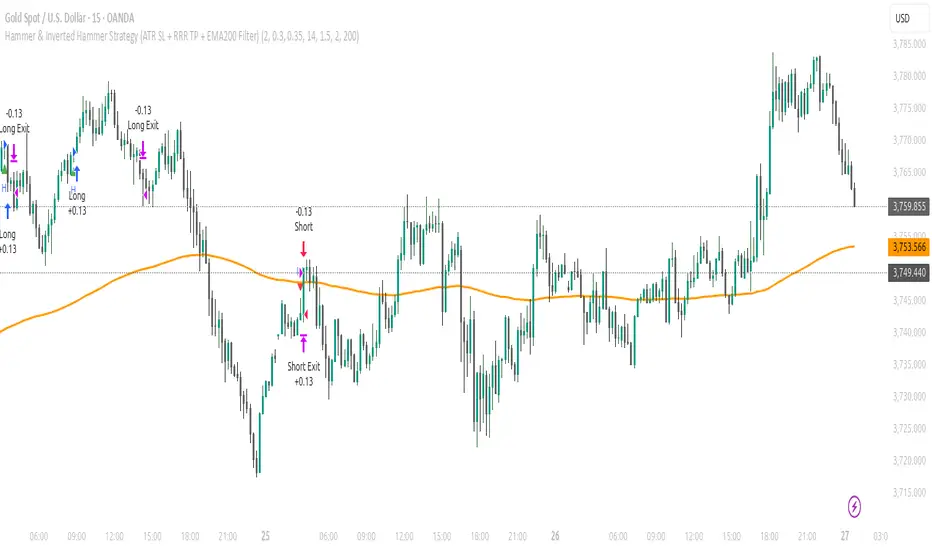
Alain parfHammer signals only valid for longs above EMA200.
Inverted hammer signals only valid for shorts below EMA200.
EMA200 is plotted as an orange line.

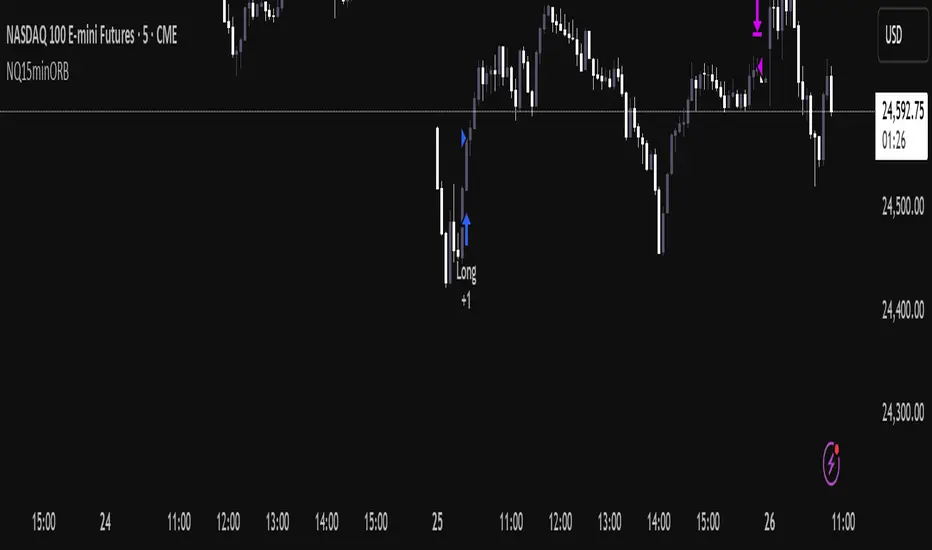
NQ Opening Range BreakoutOpening Range Breakout script with:
Customizable opening range timeframe selection.
Inputs for Risk to Reward ratio, EMAs, Vwap, and ATR sizing to avoid ranges that are too big or too small.
Features a toggle for reversal trades that when enabled will trade the other direction if the initial ORB gets stopped out.
Default it will use the entire opening range to determine stop loss and take profit and if neither the take profit or stop loss is hit it will end the trade at 16:00. There are toggles to use half the opening range as the stop loss and take profit will then be calculated as risk reward ratio * stop loss or you can select entry candle stop loss and risk reward ratio which places the stop loss at the entry candles opening price. There is also a take profit option that will only exit the trade when price closes below (for longs) or above (for shorts) a customizable ema length.
Note that if you have the opening range, for example, selected as 9:30 - 9:45 and are on a 5 minute chart it will enter on the first 5 min closure outside of that range and if you are on a 15 minute chart it will enter on the first 15 min closure outside of that range and so on.
You can automate the entries and exits by using a webhook service and using the strategy’s alerts.
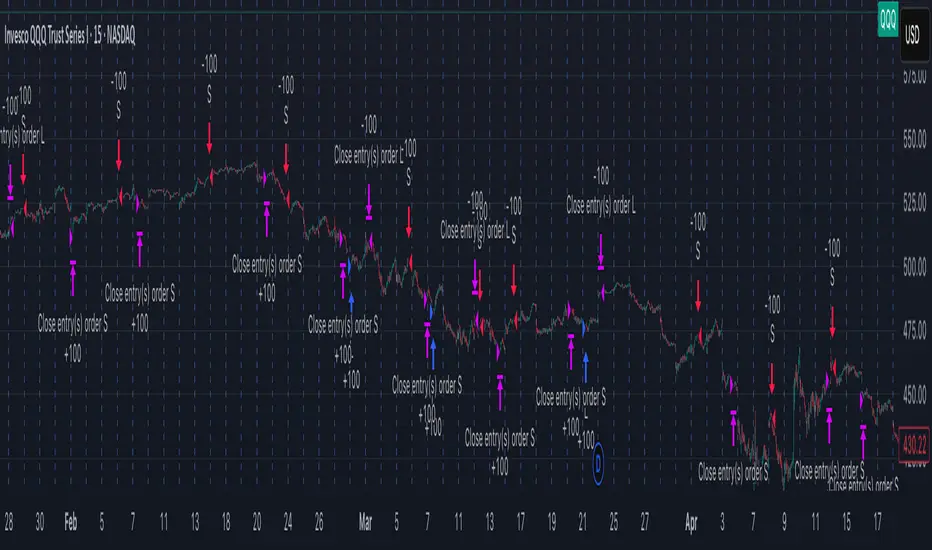
Liquidity+FVG+OB Strategy (v6)How the strategy works (summary)
Entry Long when a Bullish FVG is detected (optionally requires a recent Bullish OB).
Entry Short when a Bearish FVG is detected (optionally requires a recent Bearish OB).
Stop Loss and Take Profit are placed using ATR multiples (configurable).
Position sizing is fixed contract/lot size (configurable).
You can require OB confirmation (within ob_confirm_window bars).
Alerts still exist and visuals are preserved.

Scalping Strategy: FVG + Engulfing
This is a scalping strategy based on the Fair Value Gap (FVG) and Engulfing pattern confirmation. It identifies the high and low of the first 5-minute candle after the 9:30 AM EST market open and waits for a breakout supported by a Fair Value Gap. A trade is only triggered after a retest of the FVG zone followed by an engulfing candle in the direction of the breakout. Trades are entered with a fixed 3:1 risk-to-reward ratio and limited to 2 entries per trading day to avoid overtrading. Ideal for NASDAQ scalping on a 1-minute chart.

Composite PR Signal (Trend↔Revert + ADX gate)Core Components
1. Dynamic Inputs
Max/PR windows (maxLen, prWin) – define historical lookbacks for oscillators and percentile ranks.
Smoothing (smooth) – applies an EMA filter to stabilize composite scores.
Threshold (th) – governs entry sensitivity.
Holding period (hBars) – maximum bars allowed in a trade.
Execution options – allow shorting, fast approximations for PR and CCI.
2. Custom Utility Functions
The script implements optimized versions of common TA operations:
Rolling sums, delays, and moving averages (EMA, RMA, SMA).
Lazy rolling extrema (efficient highest/lowest lookups).
Stateful arrays for tracking oscillator values across bars.
Fast approximations for percentile ranks and indicators.
3. Indicators Used
The system calculates a broad set of oscillators, including:
Trend/Momentum: ROC, TRIX, TSI, MACD histogram, OBV ROC, AO, CMF, BOP, UO, ADX.
Reversion/Oscillators: RSI, Stochastic K/D, MFI, Williams %R, CCI, CMO.
Each is converted into a percentile rank (PR) to normalize values between 0–100.
4. Composite Scoring
Two composite signals are built:
Trend Score – averages normalized outputs of momentum indicators.
Reversion Score – averages normalized outputs of oscillators prone to mean reversion.
ADX Gate – when ADX PR is high, the strategy favors trend score; when low, it favors reversion score.
Final score is smoothed and compared against entry thresholds.
5. Trade Logic
Entry:
Long: When composite score crosses above +th.
Short: When composite score crosses below -th (if enabled).
Exit:
Opposite crossover signal.
Or trade duration exceeds hBars.
6. Risk/Execution Parameters
Initial capital: 100,000
Commission: 0.01% per trade
Fixed order size: 100 units
No pyramiding
Intended Use
This script is designed for:
Swing trading across multiple assets (equities, forex, crypto).
Adapting to market regimes — capturing breakouts during strong trends, but fading moves when markets are choppy.
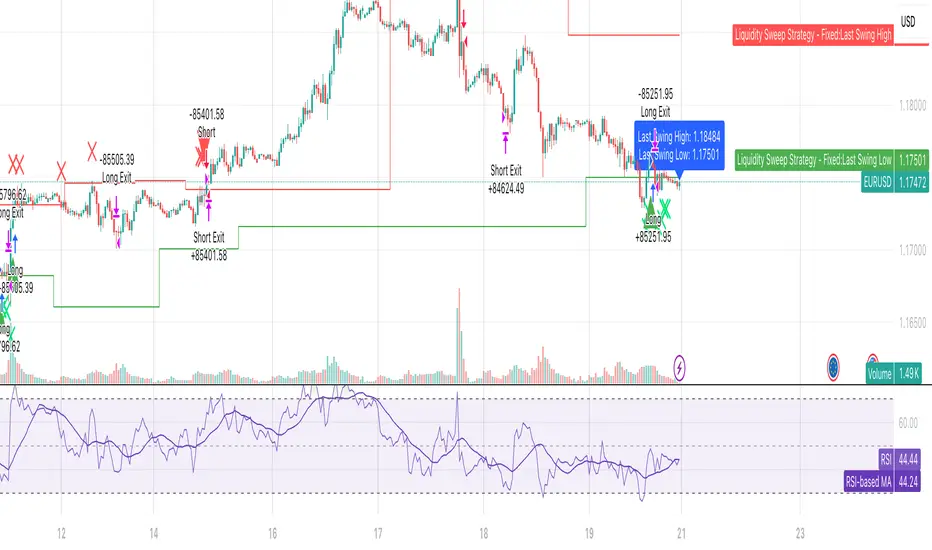
Liquidity SweeperStrategy Overview
This Pine Script implements a Liquidity Sweep Trading Strategy, a sophisticated approach that capitalizes on market manipulation tactics commonly used by institutional traders. The strategy identifies when price "sweeps" above recent swing highs or below swing lows to trigger stop losses and grab liquidity, then quickly reverses direction - creating high-probability trading opportunities.
Core Concept: What is a Liquidity Sweep?
A liquidity sweep occurs when:
Price breaks above a swing high (or below a swing low) to trigger retail stop losses
Institutional players absorb this liquidity at favorable prices
Price quickly reverses back into the previous range
This creates a "fake breakout" or "stop hunt" pattern
The strategy exploits these manipulative moves by entering trades in the direction of the reversal.
How the Strategy Works
1. Swing Point Detection
Uses a lookback period (default: 20 bars) to identify significant swing highs and lows
Employs proper pivot point detection using ta.highestbars() and ta.lowestbars()
Only considers confirmed swing points (not just recent highs/lows)
2. Liquidity Sweep Identification
High Sweep (Short Setup):
Price moves above the last swing high (triggering buy stops)
Same bar closes back below the swing high (showing rejection)
Low Sweep (Long Setup):
Price moves below the last swing low (triggering sell stops)
Same bar closes back above the swing low (showing support)
3. Confirmation Process
Requires price to stay within the swept range for a specified number of bars (default: 3)
This confirms the sweep was genuine and not just normal volatility
Prevents false signals and improves trade quality
4. Entry Logic
Long Entries: Triggered after confirmed low sweeps
Short Entries: Triggered after confirmed high sweeps
5. Risk Management
Stop Loss: Placed at a multiple of ATR (default: 1.5x) from entry price
Take Profit: Risk/Reward ratio based (default: 2:1)
Position Sizing: 10% of equity per trade (configurable)
Red X-crosses: High sweeps detected
Green X-crosses: Low sweeps detected
Red triangles (down): Short entry signals
Green triangles (up): Long entry signals
Horizontal lines: Current swing high/low levels
Info label: Shows last detected swing levels
Optimal Conditions:
Timeframes: 1H, 4H, and Daily work best
Market Conditions: Ranging and trending markets both suitable
Volatility: Moderate to high volatility preferred
Session Times: Most effective during active trading sessions
Strengths:
✅ Exploits institutional manipulation tactics
✅ Clear entry/exit rules with defined risk
✅ Works across multiple asset classes
✅ Includes proper confirmation to reduce false signals
✅ Visual clarity for manual verification
✅ Reasonable risk/reward parameters
Limitations:
⚠️ Requires patience - not a high-frequency strategy
⚠️ Market dependent - fewer signals in low volatility periods
⚠️ Needs sufficient lookback data for swing identification
⚠️ May have drawdown periods during strong trending moves
⚠️ Requires understanding of market structure concepts
Best Practices for Users
Optimization Tips:
Adjust lookback period based on timeframe (shorter for lower TFs)
Test different confirmation periods for your market
Consider market session times when backtesting
Use alongside volume analysis for additional confirmation
Risk Management:
Never risk more than 2-3% per trade of total capital
Consider reducing position size during high-impact news
Monitor correlation if trading multiple pairs simultaneously
Use additional filters (trend, support/resistance) for confluence
Backtesting Recommendations:
Test on at least 6 months of historical data
Include different market conditions (trending, ranging, volatile)
Consider transaction costs and slippage in results
Forward test on demo before live implementation
Expected Results
Based on typical liquidity sweep strategy performance:
Disclaimer
This strategy is based on market structure analysis and institutional trading behavior patterns. Past performance doesn't guarantee future results. Users should:
Thoroughly backtest before live trading
Start with small position sizes
Understand the underlying concepts before implementation
Consider combining with other analysis methods
Always use proper risk management
The strategy works best when traders understand the psychological and structural elements of liquidity sweeps rather than just following signals blindly.
BBAWE 事件合約This is a paid version. Please contact me or follow me.
✅ Key Features
Strict 1-bar confirmation for cleaner entries.
Fast EMA filter to avoid false breakouts.
Cooldown system to reduce overtrading.
Visual markers for Key Bars and trade entries.
Fully customizable parameters (BB period, EMA length, cooldown bars).
📈 Best Suited For
Short-term scalping or intraday setups.
Catching quick reversals or momentum continuation.
Traders who need stricter signal validation to filter noise.

event contract boll 事件合約Bollinger Bands (BB)
Strict t1 Confirmation
Only the very next candle (t1) is checked:
Long
Short
Prevents rapid-fire entries in choppy markets.✅ Key Features
Strict 1-bar confirmation for cleaner entries.
Fast EMA filter to avoid false breakouts.
Cooldown system to reduce overtrading.
Visual markers for Key Bars and trade entries.
Fully customizable parameters (BB period, EMA length, cooldown bars).
📈 Best Suited For
Short-term scalping or intraday setups.
Catching quick reversals or momentum continuation.
Traders who need stricter signal validation to filter noise.

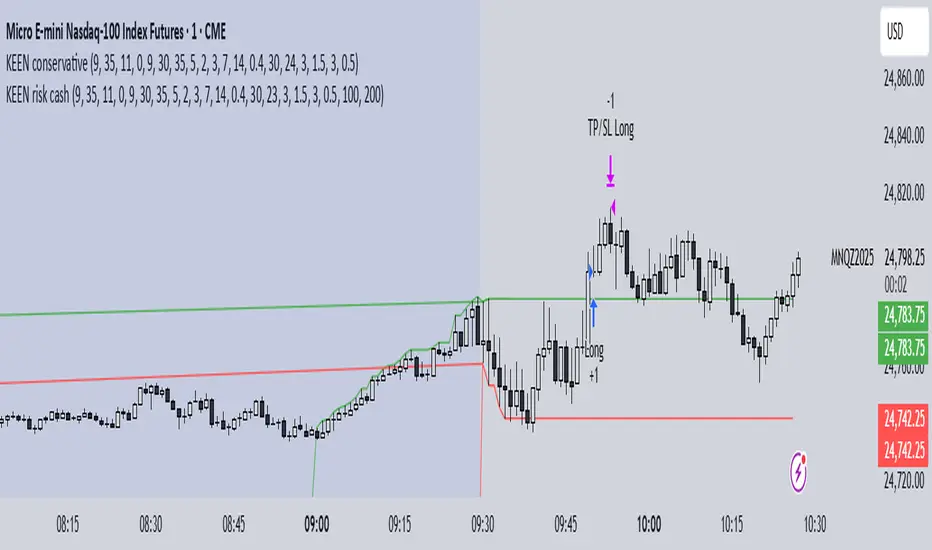
KEEN risk cashthis strategy is based on orb 5 minutes and is set off for risk per trade and take profit.
try yourself and let me know how it works
Grand Master's Candlestick Dominance (ATR Enhanced)### Grand Master's Candlestick Dominance (ATR Enhanced)
**Overview**
Unleash the ancient wisdom of Japanese candlestick charting with a modern twist! This comprehensive Pine Script v5 strategy and indicator scans for over 75 classic and advanced candlestick patterns (bullish, bearish, and neutral), assigning dynamic strength scores (1-10) to each for precise signal filtering. Enhanced with Average True Range (ATR) for volatility-aware body size validation, it dominates the markets by combining timeless pattern recognition with robust confirmation layers. Whether used as a backtestable strategy or visual indicator, it empowers traders to spot high-probability reversals, continuations, and indecision setups with surgical accuracy.
Inspired by Steve Nison's *Japanese Candlestick Charting Techniques*, this tool elevates pattern analysis beyond basics—think Hammers, Engulfing patterns, Morning Stars, and rare gems like Abandoned Baby or Concealing Baby Swallow—all consolidated into intelligent arrays for real-time averaging and prioritization.
**Key Features**
- **Extensive Pattern Library**:
- **Bullish (25+ patterns)**: Hammer (8.0), Bullish Engulfing (10.0), Morning Star (7.0), Three White Soldiers (9.0), Dragonfly Doji (8.0), and more (e.g., Rising Three, Unique Three River Bottom).
- **Bearish (25+ patterns)**: Hanging Man (8.0), Bearish Engulfing (10.0), Evening Star (7.0), Three Black Crows (9.0), Gravestone Doji (8.0), and exotics like Upside Gap Two Crows or Stalled Pattern.
- **Neutral/Indecision (34+ patterns)**: Doji variants (Long-Legged, Four Price), Spinning Tops, Harami Crosses, and multi-bar setups like Upside Tasuki Gap or Advancing Block.
Each pattern includes duration tracking (1-5 bars) and ATR-adjusted body/shadow criteria for relevance in volatile conditions.
- **Smart Confirmation Filters** (All Toggleable):
- **Trend Alignment**: 20-period SMA (customizable) ensures entries align with the prevailing trend; optional higher timeframe (e.g., Daily) MA crossover for multi-timeframe confluence.
- **Support/Resistance (S/R)**: Pivot-based levels with 0.01% tolerance to confirm bounces or breaks.
- **Volume Surge**: 20-period volume MA with 1.5x spike multiplier to validate momentum.
- **ATR Body Sizing**: Filters small bodies (<0.3x ATR) and long bodies (>0.8x ATR) for context-aware pattern reliability.
- **Follow-Through**: Ensures post-pattern confirmation via bullish/bearish closes or closes beyond prior bars.
Minimum average strength (default 7.0) and individual pattern thresholds (5.0) prevent weak signals.
- **Entry & Exit Logic**:
- **Long Entry**: Bullish average strength ≥7.0 (outweighing bearish), uptrend, volume spike, near support, follow-through, and HTF alignment.
- **Short Entry**: Mirror for bearish dominance in downtrends near resistance.
- **Exits**: Bearish/neutral shift, or fixed TP (5%) / SL (2%)—pyramiding disabled, 10% equity sizing.
- Backtest range: Jan 1, 2020 – Dec 31, 2025 (editable). Initial capital: $10,000.
- **Interactive Dashboard** (Top-Right Panel):
Real-time insights including:
- Market phase (e.g., "Bullish Phase (Avg Str: 8.2)"), active pattern (e.g., "BULLISH: Bullish Engulfing (Str: 10.0, Bars: 2)"), and trend status.
- Strength breakdowns (Bull/Bear/Neutral counts & averages).
- Filter status (e.g., "Volume: ✔ Spike", "ATR: Enabled (L:0.8, S:0.3)").
- Backtest stats: Total trades, win rate, streak, and last entry/exit details (price & timestamp).
Toggle mode: Strategy (live trades) or Indicator (signals only).
- **Advanced Alerts** (15+ Toggleable Types):
Set up via TradingView's "Any alert() function call" for bar-close triggers:
- Entry/Exit signals with strength & pattern details.
- Strong patterns (≥2 bullish/bearish), neutral indecision, volume spikes.
- S/R breakouts, HTF reversals, high-confidence singles (≥8.0 strength).
- Conflicting signals, MA crossovers, ATR volatility bursts, multi-bar completions.
Example: "STRONG BULLISH PATTERN detected! Strength: 9.5 | Top Pattern: Three White Soldiers | Trend: Up".
**Customization & Usage Tips**
- **Inputs Groups**: Strategy toggles, confirmations, exits, backtest dates, and 15+ alert switches—all intuitively grouped.
- **Optimization**: Tune min strengths for aggressive (lower) or conservative (higher) trading; enable/disable filters to suit your style (e.g., disable S/R for scalping).
- **Best For**: Forex, stocks, crypto on 1H–Daily charts. Test on historical data to refine TP/SL.
- **Limitations**: No external data installs; relies on built-in TA functions. Patterns are probabilistic—combine with your risk management.
Master the candles like a grandmaster. Deploy on TradingView, backtest relentlessly, and let dominance begin! Questions? Drop a comment.
*Version: 1.0 | Updated: September 2025 | Credits: Built on Pine Script v5 with nods to Nison's timeless techniques.*

Ramen & OJ V1Ramen & OJ V1 — Strategy Overview
Ramen & OJ V1 is a mechanical price-action system built around two entry archetypes—Engulfing and Momentum—with trend gates, session controls, risk rails, and optional interval take-profits. It’s designed to behave the same way you’d trade it manually: wait for a qualified impulse, enter with discipline (optionally on a measured retracement), and manage the position with clear, rules-based exits.
Core Idea (What the engine does)
At its heart, the strategy looks for a decisive candle, then trades in alignment with your defined trend gates and flattens when that bias is no longer valid.
Entry Candle Type
Engulfing: The body of the current candle swallows the prior candle’s body (classic momentum shift).
Momentum: A simple directional body (close > open for longs, close < open for shorts).
Body Filter (lookback): Optional guard that requires the current body to be at least as large as the max body from the last N bars. This keeps you from chasing weak signals.
Primary MA (Entry/Exit Role):
Gate (optional): Require price to be above the Primary MA for longs / below for shorts.
Exit (always): Base exit occurs when price closes back across the Primary MA against your position.
Longs: qualifying bullish candle + pass all enabled filters.
Shorts: mirror logic.
Entries (Impulse vs. Pullback)
You choose how aggressive to be:
Market/Bars-Close Entry: Fire on the bar that confirms the signal (respecting filters and sessions).
Retracement Entry (optional): Instead of chasing the close, place a limit around a configurable % of the signal candle’s range (e.g., 50%). This buys the dip/sells the pop with structure, often improving average entry and risk.
Flip logic is handled: when an opposite, fully-qualified signal appears while in a position, the strategy closes first and then opens the new direction per rules.
Exits & Trade Management
Primary Exit: Price closing back across the Primary MA against your position.
Interval Take-Profit (optional):
Pre-Placed (native): Automatically lays out laddered limit targets every X ticks with OCO behavior. Each rung can carry its own stop (per-rung risk). Clean, broker-like behavior in backtests.
Manual (legacy): Closes slices as price steps through the ladder levels intrabar. Useful for platforms/brokers that need incremental closes rather than bracketed OCOs.
Per-Trade Stop: Choose ticks or dollars, and whether the $ stop is per position or per contract. When pre-placed TP is on, each rung uses a coordinated OCO stop; otherwise a single hard stop is attached.
Risk Rails (Session P&L Controls)
Session Soft Lock: When a session profit target or loss limit is hit, the strategy stops taking new trades but does not force-close open positions.
Session Hard Lock: On reaching your session P&L limit, all orders are canceled and the strategy flattens immediately. No new orders until the next session.
These rails help keep good days good and bad days survivable.
Filters & How They Work Together
1) Trend & Bias
Primary MA Gate (optional): Only long above / only short below. This keeps signals aligned with your primary bias.
Primary MA Slope Filter (optional): Require a minimum up/down slope (in degrees over a defined bar span). It’s a simple way to force impulse alignment—green light only when the MA is actually moving up for longs (or down for shorts).
Secondary MA Filter (optional): An additional trend gate (SMA/EMA, often a 200). Price must be on the correct side of this higher-timeframe proxy to trade. Great for avoiding countertrend picks.
How to combine:
Use Secondary MA as the “big picture” bias, Primary MA gate as your local regime check, and Slope to ensure momentum in that regime. That three-layer stack cuts a lot of chop.
2) Volatility/Exhaustion
CCI Dead Zone Filter (optional): Trades only when CCI is inside a specified band (default ±200). This avoids entries when price is extremely stretched; think of it as a no-chase rule.
TTM Squeeze Filter (optional): When enabled, the strategy avoids entries during a squeeze (Bollinger Bands inside Keltner Channels). You’re effectively waiting for the release, not the compression itself. This plays nicely with momentum entries and the slope gate.
How to combine:
If you want only the clean breaks, enable Slope + Squeeze; if you want structure but fewer chases, add CCI Dead Zone. You’ll filter out a lot of low-quality “wiggle” trades.
3) Time & Market Calendar
Sessions: Up to two session windows (America/Chicago by default), with background highlights.
Good-Till-Close (GTC): When ON, trades can close outside the session window; when OFF, all positions are flattened at session end and pending orders canceled.
Market-Day Filters: Skip US listed holidays and known non-full Globex days (e.g., Black Friday, certain eves). Cleaner logs and fewer backtest artifacts.
How to combine:
Run your A-setup window (e.g., cash open hour) with GTC ON if you want exits to obey system rules even after the window, or GTC OFF if you want the book flat at the bell, no exceptions.
Practical Profiles (mix-and-match presets)
Trend Rider: Primary MA gate ON, Slope filter ON, Secondary MA ON, Retracement ON (50%).
Goal: Only take momentum that’s already moving, buy the dip/sell the pop back into trend.
Structure-First Pullback: Primary MA gate ON, Secondary MA ON, CCI Dead Zone ON, Retracement 38–62%.
Goal: Filter extremes, use measured pullbacks for better R:R.
Break-Only Mode: Slope ON + Squeeze filter ON (avoid compression), Body filter ON with short lookback.
Goal: Only catch clean post-compression impulses.
Session Scalper: Tight session window, GTC OFF, Interval TP ON (small slices, short rungs), per-trade tick stop.
Goal: Quick hits in a well-defined window, always flat after.
Automation Notes
The system is built with intrabar awareness (calc_on_every_tick=true) and supports bracket-style behavior via pre-placed interval TP rungs. For webhook automation (e.g., TradersPost), keep chart(s) open and ensure alerts are tied to your order events or signal conditions as implemented in your alert templates. Always validate live routing with a small-size shakedown before scaling.
Tips, Caveats & Good Hygiene
Intrabar vs. Close: Backtests can fill intrabar where your broker might not. The pre-placed mode helps emulate OCO behavior but still depends on feed granularity.
Slippage & Fees: Set realistic slippage/commission in Strategy Properties to avoid fantasy equity curves.
Session Consistency: Use the correct timezone and verify that your broker’s session aligns with your chart session settings.
Don’t Over-stack Filters: More filters ≠ better performance. Start with trend gates, then add one volatility filter if needed.
Disclosure
This script is for educational purposes only and is not financial advice. Markets carry risk; only trade capital you can afford to lose. Test thoroughly on replay and paper before using any automated routing.
TL;DR
Identify a decisive candle → pass trend/vol filters → (optionally) pull back to a measured limit → scale out on pre-planned rungs → exit on Primary MA break or session rule. Clear, mechanical, repeatable.

BSL/SSL Sweep + FVG Strategy Jobin (c) The New York ATM Model is a structured intraday strategy designed to capture algorithmic stop-hunts and reversals during the New York session open. It focuses on liquidity sweeps—either Buy-Side or Sell-Side—followed by a confirmation using Fair Value Gaps (FVGs).

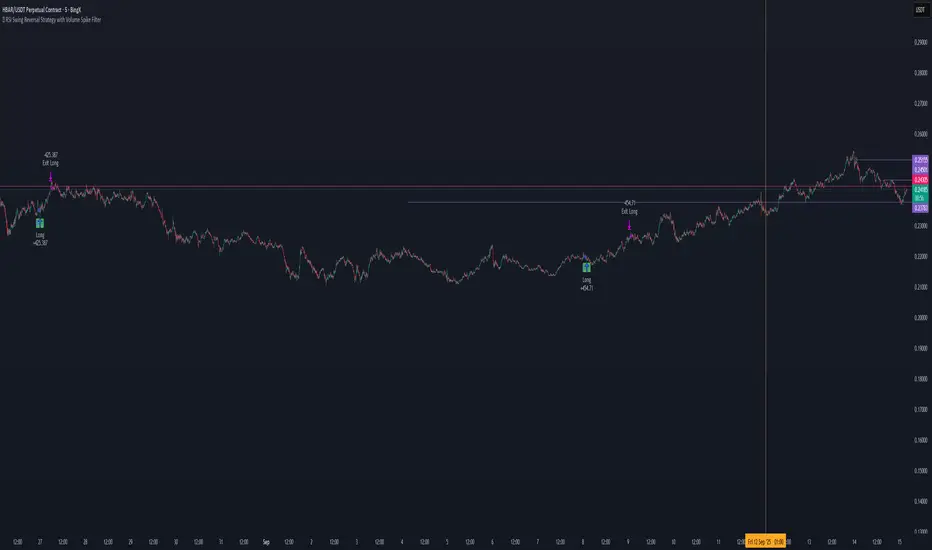
📊 RSI Swing Reversal Strategy with Volume Spike FilterHi , i did test that on Hbar time frame 5min. please let me know if i did miss something .85% win rate. please get back test.
What Will This Strategy Do?
Use RSI cross over/under its MA + Swing High/Low + optional Trend Filter.
Enter long on bullish signals.
Enter short on bearish signals.
Exit on opposite signals or optional take-profit/stop-loss.