Follow-up Buy / Sell Volume Pressure at Supply / Demand Zones█ Overview:
BE-Volume Footprint & Pressure Candles, is an indicator which is preliminarily designed to analyze the supply and demand patterns based on Rally Base Rally (RBR), Drop Base Drop (DBD), Drop Base Rally (DBR) & Rally Base Drop (RBD) concepts in conjunction to volume pressure. Understanding these concepts are crucial. Let's break down why the "Base" is you Best friend in this context.
Commonness in RBR, DBD, DBR, RBD patterns ?
There is an impulse price movement at first, be it rally (price moving up) or the Drop (price moving down), followed by a period of consolidation which is referred as "BASE" and later with another impulse move of price (Rally or Drop).
Why is the Base Important
1. Market Balance: Base represents a balance between buyers and sellers. This is where decisions are made.
2. Confirmation: It confirms the strength of previous impulse move which has happened.
Base & the Liquidity Play:
Supply & Demand Zone predict the presence of all large orders within the limits of the Base Zone. Price is expected to return to the zone to fill the unfilled orders placed by large players.
For the price to move in the intended direction Liquidity plays the major role. hence indicator aims to help traders in identifying those zones where liquidity exists and the volume pressure helps in confirming that liquidity is making its play.
Bottom pane in the below snapshots is a visual representation of Buyers volume pressure (Green Line & the Green filled area) making the price move upwards vs Sellers volume pressure (Red Line & the Red filled area) making the price move downwards.
Top pane in the below snapshots is a visual representation on the pattern identification (Blue marked zone & the Blue line referred as Liquidity level)
Bullish Pressure On Buy Liquidity:
Bearish Pressure On Sell Liquidity:
█ How It Works:
1. Indicator computes technical & mathematical operations such as ATR, delta of Highs & Lows of the candle and Candle ranges to identify the patterns and marks the liquidity lines accordingly.
2. Indicator then waits for price to return to the liquidity levels and checks if Directional volume pressure to flow-in while the prices hover near the Liquidity zones.
3. Once the Volume pressure is evident, loop in to the ride.
█ When It wont Work:
When there no sufficient Liquidity or sustained Opposite volume pressure, trades are expected to fail.
█ Limitations:
Works only on the scripts which has volume info. Relays on LTF candles to determine intra-bar volumes. Hence, Use on TF greater than 1 min and lesser than 15 min.
█ Indicator Features:
1. StrictEntries: employs' tighter rules (rather most significant setups) on the directional volume pressure applied for the price to move. If unchecked, liberal rules applied on the directional volume pressure leading to more setups being identified.
2. Setup Confirmation period: Indicates Waiting period to analyze the directional volume pressure. Early (lesser wait period) is Risky and Late (longer wait period) is too late for the
ride. Find the quant based on the accuracy of the setup provided in the bottom right table.
3. Algo Enabled with Place Holders:
Indicator is equipped with algo alerts, supported with necessary placeholders to trade any instrument like stock, options etc.
Accepted PlaceHolders (Case Sensitive!!)
1. {{ticker}}-->InstrumentName
2. {{datetime}}-->Date & Time Of Order Placement
3. {{close}}-->LTP Price of Script
4. {{TD}}-->Current Level:
Note: Negative Numbers for Short Setup
5. {{EN}} {{SL}} {{TGT}} {{T1}} {{T2}} --> Trade Levels
6. {{Qty}} {{Qty*x}} --> Qty -> Trade Qty mapped in Settings. Replace x with actual number of your choice for the multiplier
7. {{BS}}-->Based on the Direction of Trade Output shall be with B or S (B == Long Trade & S == Short Trade)
8. {{BUYSELL}}-->Based on the Direction of Trade Output shall be with BUY or SELL (BUY == Long Trade & SELL == Short Trade)
9. {{IBUYSELL}}-->Based on the Direction of Trade Output shall be with BUY or SELL (BUY == SHORT Trade & SELL == LONG Trade)
Dynamic Alerts:
10. { {100R0} }-->Dynamic Place Holder 100 Refers to Strike Difference and Zero refers to ATM
11. { {100R-1} }-->Dynamic Place Holder 100 Refers to Strike Difference and -1 refers to
ATM - 100 strike
12. { {50R2} }-->Dynamic Place Holder 50 Refers to Strike Difference and 2 refers to
ATM + (2 * 50 = 100) strike
13. { {"ddMMyy", 0} }-->Dynamically Picks today date in the specified format.
14. { {"ddMMyy", n} }-->replace n with actual number of your choice to Pick date post today date in the specified format.
15. { {"ddMMyy", "MON"} }-->dynamically pick Monday date (coming Monday, if today is not Monday)
Note. for the 2nd Param-->you can choose to specify either Number OR any letter from =>
16. {{CEPE}} {{ICEPE}} {{CP}} {{ICP}} -> Dynamic Option Side CE or C refers to Calls and PE or P refers to Puts. If "I" is used in PlaceHolder text, On long entries PUTs shall be used
Indicator is equipped with customizable Trade & Risk management settings like multiple Take profit levels, Trailing SL.
Candlestickpattern

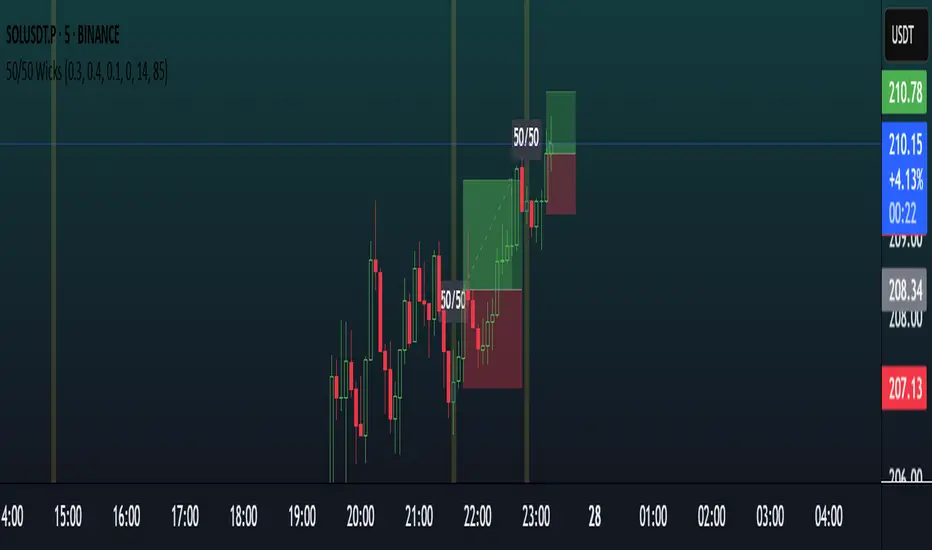
Balanced Big Wicks (50/50) HighlighterDetects candles with unusually long, balanced upper and lower wicks—a potential sign of market indecision followed by strong breakout action.
What It Does
Identifies candles where both upper and lower wicks each account for at least a configurable percentage (e.g., 30–40%) of the total range, and where the body remains small—creating the classic “balanced wick” (50/50) appearance.
Marks these candles visually with color (bullish/bearish), optional background shading, and a tiny “50/50” label above the candle.
Why It’s Useful
Balanced wicks often precede decisive moves once price breaks either wick. This script highlights such opportunities systematically.
Helpful for traders looking for clean entry signals: long on close above the upper wick, short on close below the lower wick—with straightforward risk management (SL at opposite wick, TP 1:1).
Key Inputs (default values shown in parentheses)
Min wick % (each side): 30%
Max body %: 20%
Equality tolerance: 10%
Min range filter (ATR multiples): 0 (disable)
ATR length: 14
Color candles: On
Background highlight: Off by default
Plot label on candle: On
Adjust these to fit your preferred timeframe or instrument (e.g., raise wick thresholds or ATR filter for noisy 15‑minute altcoin charts; relax slightly for smoother 1‑hour BTC analysis).
Alerts
Three alert options included:
“50/50 Wick (Any)” — triggers on any balanced-wick candle.
“50/50 Wick (Bullish)” — only when the candle closes bullish (upper close).
“50/50 Wick (Bearish)” — only when the candle closes bearish (lower close).
How to Use It
Add the indicator to your chart.
Adjust input settings to suit the timeframe or trading style.
Watch for highlighted candles.
Optional alert: create alerts using one of the provided alert conditions (e.g., “50/50 Wick (Any)”) with “Once per bar close” to get notified when signal bars appear.
Use your own trade logic (e.g., breakout entries as described above).
Disclaimer & Originality
Original Concept: I built this script from scratch to highlight a specific candle structure often used by traders in breakout setups—long balanced wicks with small bodies.
No external code references; it’s entirely open-source and self-explanatory.
Note: This indicator highlights potential setups—not financial advice. Always backtest any strategy, and use sound risk management. Past patterns do not guarantee future success.
Optimized Settings for 5m–15m Scalping
Min wick % (each side): 0.30
→ Forces both wicks to be almost half the candle each. Very strict.
Max body % of range: 0.40
→ Candle body must be ≤10% of full range = almost a doji.
Equality tolerance: 0.1
→ Wicks must be within 5% of each other relative to full candle size.
Min range filter (ATR multiples): 0
→ Candle must be at least 1.2× bigger than recent average (ATR14). Filters out weak fake dojis.
ATR Length: 14 (standard, stable)
Color candles / Plot labels: On (so you clearly see them)
Background highlight: Optional
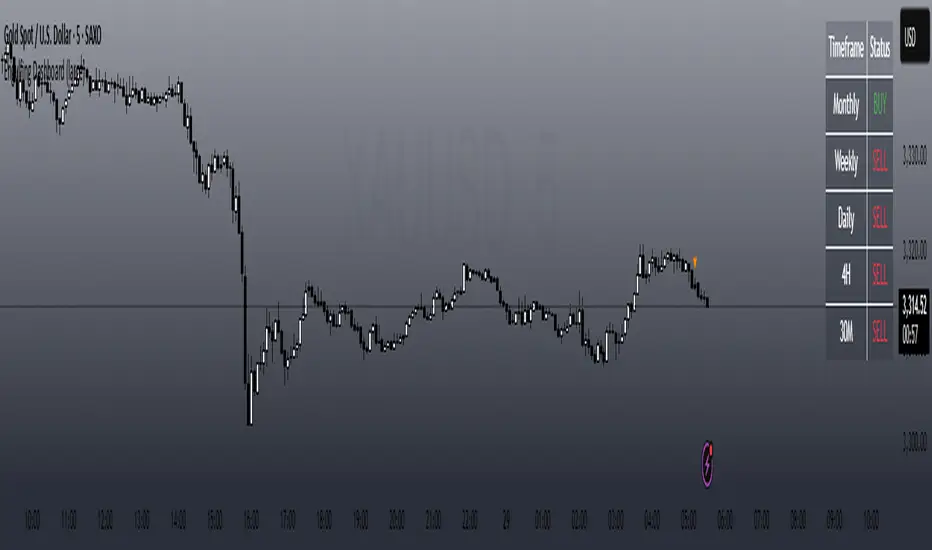
Inside Candle DivergenceStudy Material: Inside Candle Divergence Indicator (aiTrendview)
1. Introduction
The Inside Candle Divergence Indicator is a custom tool built on TradingView using Pine Script. It is designed to help traders identify potential reversal points or trend continuations using a mix of candlestick analysis, RSI (Relative Strength Index), VWAP (Volume Weighted Average Price), Pivot Points, and Volume analytics. The tool also provides a dashboard table on the chart, summarizing all key values in a single glance for traders and analysts.
This indicator is not just a signal generator but also an educational framework—explaining how different concepts in technical analysis combine to build a systematic approach for market entries and exits.
________________________________________
2. Core Concepts Behind the Tool
A. Inside Candle Pattern
An Inside Candle forms when the current candle’s high is lower than or equal to the previous candle’s high, and the low is higher than or equal to the previous candle’s low.
• This means the entire price action of the current candle is "inside" the range of the previous candle.
• A bullish inside candle occurs when the close is higher than the open.
• A bearish inside candle occurs when the close is lower than the open.
This pattern shows market indecision but also sets up potential breakouts or trend reversals.
________________________________________
B. RSI (Relative Strength Index)
The indicator calculates RSI using the formula from the ta.rsi() function in TradingView. RSI helps measure momentum in the market.
• A low RSI (below 25) signals an oversold zone → possible buy.
• A high RSI (above 75) signals an overbought zone → possible sell.
By combining RSI with the Inside Candle, the indicator ensures that signals are triggered only when momentum and price patterns confirm each other.
________________________________________
C. Buy & Sell Signals
• Buy Signal: Triggered when RSI < Buy Level (default 25) and a bullish inside candle forms.
• Sell Signal: Triggered when RSI > Sell Level (default 75) and a bearish inside candle forms.
When triggered, the chart displays a BUY (green label below candle) or SELL (red label above candle) marker. The indicator also saves the entry price and signal bar for future reference inside the dashboard.
________________________________________
D. VWAP (Volume Weighted Average Price)
VWAP is calculated using the typical price (H+L+C)/3 and weighting it by volume.
• VWAP shows the average trading price weighted by volume, widely used by institutions.
• The tool calculates the distance of price from VWAP in % terms.
• If price is far above VWAP, the market may be overheated (overbought). If far below, it may be undervalued (oversold).
________________________________________
E. Volume Analysis
The tool splits volume into Buy Volume and Sell Volume:
• Buy Volume: If close > open.
• Sell Volume: If close ≤ open.
• Cumulative totals are maintained, and percentages are calculated to show what proportion of total market volume is bullish vs bearish.
• A progress bar style visual (using blocks █) shows the dominance of buyers or sellers.
This allows traders to quickly measure whether buyers or sellers are controlling the market trend.
________________________________________
F. Daily Pivot Points
Pivot Points are calculated using the previous day’s high, low, and close:
• Pivot = (High + Low + Close) / 3
• R1, S1, R2, S2, R3, S3 levels are derived from this pivot.
• These levels act as support and resistance zones.
The script plots Pivot, R1, and S1 lines on the chart for easy reference.
________________________________________
G. Trend Direction
The indicator checks where the price is compared to R1 and S1:
• If price > R1 → Bullish Trend
• If price < S1 → Bearish Trend
• Otherwise → Neutral Trend
The trend direction is displayed in the dashboard with arrows (↑, ↓, →).
________________________________________
H. Price Change Calculation
The tool calculates:
• Price Change = Current Close – Previous Close
• Percentage Change = (Change / Previous Close) × 100
• Displays ▲ (green upward) or ▼ (red downward) with the exact percentage.
This gives traders a quick snapshot of intraday price movement.
________________________________________
I. Dashboard Table
One of the most powerful features is the real-time dashboard table shown on the chart. It contains:
1. Symbol & Price Info (Current ticker, price, change %)
2. RSI Reading (with color coding: green for oversold, red for overbought)
3. VWAP and Distance from VWAP
4. Volume Analysis with Progress Bar (Buy vs Sell %)
5. Pivot Levels (Pivot, R1, S1)
6. Trend Direction (Bullish, Bearish, Neutral)
7. Signal Status (Last Buy/Sell signal with entry price)
This reduces the need for multiple indicators and gives traders a command-center view directly on the chart.
________________________________________
J. Alerts
The tool generates alerts whenever a Buy or Sell condition is met. Traders can set up TradingView alerts to be notified instantly when:
• Buy Signal Alert → RSI oversold + Bullish inside candle
• Sell Signal Alert → RSI overbought + Bearish inside candle
This ensures no opportunity is missed even if you’re not actively monitoring the chart.
________________________________________
K. Background Highlights
The chart background also changes faintly (light green or light red) when a Buy or Sell condition is triggered. This gives traders visual confirmation along with signals and alerts.
________________________________________
3. Practical Use of This Tool
• Scalpers & Intraday Traders can use it for quick momentum-based entries.
• Swing Traders can use the RSI + Inside Candle + Pivot Points to find medium-term reversals.
• Analysts can use the dashboard for real-time summaries in reports.
• Volume Analysis helps understand institutional activity.
Remember: This is not a standalone holy grail. It must be used with proper risk management and confirmation from higher timeframes.
________________________________________
4. Strict Disclaimer (aiTrendview)
⚠️ Disclaimer from aiTrendview:
This indicator is designed for educational and analytical purposes only. It is not financial advice or a guaranteed trading strategy. Markets are inherently risky and unpredictable; past performance of indicators does not ensure future results. Trading involves risk of financial loss, and traders must use proper risk management, stop-loss, and independent judgment.
aiTrendview strictly follows TradingView.com rules and compliance guidelines.
Any misuse of this tool, its code, or analytical features for unauthorized commercial purposes, false promises, or misleading activities is strictly discouraged. The creators of this script and aiTrendview will not be responsible for any losses, damages, or misuse arising from its application. Always trade responsibly and only with money you can afford to lose.
________________________________________

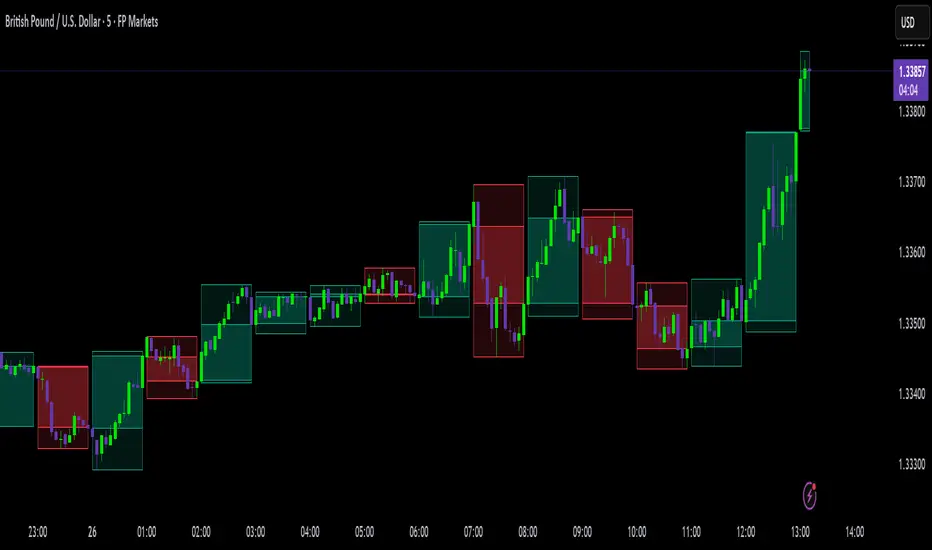
High Timeframe Candle Overlay (Configurable)HTF Candle Overlay — Read Higher Timeframe on Lower Timeframe Charts
What it does
This indicator draws each selected Higher-Timeframe (HTF) candle directly on your lower-timeframe (LTF) chart. It shows a translucent range box (HTF high–low) and an inner body box (HTF open–close), so you can track how the bigger candle is forming while you analyze lower-timeframe structure, liquidity sweeps, and intrabar reactions.
Why it’s helpful
• See where the current HTF candle opened, where price sits inside its body, and how far wicks extend—without leaving your LTF chart.
• Combine HTF context (e.g., 1H/4H) with LTF execution (e.g., 1m–15m) to spot confluence, S/R flips, and failed breaks faster.
• The overlay is locked to the price scale and anchored by bar index, so it pans/zooms exactly with your chart (no drifting while dragging).
⸻
How it works (under the hood)
• Fetches HTF OHLC via request.security.
• When a new HTF bar starts, the previous HTF boxes are frozen at the true close.
• The current HTF bar updates intrabar (so you see live formation) and is clamped to the correct span.
• Horizontal anchoring uses bar index, and a hidden price plot binds the script to the main price scale for stable zoom/pan behavior.
⸻
Inputs
• High Timeframe (HTF): Default 1H (set any TF you like).
• Show High–Low Box: On/off.
• Show Body Box (Open–Close): On/off.
• Opacity for range/body boxes.
• Bull/Bear Colors and Outline + Width.
• Max HTF Candles to Keep: Auto-deletes older boxes to maintain performance.
⸻
Usage tips
• Popular combos: view 1H or 4H candles while trading 1–15m charts.
• Turn off the range box if you only want a clean HTF body overlay.
• Pair with your session/structure tools; this indicator is visual context only (no signals or alerts).
⸻
Notes & limitations
• Non-repainting for closed HTF bars: once an HTF candle closes, its boxes are fixed. The current/in-progress HTF bar updates until it closes (expected live behavior).
• Data alignment depends on your symbol’s feed and session settings. Heikin Ashi/renko/etc. may not match classic OHLC.
• Heavy history + many boxes can affect performance; reduce “Max HTF Candles to Keep” if needed.
⸻
Disclaimer
This script is for education and charting visualization only. It does not provide financial advice, trade signals, or performance guarantees. Always do your own research and manage risk.
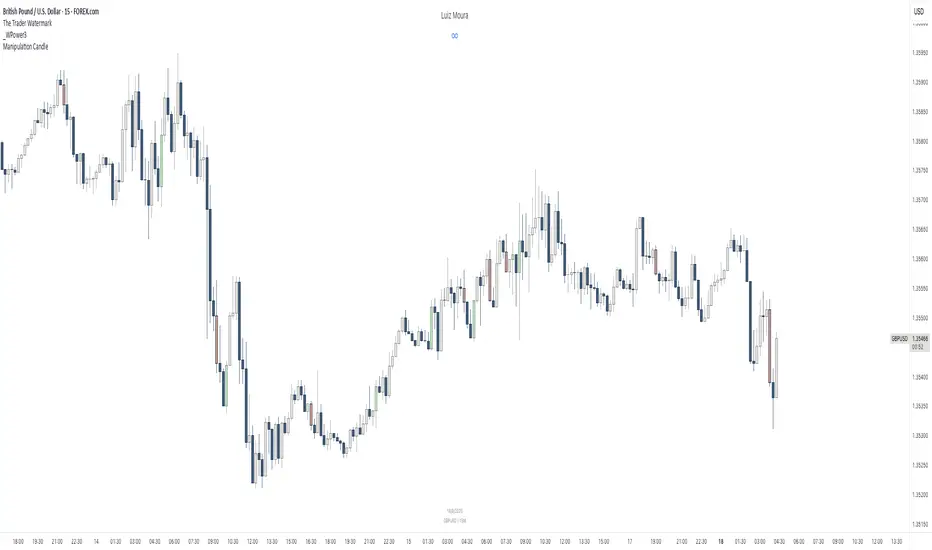
[RealEdgeFX] - Manipulation CandleOverview
The Manipulation Candle indicator highlights potential liquidity grabs and false breakouts directly on the chart. It focuses on moments when price sweeps prior highs or lows but closes in the opposite direction, suggesting a possible manipulation before a market reversal.
Core Logic
The indicator compares the current candle against the previous one and colors the bar when specific conditions are met:
Sell Manipulation (dark red)
When the current candle breaks above the previous high but then closes below the prior low.
→ This often signals a stop hunt to the upside followed by bearish intent.
Buy Manipulation (light green)
When the current candle breaks below the previous low but then closes above the prior high.
→ This suggests a liquidity sweep to the downside before bullish continuation.
Neutral candles remain uncolored to avoid clutter and keep the focus on high-impact moments.
Design Approach
Clarity: Only the candles that meet strict criteria are marked, reducing noise.
Liquidity Focused : Built for traders who want to quickly spot manipulative price action.
Non-Repainting : Once a candle is identified as manipulation, the color stays fixed.
Usage
Add it as an overlay on your chart.
Watch for green or red manipulation candles as alerts of possible reversals or liquidity events.
Combine with your own market structure or bias tools to increase accuracy.
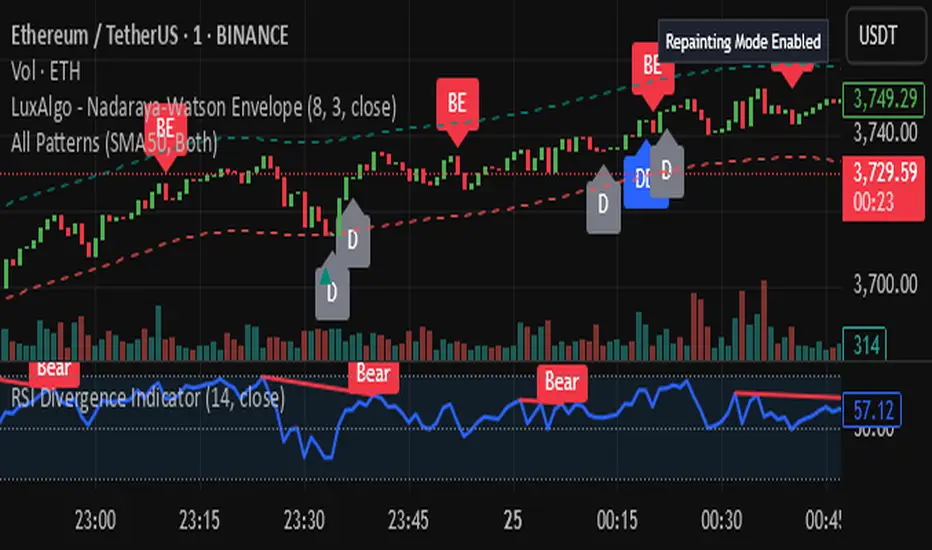
Cvd Divergence Signals with filter.
CVD Divergence + Candles - False Signal Filter
Hey traders,
I want to share my custom indicator with you. Through testing, I've found that CVD (Composite Volume Delta) captures divergences much more accurately than traditional tools like RSI. But this isn't just another divergence indicator - I've added strict candlestick pattern confirmation to filter out false signals. I'll keep improving this tool over time, and I welcome all your suggestions in the comments.
How it works step-by-step:
1. First, it detects CVD divergences (the delta between buy/sell volumes)
2. Then confirms each signal with reversal candlestick patterns:
- Hammer/Hanging Man
- Engulfing
- Pin Bar
- Inside Bar
Why mine beats standard CVD indicators:
• No raw divergences - only shows signals confirmed by BOTH volume AND price action
• Eliminates 80% of junk signals from basic versions
• Adaptable to any asset and timeframe
Simple usage guide:
Green arrows = Buy when:
- CVD shows bullish divergence
- AND a hammer/pin bar appears
Red arrows = Sell when:
- CVD shows bearish divergence
- Confirmed by hanging man/engulfing pattern
Pro tip:
For best results, combine with:
• Volume profile analysis
• Smart Money concepts (order blocks, FVGs )
Important notes:
This isn't a holy grail - I personally use it with support/resistance levels. Works best on 5M charts for scalping.
**PS** Got questions? Drop them in comments!

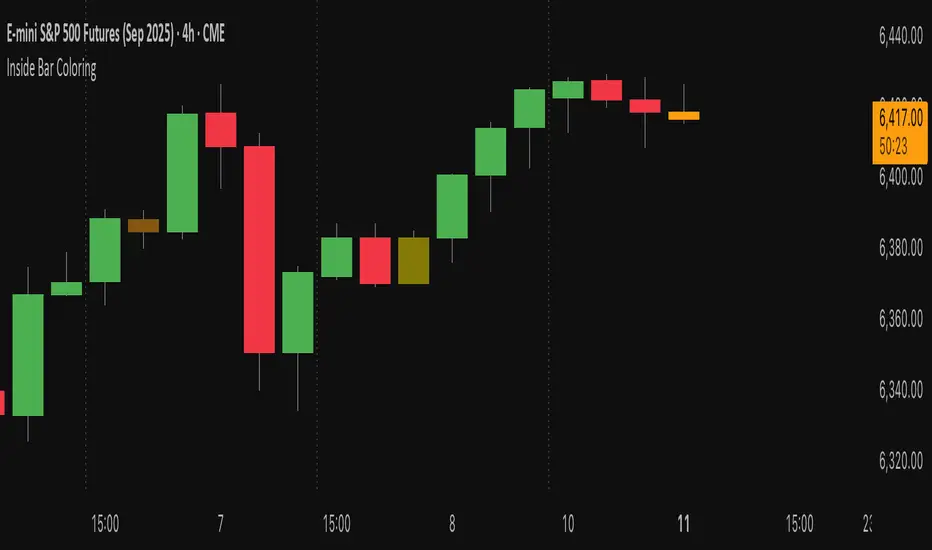
Inside Bar Coloring (Real-time + Historical) w/ AlertsDescription
This Pine Script v6 indicator identifies and colors inside bars, whose entire range (high and low) stays within the previous bar's range. It gives the option to color the real-time bar as well as historical inside bars.
Inside bars are colored differently based on whether they close above or below their opening price (bullish vs bearish). The indicator offers flexible display options including real-time-only highlighting, historical inside bar visualization with transparency, and optional triangle markers for enhanced visibility.
Utility
Inside bars represent periods of market consolidation and reduced volatility, and are by nature consolidating. During this equilibrium, it can be valuable to observe price development rather than engage with it. Conversely, a break of the equilibrium often marks a shift in volatility and provides opportunity. This indicator provides instant visual identification of this price action on your chart.
Features
Smart Coloring System: Separate colors for bullish (close ≥ open) and bearish (close < open) inside bars
Flexible Display Modes: Show only real-time bar, all historical bars, or customize transparency levels
Visual Markers: Optional triangles above or below inside bars
Real-time Alerts: Configurable alerts notify you when new inside bars form
Optimized Performance: Efficient Pine Script v6 code with minimal resource usage
Open Source: Released under Mozilla Public License 2.0
Settings
Customizable colors for bullish/bearish inside bars (real-time and historical)
Toggle historical inside bar display
Real-time bar only mode for clean charts
Adjustable marker position (above/below bars)
Alert activation with detailed price information
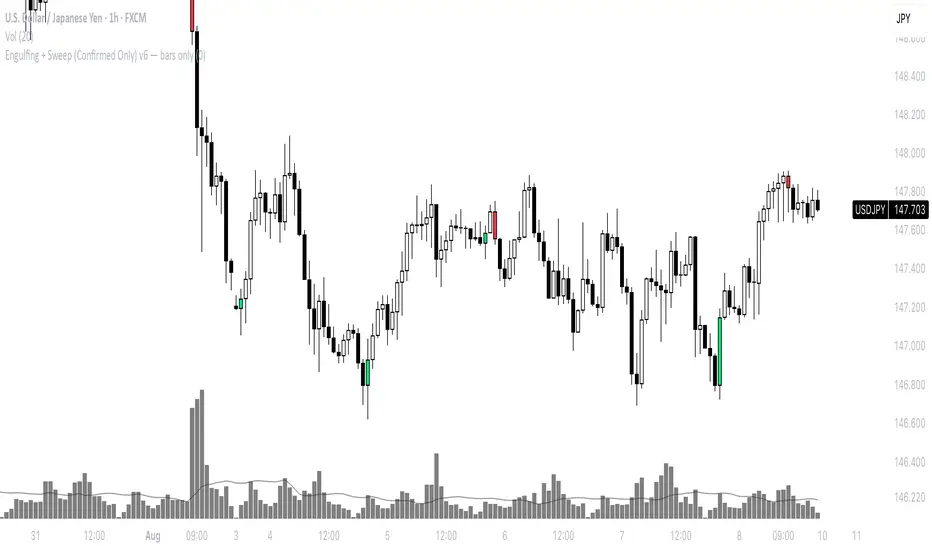
Engulfing + Sweep (Confirmed Only) v6 — bars onlyMarks bullish/bearish engulfing candles with liquidity sweeps and confirms them on the next candle — no repaint.
✳️ Features:
• 🟩 Bullish Engulfing + Low Sweep
• 🟥 Bearish Engulfing + High Sweep
• 🎛 Require opposite-color previous candle (optional)
• 📏 Min body-to-range filter
• 🔔 Alerts on confirmation candle
🎯 Best for:
• Price action & reversal traders
• Liquidity sweep confluence setups
Mayfair Fx Scalper✅ Mayfair FX Scalper — By EastWave Capital
The Mayfair FX Scalper is a precision-focused, closed-source indicator designed for short-term intraday trading, particularly scalping on lower timeframes such as 1-minute, 3-minute, and 5-minute charts. This tool is developed by EastWave Capital and is based on a combination of Relative Strength Index (RSI) extremes and specific candlestick structure patterns to detect potential exhaustion and reversal points in the market.
🔍 How It Works:
The algorithm operates by evaluating three core elements:
RSI Extremes:
RSI is calculated using default settings.
Buy signals are considered only when the RSI on the previous candle is below 22 (oversold), and the current candle is bullish, while the previous one was bearish.
Sell signals are considered when the RSI on the previous candle is above 78 (overbought), and the current candle is bearish, while the previous one was bullish.
Candle Confirmation Logic:
The system waits for candle confirmation (e.g., shift in bullish/bearish structure) rather than triggering signals based on RSI alone.
This avoids false triggers in strong trends and filters weak entries.
SL/TP Estimation (Visual):
While not automatically placing orders, the indicator can optionally display lines or small labels showing a Stop Loss at the previous swing high/low (±0.5) and TP levels at 1R, 2R, and 3R based on that stop.
These visual aids help traders plan risk/reward and exits manually.
📈 How to Use:
Timeframes: Best suited for 1M, 3M, and 5M charts
Markets: Works well on Gold (XAU/USD), Forex majors, Indices, and Crypto
Session: Performs best during high volatility sessions (London & NY)
Use Case:
Wait for a signal label to appear after a clear momentum move.
Confirm price action and trend context.
Use provided visual SL/TP labels or apply your manual RR planning.
Combine with structure breaks, FVG zones, or liquidity sweeps for confluence.
⚠️ Important Notes:
This indicator does not repaint.
No automatic trades are executed. Signals are visual.
Not intended for use in isolation; best when combined with proper trade management and confirmation tools.
Past performance does not guarantee future results. Always manage risk appropriately

Silver BulletSilver Bullet is a trading tool built for finding cleaner, higher-probability setups. It focuses on key windows of market movement and adds helpful tools like daily range levels and candlestick patterns.
Whether you’re trading breakouts or reversals, Silver Bullet gives you a clearer view of the market and more confidence in your setups.
⸻
🔹 Trading Setup #1: Macro Time
The Macro Time setting offers two modes: Macro Bullet and Silver Bullet. Both help traders focus on specific times when the market tends to deliver clean moves.
• Macro Bullet is based on the high and low of a full macro session. It automatically detects the session’s range and bias, then offers optimal entries for either Long or Short setups. Once the session resolves, it provides Fibonacci-based levels for entry, target, and stop loss.
• Silver Bullet is based on ICT concepts and focuses on the hourly range for London, NY AM, and NY PM sessions. It’s designed for quick time blocks and highlights key levels as the session unfolds.
To use this setup, set Macro Time to “ICT Sessions” and select your preferred mode under Bullet Mode.
⸻
🔹 Trading Setup #2: Daily Range
Enable Daily Range to draw Fibonacci levels based on either the previous day’s candle or the current day’s developing range. These levels help you identify potential support, resistance, and midpoint zones throughout the day.
With the current day’s range, levels automatically update in real time as new highs or lows form — keeping your chart aligned with evolving price action.
⸻
🔹 Trading Setup #3: Candlestick Patterns
Turn on Candlestick Patterns to automatically highlight clean reversal signals such as Hammers, Hanging Men, Shooting Stars, and Tweezers. Each pattern is detected using specific criteria and trend filters to reduce noise and improve reliability. They work especially well as confirmation signals around key levels or session zones.
Silver Bullet brings structure, clarity, and precision to your intraday trading. By combining time-based bias, price action levels, and pattern recognition, it helps you trade with purpose — not guesswork. Use one setup or combine all three for a complete view of the market, tailored to your style and session of choice.

Internal Pivot Pattern [LuxAlgo]The Internal Pivot Pattern indicator is a novel method allowing traders to detect pivots without excessive delay on the chart timeframe, by using the lower timeframe data from a candle.
It features custom colors for candles and zigzag lines to help identify trends. A dashboard showing the accuracy of the pattern is also included.
🔶 USAGE
We define a pivot as the occurrence where the middle candle over a specific interval (for example, the most recent 21 bars) is the highest (pivot high) or the lowest (pivot low). This method commonly allows for identifying swing highs/lows on a trader's chart; however, this pattern can only be identified after a specific number of bars has been formed, rendering this pattern useless for real-time detection of swing highs/lows.
This indicator uses a different approach, removing the need to wait for candles to form on the user chart; instead, we check the lower timeframe data of the current candle and evaluate for the presence of a pivot given the internal data, effectively providing pivot confirmation at the candle close.
An internal pivot low pattern is indicative of a potential uptrend, while an internal pivot high is indicative of a potential downtrend.
Candles are colored based on the last internal pivot detected, with blue candle colors indicating that the most recent internal pivot is a pivot low, indicating an uptrend, while an orange candle color indicates that the most recent internal pivot is a pivot high, indicating a downtrend.
🔹 Timeframes
The timeframe setting allows controlling the amount of lower timeframe data to consider for the internal pivot detection. This setting must be lower than the user's chart timeframe.
Using a timeframe significantly lower than the user chart timeframe will evaluate a larger amount of data for the pivot detection, making it less frequent, while using a timeframe closer to the chart timeframe can make the internal pivot detection more frequent, and more prone to false positives.
🔹 Accuracy Dashboard
The Accuracy Dashboard allows evaluating how accurate the detected patterns are as a percentage, with a pattern being judged accurate if subsequent patterns are detected higher or lower than a previous one.
For example, an internal pivot low is judged accurate if the following internal pivot is higher than it, indicating that higher highs have been made.
This dashboard can be useful to determine the timeframe setting to maximize the respective internal pivot accuracy.
🔶 SETTINGS
Timeframe: Timeframe for detecting internal swings
Accuracy Dashboard: Enable or disable the Accuracy Dashboard.
🔹 Style
Internal Pivot High: Color of the dot displayed upon the detection of an internal pivot high
Internal Pivot Low: Color of the dot displayed upon the detection of an internal pivot low
Zig-Zag: Color of the zig-zag segments connecting each internal pivot
Candles: Enable candle coloring, with control over the color of the candles highlighting the detected trend

Engulfing DashboardThis is an indicator that detects candles based on the **Engulfing system** I’ve studied — from **wick to wick**.
It determines whether it’s a Buy or Sell based on the **opening price** and how the candle moves.
Anyone familiar with the Engulfing system will know how to use it.
It’s especially useful for people who use only **one screen** and can’t constantly monitor multiple timeframes.
And don’t forget:
**Trend is your friend.**
Candle Size: Avg vs Current (Green/Red)This indicator shows the size of green (bullish) and red (bearish) candles, either as an average over time or just the current candle. You can choose to measure candle size by the body (Close - Open) or the full range (High - Low). It's a simple way to compare recent buying vs. selling strength and spot shifts in momentum.

*All Candlestick Patterns*This Indicator identifies key candlestick patterns like Doji, Engulfing, and Hammer, and marks potential reversal zones. Ideal for traders focusing on price action and short-term entry points. It works well on 5min to 1hr timeframes for crypto and forex.
Candle Ghosts: MTF 3 Candle Viewer by Chaitu50cCandle Ghosts: MTF 3 Candle Viewer helps you see candles from other timeframes directly on your chart. It shows the last 3 candles from a selected timeframe as semi-transparent boxes, so you can compare different timeframes without switching charts.
You can choose to view candles from 30-minute, 1-hour, 4-hour, daily, or weekly timeframes. The candles are drawn with their full open, high, low, and close values, including the wicks, so you get a clear view of their actual shape and size.
The indicator lets you adjust the position of the candles using horizontal and vertical offset settings. You can also control the spacing between the candles for better visibility.
An optional EMA (Exponential Moving Average) from the selected timeframe is also included to help you understand the overall trend direction.
This tool is useful for:
Intraday traders who want to see higher timeframe candles for better decisions
Swing traders checking lower timeframe setups
Anyone doing top-down analysis using multiple timeframes on a single chart
This is a simple and visual way to study how candles from different timeframes behave together in one place.

IL - Bull and Bear Engulfing Detector - v01Description:
This indicator is designed to identify and highlight Bullish and Bearish Engulfing
candlestick patterns on your chart. It offers a high degree of customization
through different engulfing definitions and an optional strictness filter, allowing
traders to tailor the detection to their specific criteria for these common reversal signals.
Features:
- Universal Detection: Identifies both Bullish Engulfing and Bearish Engulfing patterns.
- Configurable Engulfing Modes (via "Engulfing Definition Type" input):
1. "Body (O/C)": Traditional - current body engulfs previous body.
2. "Range (H/L)": Current H/L range engulfs previous H/L range.
3. "Body & Range (Super)": Requires BOTH "Body (O/C)" AND "Range (H/L)" conditions.
- Optional "Larger Body" Filter: Engulfing body must be strictly larger.
- Display Toggles: Options to show/hide Bullish and/or Bearish pattern signals.
- Customizable Colors: Bar colors for bullish/bearish patterns are user-configurable.
- Data Logging: Option to log detected pattern details to the Pine Logs.
- Visual Signals: Patterns marked with plot shapes and optional bar coloring.
How to Use & Interpret:
- Configure "Engulfing Definition Type", "Require Larger Engulfing Body?", display toggles,
and colors in the indicator settings.
- Enable "Log Detected Pattern Examples?" in "Debug Options" to capture data.
- BE = Bullish Engulfing (green triangle below bar). BRE = Bearish Engulfing (red triangle above).
- Use with other analysis methods for confirmation.
Disclaimer: Trading involves substantial risk of loss and is not suitable for all investors.
Past performance is not indicative of future results.

Ultimate_Priceaction_Tool for INTRADAY by Chaitu50cUltimate_Priceaction_Tool for INTRADAY by Chaitu50c
This indicator is crafted for intraday traders who rely on raw price action. It identifies support and resistance zones based on engulfing candle structures and 2-bar breakout formations. These patterns often signal meaningful reversals or momentum-based breakouts.
Key features:
• Real-time support and resistance zone detection
Uses green-to-red and red-to-green candle transitions where open and close levels align within a defined buffer. Also includes logic to capture two-bar breakout patterns that confirm directional conviction.
• Dynamic line behavior
Line width increases as the level holds for more bars, visually representing zone strength. Breakout buffers also expand with time to reduce false signals.
• Session-based resets
At the start of each new session, all zones reset automatically. This ensures only current, relevant intraday structures are shown, reducing clutter and improving focus.
• Dashed zone detection
Within the main high-low range, additional price levels are plotted as dashed lines when qualifying patterns appear. These zones are suppressed if similar ones already exist nearby.
• Fully customizable
Includes adjustable buffer range, breakout margin, dash suppression distance, line width control, and visual styling for both resistance and support zones.
Recommended usage:
This tool is optimized for the 1-minute and 5-minute timeframes. It is best suited for scalpers and intraday traders who depend on breakout reactions, pullback validation, and session structure shifts.
Use it to identify areas of interest, react to price action, and refine intraday decision-making with high precision.

4 Flags Whale PatternThis indicator detects a unique 4-bar candlestick pattern characterized by alternating bullish and bearish candles (or vice versa), where all four candles have similar body sizes within a specified tolerance.
Usage:
This pattern may indicate a consolidation phase or a potential breakout zone after indecisive price action. Traders can use it to anticipate a directional move following the "tug-of-war" between buyers and sellers.

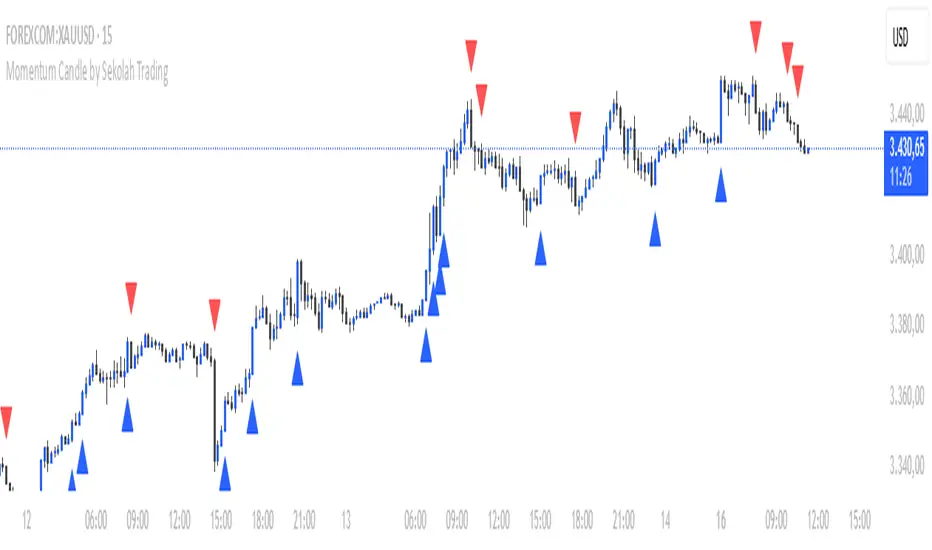
Momentum Candle by Sekolah Trading## 🔷 Introduction
**Momentum Candle by Sekolah Trading** is a proprietary price action tool that identifies high-conviction candles with large bodies and minimal wicks, based on dynamically adjusted thresholds tailored to each pair and timeframe. This script helps traders recognize moments of price acceleration that often precede breakouts, trend continuation, or sharp reversals.
---
## 🔷 What Makes This Script Unique (Originality & Utility)
Unlike traditional candle filters that rely on static size comparisons, this indicator uses:
- **Instrument-specific pip sensitivity**: Automatically detects if the pair is XAUUSD, JPY-based, or other Forex instruments.
- **Timeframe-based calibration**: Adjusts body size thresholds dynamically for 5m, 15m, 30m, and 1h.
- **Wick ratio control**: Validates only candles with short wicks (<30%), filtering indecisive moves.
- **Non-repainting logic**: Signals appear after candle close, with no future data lookahead.
This logic has been tested and refined internally by **Sekolah Trading**, designed for scalpers and intraday traders who rely on clean price action structure.
---
## 🔷 How It Works
1. **Pair & Timeframe Detection**
Adjusts `minRange` dynamically based on:
- Gold (XAUUSD), JPY pairs, or other Forex
- Timeframe: 5m to 1h
2. **Candle Structure Analysis**
- Calculates body = `abs(open - close)`
- Wick = `upper + lower shadows`
- Valid only if wick is under 30% of total candle
3. **Conditions for Signal**
- Body ≥ minRange
- Wick ≤ 30%
- Clear bullish or bearish direction
4. **Plots**
- 🔺 Blue triangle = Bullish momentum candle
- 🔻 Red triangle = Bearish momentum candle
---
## 🔷 How to Use
1. **Add to any 5m–1h chart**, ideally on XAUUSD or major Forex pairs
2. **Wait for signal triangle** to appear at the close of a candle
3. Use with:
- Trend indicators (MA, Supertrend, etc.)
- Support/resistance zones
- Breakout levels
4. **Set alerts** using:
`Momentum Candle (Body)`
---
## 🔷 Why This Script is Closed-Source
This indicator includes proprietary logic created by **Sekolah Trading** for professional and community use:
- Original dynamic pip sensitivity calibration
- Custom multi-condition filtering
- Non-reused, non-public logic with adaptive precision
The source is protected to prevent unauthorized duplication. However, all relevant logic and intent have been clearly explained above as required by TradingView’s House Rules.
---
## 🔷 Disclaimer
This indicator does not provide financial advice or guaranteed signals. Always combine with your own analysis and risk management. Historical performance does not guarantee future results.
---
## 🔷 Suggested Tags
`momentum`, `price action`, `breakout`, `forex`, `xauusd`, `jpy`, `scalping`, `candle`, `non-repainting`, `trend confirmation`
Bullish & Bearish Three Line Strike ProHello Traders!
Overview
The **Bullish & Bearish Three Line Strike Pro** indicator pin-points one of the most decisive four-candle reversal formations on any market or timeframe. Whether you trade ranges or follow strong trends, this tool spots exhaustion and offers clear entry and exit guidance.
Key Features :
Precise pattern detection: Detects genuine Bullish and Bearish Three Line Strike setups, screening out look-alikes that fail to perform on the market.
Trend filter (optional): Aligns signals with a user-defined Simple Moving Average (SMA) so you can choose to trade only with, or deliberately against, the prevailing trend.
Visual clarity: Highlights Bullish and Bearish Three Line Strike patterns with customizable colors and shapes, making them easy to spot on the chart.
Filtered-signal display: Let the script reveal which patterns were rejected by the trend filter — an invaluable learning aid.
Bullish Three Line Strike
Three consecutive bearish candles that step lower.
The fourth candle opens below (or at) the last close, then charges upward engulfing all three prior bodies.
Bearish Three Line Strike
Three consecutive bullish candles that step higher.
The fourth candle opens above (or at) the last close, then plunges below engulfing all three prior bodies.
What makes this indicator unique
Precise pattern detection: Detects genuine Bullish and Bearish Three Line Strike setups, screening out look-alikes that fail to perform on the market.
Trend filter (optional): Aligns signals with a user-defined Simple Moving Average (SMA) so you can choose to trade only with, or deliberately against, the prevailing trend.
Visual clarity: Highlights Bullish and Bearish Three Line Strike patterns with customizable colors and shapes, making them easy to spot on the chart.
Filtered-signal display: Let the script reveal which patterns were rejected by the trend filter — an invaluable learning aid.
Nuanced candle analytics: Goes beyond simple price action by considering multiple factors such as candle body ratios, wick lengths, and relative positions to previous candles.
Adaptive learning mode: Display rejected setups to reverse-engineer the logic and refine your discretionary skills.
One-glance decision making: Unified color scheme and label styling make patterns pop, even on cluttered layouts.
How to Trade with this Indicator
Use Three Line Strike Pro to fade exhaustion or re-enter a trend after a healthy pull-back.
Bullish opportunities: Watch for light blue-colored strike candles as potential entry points.
Bearish opportunities: Look for orange-colored strike candles as potential entry points.
Entry: Open the position at the next bar’s open once the strike candle closes.
Stop-loss: 2 ticks beyond the extreme of the complete four-candle pattern.
Aggressive stop-loss: For exceptionally strong strike candles (tiny opposite wick, close near extreme) trail only 2 ticks beyond the strike candle itself.
Take-profit: Aim for 2R (3R for aggressive traders), or trail behind higher lows / lower highs.
Trend Alignment
For a conservative approach, enable "Use Trend Filter" and take only those strikes that agree with the SMA slope. The SMA line is color-coded—lime for up, red for down, yellow for flat—to help you confirm bias at a glance.
Tip: If you want the candle coloring to sit on top of all other studies, drag the indicator to the top of your Object Tree.

FVG Trailing Stop [LuxAlgo]The FVG Trailing Stop indicator tracks unmitigated Fair Value Gaps (FVG) data to produce a Trailing Stop indicator able to determine if the market is uptrending or downtrending easily.
🔶 USAGE
The FVG Trailing Stop is intended to identify trend directions through its position relative to the closing price:
Bullish: Price is located above the Trailing Stop, indicating that all Bearish FVGs have been mitigated and the trend is anticipated to continue upwards.
Bearish State: Price is located below the Trailing Stop, indicating that all Bullish FVGs have been mitigated and the trend is anticipated to continue downwards.
The Trailing Stop originates from two extremities obtained from the average of respective unmitigated FVGs. The specific directional average is also displayed as a more transparent secondary line, however, the trailing stop is derived from this value and a new trend will not be detected until the opposite directional average is crossed.
Price reaching the Trailing Stop is caused by retracements and can lead to the following scenarios:
Outcome 1: The directional average is crossed next, indicating a new trend direction.
Outcome 2: The directional average is held as support or resistance, leading to a new impulse and a continuation of the trend.
🔹 Reset on Cross
While price crossing the Trailing Stop should be considered as a sign of an upcoming trend change; it is possible for the price to still evolve outside it.
As a solution, we have included the "Reset on Cross" feature, which (as the name suggests) hides and resets the Trailing Stop each time it is crossed, leading to a "Neutral" state.
This opens the opportunity for the Trailing Stop to be displayed again once the price moves again in the direction of the pre-established trend. A trader might use this to accumulate positions within a specific trend.
🔶 DETAILS
The script uses a typical identification method for FVGs. Once identified, the script collects the point of the FVG farthest from the current price when formed.
For Upwards FVGs this is the bottom of the FVG.
For Downwards FVGs this is the top of the FVG.
The data is managed only to use the last input lookback of FVGs. If an FVG is mitigated, it frees up a spot in the memory for a new FVG, however, if the lookback is full, the oldest will be deleted.
From there, it uses a "trailing" logic only to move the Trailing Stop in one direction until the trailing stop resets or the direction flips.
The extremities used to calculate the Trailing Stop are created from 2 calculation steps, the first step involves taking the raw average of the FVG mitigation levels, and the second step applies a simple moving average (SMA) smoothing of the precedent-obtained averages.
🔶 SETTINGS
Unmitigated FVG Lookback: Sets the maximum number of Unmitigated FVGs that the script will use.
Smoothing Length: Sets the smoothing length for the Trailing Stop to reduce erratic results.
Reset on Cross: When enabled, hide and reset the Trailing Stop until the price starts moving in the pre-established trend direction again.

Candle Reversal Matrix TFFCandle Reversal Matrix TFF
This "Engulfing + Shooting Star + Evening Star + Hanging Man + Dark Cloud Cover" indicator is a comprehensive candlestick pattern scanner designed to identify key bearish and bullish reversal signals on your TradingView charts.
Key Features:
Bullish Engulfing: Detects strong bullish reversals where a green candle fully engulfs the previous red candle, signaling potential upward momentum.
Bearish Engulfing: Flags bearish reversals where a red candle engulfs the prior green candle, indicating possible downtrend beginnings.
Shooting Star: Identifies candles with a small body near the low and a long upper wick, commonly marking a bearish reversal after an uptrend.
Evening Star: Detects a three-candle bearish reversal pattern characterized by a large green candle, followed by a small indecisive candle, and a strong red candle closing well into the first candle’s body.
Hanging Man: Spots small-bodied candles with long lower shadows after an uptrend, warning of potential bearish reversals.
Dark Cloud Cover: Recognizes a two-candle bearish reversal where a red candle gaps above and closes below the midpoint of the previous green candle.
Visual Cues:
Each pattern is marked on the chart with distinct colored shapes and labels for easy identification:
Green arrows and labels for bullish signals
Red, orange, purple, yellow, and maroon shapes for bearish patterns, each with unique symbols (↓, ☆, EV, HM, DC)

HTF Candle Breakout Fibonacci LevelsThis indicator automatically plots Fibonacci retracement levels on a lower timeframe (LTF) after detecting a breakout candle on a selected higher timeframe (HTF).
🔍 How It Works
When a candle on your selected HTF closes beyond the high or low of the previous candle, the indicator automatically draws Fibonacci levels on the LTF.
These levels remain visible until the next HTF candle is formed — allowing you to trade retracements with contextual precision.
⸻
⚙️ Customization Options
From the indicator settings, you can modify:
• The HTF candle timeframe (default is 1D)
• Fibonacci levels and colors
• Enable or disable “Show Only the Latest Levels” — ideal for live trading to keep the chart clean and focused.
⸻
🟪 HTF Candles Preview
After applying the indicator, you’ll see 3 vertical bars on the right edge of your LTF chart. These represent a live preview of the last three HTF candles and update in real-time.
If you prefer a cleaner chart, disable this feature via the “Show HTF Candles” toggle in the settings.
⸻
Feel free to reach out if you have any questions.
