Cash Data (NeoWave)NeoWave: Cash Data: @MikhePool channel
The NeoWave Chart - cash data: indicator is a technical analysis tool designed to visualize significant price movements by drawing dynamic lines between key highs and lows on the chart. Using a user-defined resolution, the indicator identifies new bars and connects the highest high and lowest low within each segment, updating the lines in real-time as new data becomes available. All lines are rendered in black, providing a clean and consistent visual representation of price action without color-coded directional bias. This tool is particularly useful for traders and analysts employing NeoWave theory or similar methodologies, as it helps identify structural patterns and trends in the market.
Cashdata
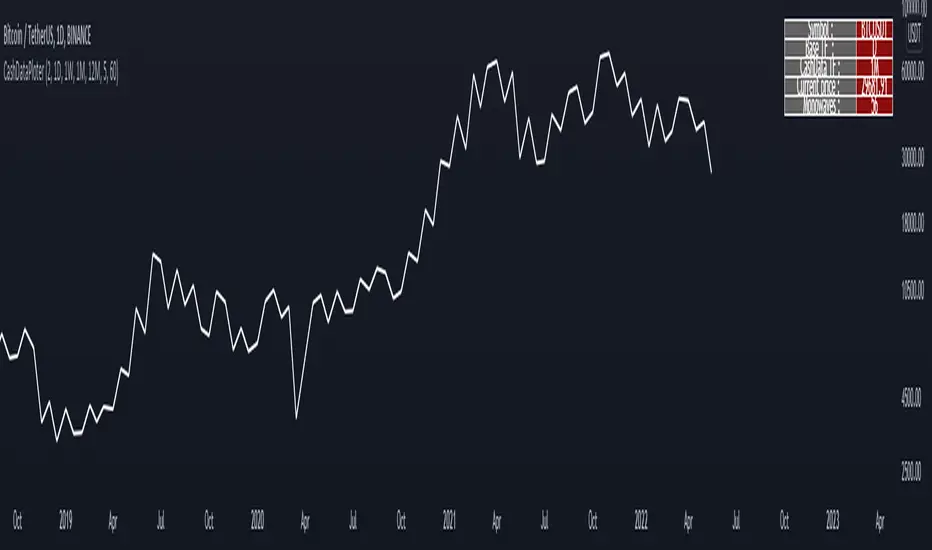
CashDataPloter Tihs indicator is able to draw cash data for :
• Annual timeframe
• Monthly, 3month, 6 month timeframe
• weekly, 2 week timeframe
• daily, 2 day, 3 day timeframe
• 6 hour, 12 hour timeframe
• 4 hour, 8 hour timeframe
• 1 hour, 2 hour, 3 hour timeframe
• 5 minute, 10 minute, 15 minute, 30 minute timeframe
other options :
• displaying information table of cash data
• choosing of cash data thickness
• choosing of bulish Monowaves color
• choosing of bearish Monowaves color
• choosing of connecting Monowaves color