Listado CCL - price of the dollar in ArgentinaThis Script print different CCL values (Argentinian dolar).
Each value is based in a different Ticker and is calculated based in ADRs and local stocks using the corresponding formula.
The Script can be used regardless of the ticker used in the Design.
The values are calculated based on the close value of the last bar.
Was not taken into account the opperated volume, therefore it is important not to make investment decisions based on the information provided by this script.
CCL

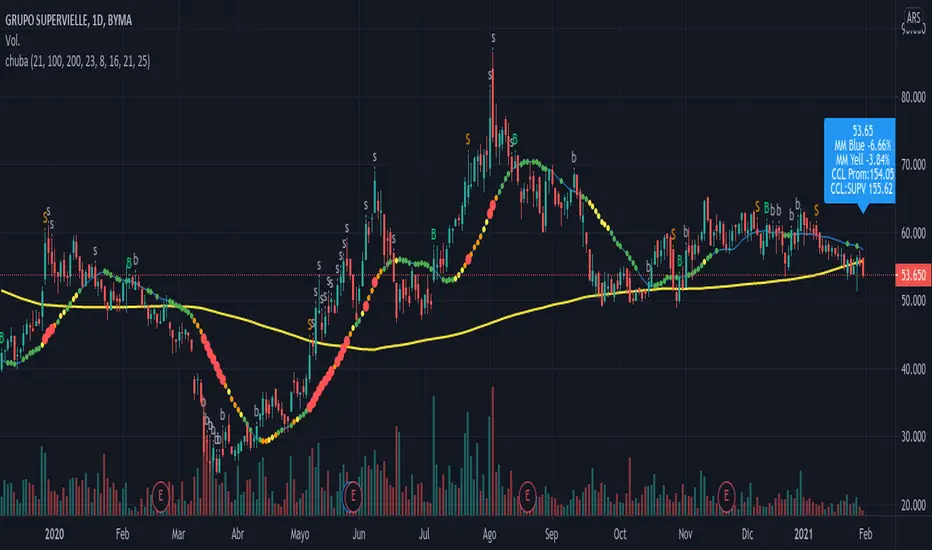
chuba indicator MM21 dispersion cclIt draws a Simple Media Mobile of 21 days (MM21days) in blue and draws a MM200days in yellow , despite the time frame is Days, Hours or Seconds.
Indicator based in Prof ALEXIS TSCHUBAROV 's strategy . It calculates the max dispersion in percent between the MM21days and the ticker price inside the time frame.
Over the last candle write a coloured globe depending on the dispersion with the latest stock price:
blue : dispersion < 8%
green : dispersion < 16%
orange: dispersion < 23%
yellow : dispersion < 25%
red : dispersion >= 25%
The globe show inside:
last stock price
Azul NN.NN% : dispersion between MM21days and the last stock price
Ama NN.NN% : dispersion between MM200days and the last stock price
CCL average ( contado con liqui dolar price in ARS )
tiker's CCL ( contado con liqui dolar price in ARS )
Colored dots over MM21days depends the value between MM21days and the max dispersion of the candle :
none dot : dispersion < 8%
green dot: dispersion < 16%
orange dot: dispersion < 23%
yellow dot: dispersion < 25%
red dot: dispersion >= 25%
Show over the candle when Buy or Sell
The criteria when buy or sell are:
When the closed stock price crosses the MM21days
When the dispersion with the MM21days exceed the 25%
Alarms:
Alarm when sell , when buy
Alarm dispersion reaches 23%
Note:
ask for more CCL tickers price.
Alexandermonday ( a brusa )
CCL Blue Chip Swap Argentina (Contado con liqui)CCL Blue Chip Swap
in spanish: Contado Con Liqui
This indicator shows color bars graph about the CCL price , this is calculated with 5 Argentine tickers that have ADRs (tikers) in USA market. These are GGAL BMA YPFD PAMP BBAR .
: Este indicador muestra un grafico de barras de color del precio de CCL Contado con Liqui.
: El CCL se calcula en base al promedio de 5 activos con ADR : GGAL BMA YPFD PAMP BBAR

MM 21 days and dispersion indicator (achub)achub indicator
It draws a Simple Media Mobile of 21 days (MM21days) in blue and draws a MM200days in yellow , despite the time frame is Days, Hours or Seconds.
This indicator calculates the max dispersion in percent between the MM21days and the ticker price inside the time frame.
Over the last candle write a coloured globe depending on the dispersion with the latest stock price:
blue : dispersion < 8%
green : dispersion < 16%
yellow : dispersion < 25%
red : dispersion >= 25%
The globe show inside:
last stock price
Azul NN.NN% : dispersion between MM21days and the last stock price
Ama NN.NN% : dispersion between MM200days and the last stock price
Colored dots over MM21days depends the value between MM21days and the max dispersion of the candle :
none dot : dispersion < 8%
green dot: dispersion < 16%
yellow dot: dispersion < 25%
red dot: dispersion >= 25%
Show over the candle when Buy o when Sell
The criterias when buy or sell are:
When the closed stock price crosses the MM21days
When the dispersion with the MM21days exceed the 25%
Alarms:
Alarm when sell , when buy
Alarm dispersion reaches 23%
All the values shown before are user configurable.


