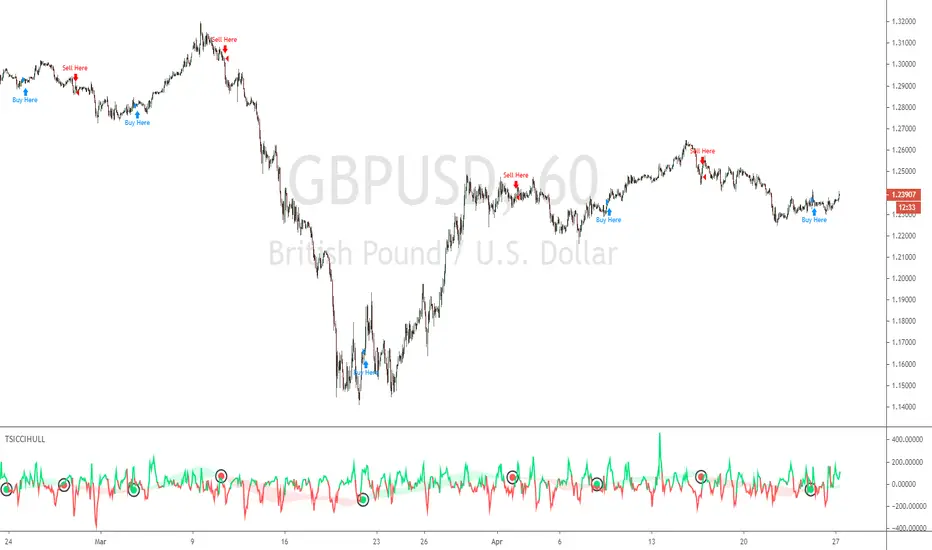
TSI CCI HullThis Strategy is Using TSI and CCI and Hull Moving Average to make swing trades on 1H chart but can be used on any pair and timeframe just change settings to suit (Hull Period mostly)
Centered Oscillators
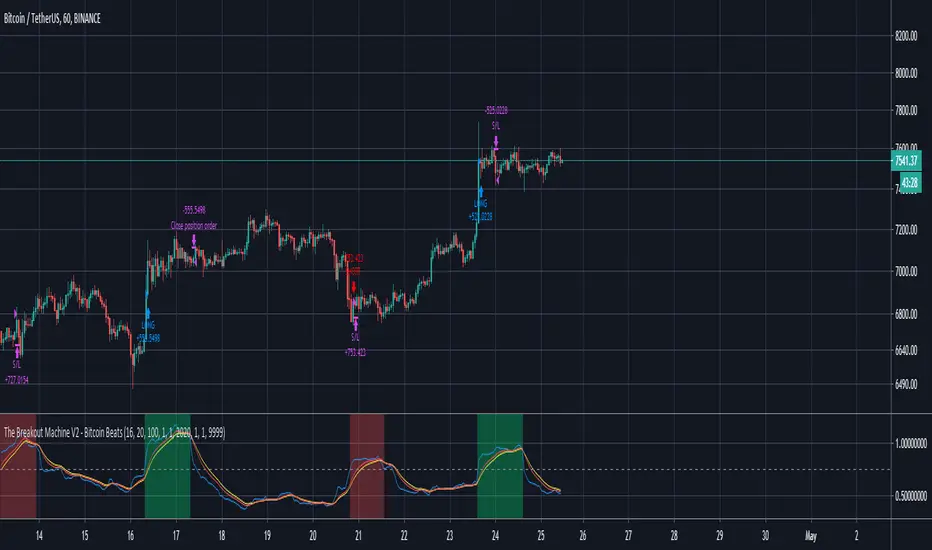
The Breakout Machine V2 BTCUSDT - Bitcoin BeatsHello, Hello, Hello and welcome back to Bitcoin Beats.
As the title suggests, this is Version 2 of The Breakout Machine. Unlike the previous version, this one has been fine-tuned to work best on Binance Futures(BTCUSDT).
The stats shown below are from 2020.
PLEASE BE CAREFUL WITH YOUR LEVERAGE AND DON'T GET REKT.
Trade at your own risk! Good luck!
This strategy takes MACD and Volume spikes to calculate pumps and dumps in the bitcoin market.
I've also added custom backtesting inputs and leverage for you all to experiment with and see the profitability of the Strategy.
Alerts version coming soon...
Thank you, And goodbye, from Bitcoin Beats.
Ichimoku Cloud & ADX & MACD with TSL [tg1]Hi There! Used the time at home during the corona to learn Pinescript and work on this strategy. Its finetuned for BTCUSDT on mid-high timeframe, can be used for other TF/markets, but be extra careful).
The strategy is mainly build around Ichimoku Kinko Hyo and its Tenkan and Kijun crosses. It aims to only buy/sell when there is a strong trend in any direction (using MAs, ADX and ATR) and enters a trade based on these conditions:
1) Tenkan > Kijun
2) Close > Kumo
3) MACD > Signal
4) ADX > Custom value
The same applies for shorts, just the other way around.
I added a TSL based on either % or ATR fixed % for improved risk management. Let me know if any questions.

ALLinBull&Bear v9.0 STRATEGYEach of my Allin Custom Indicators combined, ads to your understanding where the Market could go next. Each of them have their own purpose and set of rules.
You will weight gathered information to get a better understanding of when to ENTER or EXIT a position (SHORT or LONG).
First you need to find the right Indicator Settings and the best preforming TimeFrame for chosen crypto or fiat pair. You will do that with a "STRATEGY" Indicator. I chose either 3min TF for highly liquid assets or 15min TF for assets of low liquidity but you can choose whatever you want to up to 30min TF.
Do not stop until you find 80% or more Precent Profitable result (test different setting on different TF for best results) in Strategy Tester. You can backtest your Strategy with different settings and in different TimeFames to find the very best results for that pair.
BACKTESTING past results does not guarantee your future results. BACKTESTING is used to fine-tune your indicator.
Example: with a guitar tuner (Strategy Tester in our case) you fine-tune your guitar (our Indicators in our case) so you know what tone the guitar will produce when you hit a certain note ("in-tuned" visual interpretation of the Market in our case). It is normal to get a 100% Precent Profitable result from backtesting with very little Drawdown. More than 80% and low drawdown usually means Indicators is "in-tune".
CUSTOM INDICATOR TYPE: STRATEGY
SETUP
There are five different settings. To use them efficiently you need to understand what is their purpose and meaning.
"2nd", "3rd" and "4th" FIELD
All of my custom indicators use data from 4 different TimeFrames. First TimeFrame is the one you picked in TradingView. Now you need to set up the other three TimeFrames. To do that you need to click on the "Settings" icon on this indicator and change the "2nd", "3rd" and "4th" field. The preferred setting I use to start searching for the best performing set of Settings is 2-8-32 OR 3-9-27 OR 4-16-64 OR 5-20-80. Those numbers are multiplication of chosen TimeFrame.
Example: setting 2-8-32 on a 5-minute TimeFrame means it will gather data from 5min TF, 10min TF (5minX2), 40min TF (5minX8) and 160min TF (5minX32).
Smoother FIELD
This Field is used to average down all that data indicator it is gathering from the price chart. I use integers like for example 9, 18, 27, and any number in between. It is connected to volatility. High Volatility needs Low Number and vice versa.
Threshold FIELD
This Field is used to cancel down all the mini signal confirmations that are false due to an insignificant influence on future price movements. This number is usually best at 21. When you set all other Fields and get satisfying results you can still try and fine-tune it even more and get even better results.
HOW TO USE IT
First, you have to choose your TimeFrame. I choose either 3min TF for highly liquid assets and 15min TF for assets of low liquidity but you can choose whatever you want to up to 30min TF. Example: if you chose 30min TimeFrame and you fill the "4th" Field with the number "80", one of observed TF by the indicator will be "30minX80" or "2400min" or "40h" TimeFrame, so it is HUGE.
It always depends based on the nature of the actual pair you are looking at. If it is very volatile with a lot of volume, the market beat for this pair settings is very different from another pair with for example very little volume and low volatility. So you need to find the right Indicator Settings at the right TimeFrame for each pair you are following. You are basically tuning your Indicator like you would tune your guitar so you know what to expect before hitting those "strings" of yours.
Find the best performing setting and TimeFrame with help from a TradingView feature called "Strategy Tester". Get familiar with this feature. But rule of thumb is: everything more than 80% Precent Profitable result with Max Drawdown (negative yield from the worst closed position) lower or similar to AvgTrade is considered good enough tuning of my Indicators.
You need to reevaluate your best setting whenever your last trade gets a negative result or something big (whale manipulation) happens on the market. You need to re-tune your Indicator so it will be in tune with the Market again. Check and try to find better performing (better Precent Profitable result, lower Drawdown) settings periodically every few days to find your best yielding results.
CUSTOM INDICATOR: BULL&BEAR
HOW TO READ IT
WHITE WAVY LINE AND TWO HORIZONTAL WHITE LINES
With this one just follow the existing rules when exiting an oversold or overbought area as in RSI,CCI or SRSI indicator. When combining with the signal colored lines in the background it then makes better sense if it is a false signal and it will turn back or it is the right signal and it will exit the oversold or overbought area and advance in that direction.
IN THE BACKGROUND: NINE COLORED LINES
Rule of thumb here is the more GREEN LINES you see the more LONG/BUY the Signal is and vice versa. It helps to look at those lines a few hours back to get the "feel" where the market is pushing the price. First (1), second (2) and seventh (7) line are the most important lines and they have to be aligned and prevailed in the same color to get a viable signal but it still needs to be confirmed with other Signals.
Before making any decisions based on visualisation you should refresh the page. Indicator is very data sensitive and needs that very last data for the most accurate visual representation of the Market.

ALLinOscillator v3.0 STRATEGYEach of my Allin Custom Indicators combined, ads to your understanding where the Market could go next. Each of them have their own purpose and set of rules.
You will weight gathered information to get a better understanding of when to ENTER or EXIT a position (SHORT or LONG).
First you need to find the right Indicator Settings and the best preforming TimeFrame for chosen crypto or fiat pair. You will do that with a "STRATEGY" Indicator. I chose either 3min TF for highly liquid assets or 15min TF for assets of low liquidity but you can choose whatever you want to up to 30min TF.
Do not stop until you find 80% or more Precent Profitable result (test different setting on different TF for best results) in Strategy Tester. You can backtest your Strategy with different settings and in different TimeFames to find the very best results for that pair.
BACKTESTING past results does not guarantee your future results. BACKTESTING is used to fine-tune your indicator.
Example: with a guitar tuner (Strategy Tester in our case) you fine-tune your guitar (our Indicators in our case) so you know what tone the guitar will produce when you hit a certain note ("in-tuned" visual interpretation of the Market in our case). It is normal to get a 100% Precent Profitable result from backtesting with very little Drawdown. More than 80% and low drawdown usually means Indicators is "in-tune".
CUSTOM INDICATOR TYPE: STRATEGY
SETUP
There are five different settings. To use them efficiently you need to understand what is their purpose and meaning.
"2nd", "3rd" and "4th" FIELD
All of my custom indicators use data from 4 different TimeFrames. First TimeFrame is the one you picked in TradingView. Now you need to set up the other three TimeFrames. To do that you need to click on the "Settings" icon on this indicator and change the "2nd", "3rd" and "4th" field. The preferred setting I use to start searching for the best performing set of Settings is 2-8-32 OR 3-9-27 OR 4-16-64 OR 5-20-80. Those numbers are multiplication of chosen TimeFrame.
Example: setting 2-8-32 on a 5-minute TimeFrame means it will gather data from 5min TF, 10min TF (5minX2), 40min TF (5minX8) and 160min TF (5minX32).
Smoother FIELD
This Field is used to average down all that data indicator it is gathering from the price chart. I use integers like for example 9, 18, 27, and any number in between. It is connected to volatility. High Volatility needs Low Number and vice versa.
Threshold FIELD
This Field is used to cancel down all the mini signal confirmations that are false due to an insignificant influence on future price movements. This number is usually best at 21. When you set all other Fields and get satisfying results you can still try and fine-tune it even more and get even better results.
HOW TO USE IT
First, you have to choose your TimeFrame. I choose either 3min TF for highly liquid assets and 15min TF for assets of low liquidity but you can choose whatever you want to up to 30min TF. Example: if you chose 30min TimeFrame and you fill the "4th" Field with the number "80", one of observed TF by the indicator will be "30minX80" or "2400min" or "40h" TimeFrame, so it is HUGE.
It always depends based on the nature of the actual pair you are looking at. If it is very volatile with a lot of volume, the market beat for this pair settings is very different from another pair with for example very little volume and low volatility. So you need to find the right Indicator Settings at the right TimeFrame for each pair you are following. You are basically tuning your Indicator like you would tune your guitar so you know what to expect before hitting those "strings" of yours.
Find the best performing setting and TimeFrame with help from a TradingView feature called "Strategy Tester". Get familiar with this feature. But rule of thumb is: everything more than 80% Precent Profitable result with Max Drawdown (negative yield from the worst closed position) lower or similar to AvgTrade is considered good enough tuning of my Indicators.
You need to reevaluate your best setting whenever your last trade gets a negative result or something big (whale manipulation) happens on the market. You need to re-tune your Indicator so it will be in tune with the Market again. Check and try to find better performing (better Precent Profitable result, lower Drawdown) settings periodically every few days to find your best yielding results.
CUSTOM INDICATOR: OSCILLATOR
HOW TO READ IT
GREEN AREA on the bottom and RED AREA on top are just like the oversold or overbought areas in RSI, CCI or SRSI and uses the same principle.
Example: when a WHITE wave line crosses-UP WHITE horizontal line in GREEN area it means that it is a LONG/BUY signal/confirmation. It needs to be confirmed with other confirmation signals in that same Indicator on in a "BULL&BEAR" Indicator to get better understanding that the price would not turn back down due to a false price move in UPWARDS direction.
GREEN or RED OSCILLATOR WAVE AREAS indicates the direction price is going and how strong the "force" behind the price move is.
Example: if WHITE LINE is over the RED/GREEN LINE the area turns GREEN and it is a LONG/BUY signal. When a shadow color is on the OTHER SIDE that means it is an added confirmation for a LONG/BUY position. When a SHADOW AREA is over the GREEN AREA and turns RED it usually means there are still forces pulling the price down.
Before making any decisions based on visualisation you should refresh the page. Indicator is very data sensitive and needs that very last data for the most accurate visual representation of the Market.

Squeeze Momentum Strategy SL TP v2Improved version of my Squeeze Momentum Strategy.
Changes:
Possible to change source: ohlc4, hl2, hlc3, close
Enter your stop loss and take profit in %, NOT ticks
Working and robust even without take profit / stop loss
Yearly drawdown lower than 20%
Backtesting
Backtested on BTCPERP (FTX). It shows much better results on 1h timeframe (about 200% yearly, 55% in 2020) and relatively low drawdown to date.
Initial Capital: $1000
Capital per trade: $1000
Including fee: 0.075% (buy + sell) side, type "taker"
Strategy doesn't repaint.
Shortly about Squeeze Momentum Indicator:
This is a derivative of John Carter's "TTM Squeeze" volatility indicator, as discussed in his book "Mastering the Trade" (chapter 11).
----------
To access : sign up on FTX using ref link from my signature.

MACD on VWAPA modified version of the traditional MACD
Uses VWAP to calculate MACD instead of the usual closing price.

Volume Weighted MACDA twist on the traditional MACD indicator.
Volume-Weighted Moving Averages are used instead of the traditional EMAs.

Combo Backtest 123 Reversal & Ease of Movement (EOM) This is combo strategies for get a cumulative signal.
First strategy
This System was created from the Book "How I Tripled My Money In The
Futures Market" by Ulf Jensen, Page 183. This is reverse type of strategies.
The strategy buys at market, if close price is higher than the previous close
during 2 days and the meaning of 9-days Stochastic Slow Oscillator is lower than 50.
The strategy sells at market, if close price is lower than the previous close price
during 2 days and the meaning of 9-days Stochastic Fast Oscillator is higher than 50.
Second strategy
This indicator gauges the magnitude of price and volume movement.
The indicator returns both positive and negative values where a
positive value means the market has moved up from yesterday's value
and a negative value means the market has moved down. A large positive
or large negative value indicates a large move in price and/or lighter
volume. A small positive or small negative value indicates a small move
in price and/or heavier volume.
A positive or negative numeric value. A positive value means the market
has moved up from yesterday's value, whereas, a negative value means the
market has moved down.
WARNING:
- For purpose educate only
- This script to change bars colors.

MACD on OBVCalculates trend of OBV with help of MACD indicator. Gives a good idea of the general trend. To be used with other confirmations.
KBL Trend - Filter Pro v1KBL Trend Filter is a combination of Average true range and range breakout settings.
When KBL Trend -Filter Vertical line indicated with Green color and price cross over the candle on which the green vertical indicator came, then it is considered as a buy trades.
And same for sell trade,
When KBL Trend -Filter Vertical line indicated with Red color and price cross below the candle on which the Red vertical indicator came, then it is considered as a sell trades.
Change-log :
Few optimizations added for more smooth curves,
separated from main chart and added to separate chart window just below the main chart for easy visibility.
PM us to obtain access.

Inside Bar Momentum StrategyDescription for the strategy:
It's an inside bar momentum trade, looking for candlestick formations breakout and trading momentum with a short stop and target to 80% of the initial candle.
The entry is on a break of the original candle, stop loss is at 20% of the candle range (from the entry).
In case there's a new inside bar formation, all existing orders and trades are cancelled and new orders are placed for the new levels.
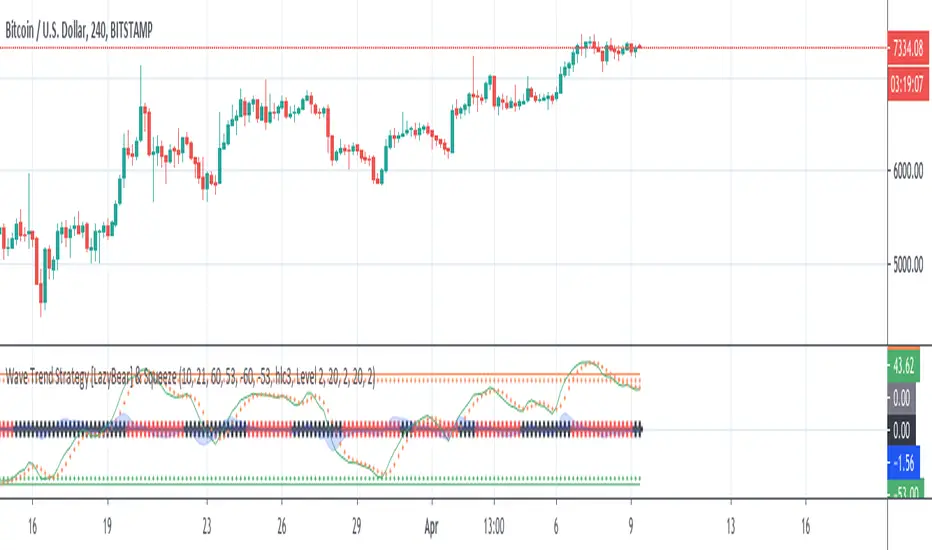
Wave Trend Strategy [LazyBear] & SqueezeThis strategy is a port of famous script Wave Trend Oscillator with a plus: squeeze indicator (LazyBear).
@author LazyBear
Original study from LazyBear
Scope of this port is to identify corrects inputs to get best results from signals that indicator gives.
The squeeze gives a further filter before orders and avoid to enter in a flat market period.
I attached it to chart with heikin ashi candles to have a better result and remove noise: results are good.
Please use comment section for any feedback.
Next improvement (only to whom is interested to this script and follows me): study with alerts on multiple tickers all at one. Leave a comment if you want to have access to study.
********************************** IMPORTANT*******************************
I have developed an expert advisor for metatrader4 (MT4): results of expert advisor form 2015-01-01 to 2018-11-25 are very good with low drawdown and good profit.
********************************************************************************
KBL Trend - MasterKBL Trend Master is Specially design to detect the upcoming and current trend using Price action and ATR based combined Trading strategy.
When KBL Trend - Master line indicated with Teal color and price is above the KBL Trend - Master Line , Then the trend is in buy side and a buy trade is preferred.
And same for sell trade,
When KBL Trend - Master line indicated with Orange color and price is Below the KBL Trend - Master Line , Then the trend is in sell side and a sell trade is preferred.

StarbuxI made this in starbucks .
Bullish hammer trading signal algorithm
using MACD for trend determination and holding period.
BEST ATR Stop Multiple StrategyHello traders
Here we go again.... with another strategy snippet.
Reminder: it's an alternative of this Trailing Stop strategy script
Entry logic
The entry is based on a Simple Moving Averages (SMA) cross.
This part doesn't matter here - as I wanted to focus on the ATR multiple stop loss component.
ATR STOP
This strategy snippet uses an entry stop loss defined based on a multiple of the average true range value.
The soure code detects ATR value at entry price, applies the multiplier and will set a static (= non trailing) stop-loss to each position
A pinescript v4 label will appear for each new signal displaying the ATR*multiplier value at signal time
All the BEST
Dave

Combo Backtest 123 Reversal & Dynamo This is combo strategies for get a cumulative signal.
First strategy
This System was created from the Book "How I Tripled My Money In The
Futures Market" by Ulf Jensen, Page 183. This is reverse type of strategies.
The strategy buys at market, if close price is higher than the previous close
during 2 days and the meaning of 9-days Stochastic Slow Oscillator is lower than 50.
The strategy sells at market, if close price is lower than the previous close price
during 2 days and the meaning of 9-days Stochastic Fast Oscillator is higher than 50.
Second strategy
In July 1996 Futures magazine, E. Marshall Wall introduces the
Dynamic Momentum Oscillator (Dynamo). Please refer to this article
for interpretation.
The Dynamo oscillator is a normalizing function which adjusts the
values of a standard oscillator for trendiness by taking the difference
between the value of the oscillator and a moving average of the oscillator
and then subtracting that value from the oscillator midpoint.
WARNING:
- For purpose educate only
- This script to change bars colors.
Dominator Ladder StrategyThe Dominator is a technical indicator. Based on algorithm calculations, this indicator extrapolates the previous price for the next bar.
Here is how Dominator is calculated:
1. The study estimates the price projected for the next bar. The estimated price is based on the algorithm method.
2. The study extrapolates this value to find a projected price change for the next bar.
The resulting extrapolated value is shown as a histogram on a lower subgraph. By default, sections of the histogram where the extrapolated value is increasing are shown in green; sections corresponding to the decreasing value are shown in red.
Note: Value projection is purely mathematical as all calculations are based on algorithm averaging of previous values.
Note: lower subgraph it's just for you to understand and view the waves during the Strategy process Study it's not included in this strategy.
Overlay True
The strategy includes 3 different adjustable levels for the ladder , plus automatic adjustable stop loss and takes profit calculated from your average entry price after each ladder adds.
Adjustable BAcktest Window.
1 long signals
3 ladder long add signals
1 short signals
3 ladder short add signals
1 dynamic stop calculated from your average entry price
1 dynamic take profit calculated from your average entry price

DEMA Strategy with MACDThe Double Exponential Moving Average (DEMA) indicator was introduced in January 1994 by Patrick G. Mulloy, in an article in the "Technical Analysis of Stocks & Commodities" magazine: "Smoothing Data with Faster Moving Averages"
It attempts to remove the inherent lag associated to Moving Averages by placing more weight on recent values. The name suggests this is achieved by applying a double exponential smoothing which is not the case. The name double comes from the fact that the value of an EMA (Exponential Moving Average) is doubled. To keep it in line with the actual data and to remove the lag the value "EMA of EMA" is subtracted from the previously doubled ema.
DEMA is a very responsive system. A lot of signals can be generated only when trading with DEMA. In this strategy, I combined Dema buy-sell signals with MACD indicator. When you activate MACD confirmation from settings; When DEMA comes to long situation, the MACD histogram is checked to be positive.

Trend Trader Strategy with MACDThis is plots the indicator developed by Andrew Abraham in the Trading the Trend article of TASC September 1998
The strategy I use has already been published explicitly by HPotter, you can review the core code from there.
I have converted the existing strategy codes that have been published into the strategy and the result looks great but I noticed that the indicator performed too much in short periods like 1 minute and I thought it would be healthier to get MACD approval. MACD approval will come selected by default. When the indicator reaches the buy status, if the macd histogram is positive, it enters the long process. By removing this confirmation from the settings window, you can see the normal signal frequency of the indicator.
This strategy is mainly based on trend signals. In fact, I am publishing this strategy to use in alternating trading for Bear-Bull crypto coins.
What does the bear-bull comparison mean?
You can open the same chart in the ETHBEAR / USDT symbol as opposed to the ETHBULL / USDT symbol that appears on the chart. When BUY signal comes in bull symbol, SELL will come in bear symbol. When BUY signal comes in bear symbol, SELL will come in bull symbol. In this way, very fast and very high profit can be obtained by alternating operation.

Laguerre RSI by KivancOzbilgic STRATEGYBacktesting.
" Laguerre RSI is based on John EHLERS' Laguerre Filter to avoid the noise of RSI .
Change alpha coefficient to increase/decrease lag and smoothness.
Buy when Laguerre RSI crosses upwards above 20.
Sell when Laguerre RSI crosses down below 80.
While indicator runs flat above 80 level, it means that an uptrend is strong.
While indicator runs flat below 20 level, it means that a downtrend is strong. "
Developer: John EHLERS
Author: KivancOzbilgic

Crypto_Melih StrategyThis indicator is formed by combining 3 different indicators.
1 - MOST: Moving Stop Loss Indicator
2 - Inverse Fisher Transform on STOCHASTIC
3 - MACD
When MOST gives BUY signal; If Inverse Fisher Transform on STOCHASTIC and MACD states are positive, the process is entered.
When the MOST gives the SELL signal, the process is exited.

ARKADIY V1.0This strategy is made for trading Bitcoin (BTC) using data from BITMEX exchange on 4 hour timeframe.
There is also a special indicator for the strategy to receive alerts on your tradingview platform which is very handful to enter the market as soon as there is a buy/sell signal.
Strategy is based on Pine script v.4 and it uses several indicators and oscillators (modified RSI, CCI, ADX, TRIX and EMA) to generate a buy/sell signal for BTC.
There is no repaint, which means that a signal will not disappear when price goes in wrong direction.
And this is one of the advantages of the strategy over other 90% strategies.
The strategy is a SWING strategy, which means that a signal for opening a position (buy or sell) at the same time closes previous position.
Because of its specificity the strategy doesn’t have take profit/stop loss options and doesn’t use leverage.
The strategy has a backtest statistics on TradingView. 2018 – 1197%, 2019 – 79%, until March 13, 2020 – 88% of net profit.
Max drawdown (the sum of non-profitable trades until receiving a profitable trade) during a year not more than 14%.
To get access to the strategy write in comments and in private messages.
_____________________________________________________________________________________________________________
Данная стратегия работает на инструменте биткоин ( BTC ) по котировкам биржи BITMEX на 4 часовом таймфрейме, а также имеет удобные алерты для сигналов на сделку (будильник).
Это позволит Вам заниматься своими делами, не следя за тем, что происходит на рынке, но в нужное время совершить сделку, получив предупреждение на телефон / компьютер.
Стратегия построена на последней версии Pine Script, в ее основе лежит совокупность множества индикаторов и правил (модифицированные RSI, CCI, ADX, TRIX and EMA), которые в определенный момент дают сигнал на покупку или продажу BTC . Стратегия протестирована с использованием аргумента "Recalculate After Order is Filled" и подразумевает "non-repaint" базис. Другими словами, если стратегия показала вход в сделку (по итогу закрытия свечи) - то сигнал так и остается без изменений. Это выгодно отличает данную стратегию от 90% таковых в Trading View и дает уверенность, что появившийся сигнал не исчезнет в случае, если рынок пойдет в противоположную сторону.
Данная стратегия относится к сегменту SWING стратегий, когда один сигнал является одновременно закрытием одной сделки и открытием противоположной.
В связи со спецификой стратегии она не использует стоп-ордера, поэтому предполагает торговлю без плечей.
Ваш риск ограничен временным интервалом от момента, как цена пошла в противоположную сторону, до момента пока стратегия не дала сигнал на перекладку в новую сделку.
Статистика, подтвержденная бэктестом в Trading View, за последние пару лет: 2018 - 197%, 2019 - 79%, на 13.03.20 - 88%. Это данные по Чистой прибыли на вложенный капитал.
Максимальная длящаяся просадка (совокупность минусовых сделок до момента возникновения плюсовой сделки) в течение года составляет не более 18%
Основные отличия от индикаторов наших коллег:
+ Результаты бэктеста не в excell, а в платформе Trading View – прозрачная статистика по сделкам
+ Построен на принципах non-repaint basis – сигналы не исчезают и не появляются из неоткуда
+ Работает на 4Н таймфрейме. Это значит сделки не могут быть чаще, чем в раз в 4 часа. Занимайтесь своими делами, пока стратегия стоит на страже рыночного анализа. Она сама Вам сообщит, когда нужно открыть / закрыть сделку.
+ Разберется любой! Стратегия построена по принципу one-click setup
+ Поддержка с возможностью организации телефонного звонка.
Для предоставления доступа к данной стратегии - пожалуйста пишите в комментариях запрос с копией в личные сообщения. Мы быстро с Вами свяжемся.
