TC Chart Score 1.3 BETAIn version 1.3 I am switching it back to a study.
We have changed the formula for calculating the score with 9 buy conditions, each one allowing 1 point.
The idea is to predict a strong bullish reversal
To use this combine it with bullish candles ideally to confirm a buy signal.
This combines momentum, volume, money flow, and other indicators to show the strength of reversal probability.
Strongest possible score is 9.
I added a slow and fast moving SMA as well to smooth the score.
Chart

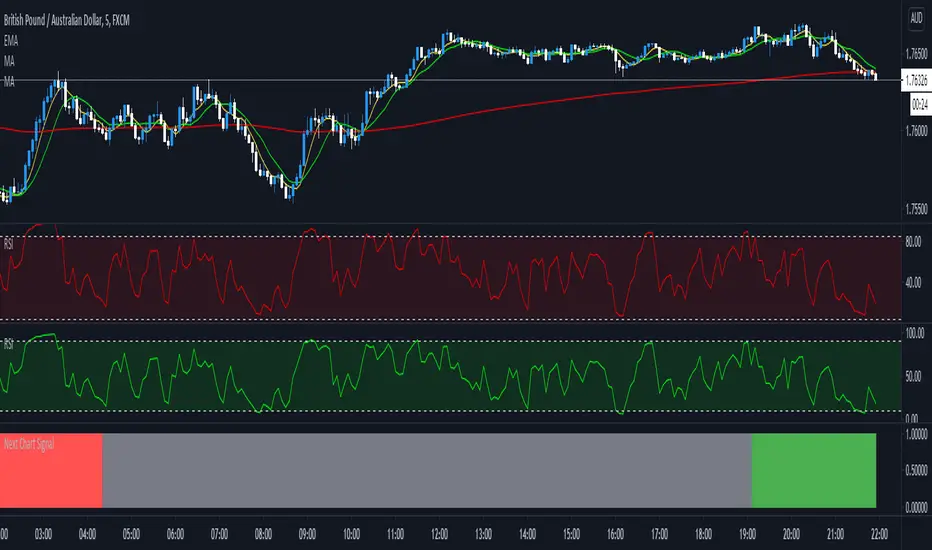
Next Chart SignalGives you the signal when 3 MA's are crossing from the higher time frame above the current chart.
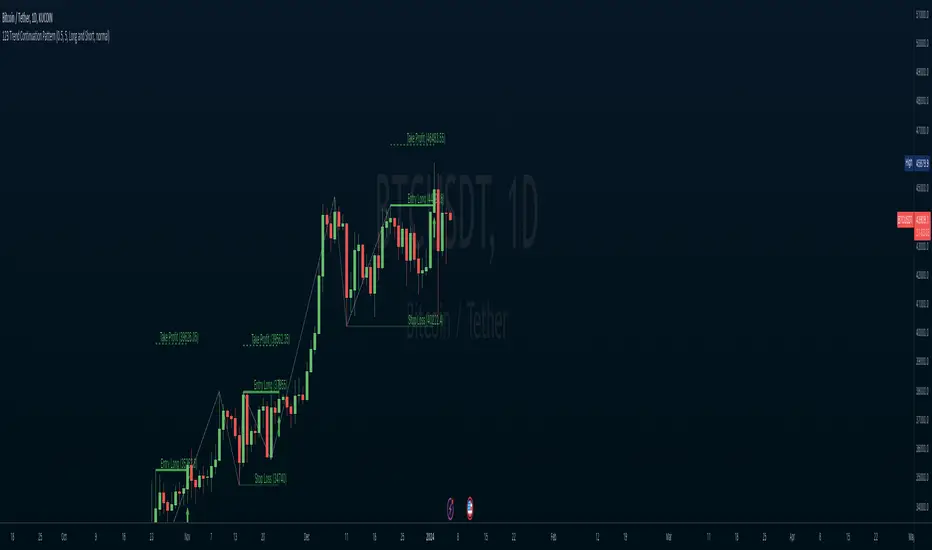
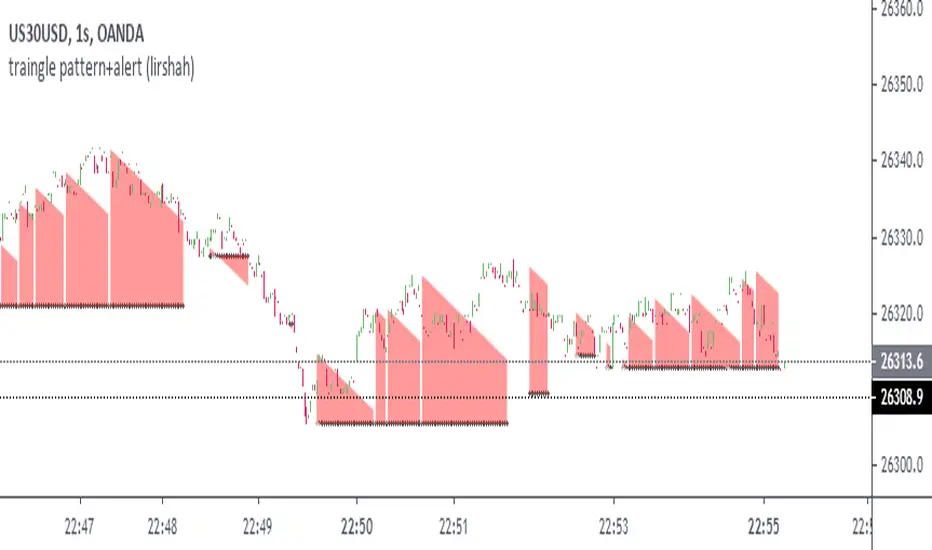
123 Trend Continuation PatternThis simple indicator will help identify the 123 Patterns on the charts. It's build based on the zigzag indicator, which will work as a guideline to identify the 3 points. As soon as the price crosses the third point, the indicator will draw 3 lines: entry, take profit, and stop loss. Those lines will work as a reference and may help with other indicators. This kind of analysis will work on any time frame and symbol, but those markets that have high volatility may have better result
GAPS Checker v2 PROUsing this indicator allows you to indentify large GAPS directly in your stock chart at first glance. The algorithm of the indicator *Gaps Checker v2* was optimized in this new indicator as well as it using the new pine script version v4. For backwards compatibility reasons this indicator is published.
This indicator is available in two versions ‘Lite’ and ‘PRO’. The difference is the calculated precision and the percent inputs in integer numbers or more granular in float values.
It uses two different sorts for large GAPS (yellow, e.g. larger than 2%) and for very large GAPS (red, e.g. larger than 4%). These values can be changed in the indicator settings.
Hope this helps many of you to be more efficient in your chart analysis - have fun!

NSDT Chart Background ColorThe chart background settings from Tradingview only allow you to select a color from the built-in color grid, which is limited. This feature adds the ability to change the chart background color "shading" which allows you many more color options to fit your needs.

MATRIX Flow Chart V.3DepthHouse Volume Flow indicator is used to help determine trend direction strictly based on Negative and Positive volume data.
How to Read:
- Moving Average crossovers are used to help determine a possible trend change or retracement.
- The area cloud on the bottom is calculated by the difference of the moving averages. This could be used to help determine the trending volume strength.
- Bright colored volume bars are large volume spikes calculated by the x factor in the options.
Other changes:
- DepthHouse is going open source with numerous of its indicators. This is only one of many!
- Volume is now displayed without being altered for calculations.
O indicador de fluxo de volume DepthHouse é usado para ajudar a determinar a direção da tendência estritamente com base nos dados de volume negativo e positivo.
Como ler:
- Média móvel crossovers são usados para ajudar a determinar uma possível mudança ou retração de tendência.
- A nuvem da área na parte inferior é calculada pela diferença das médias móveis. Isso pode ser usado para ajudar a determinar a força do volume de tendências.
- Barras de volume coloridas brilhantes são grandes picos de volume calculados pelo fator x nas opções.
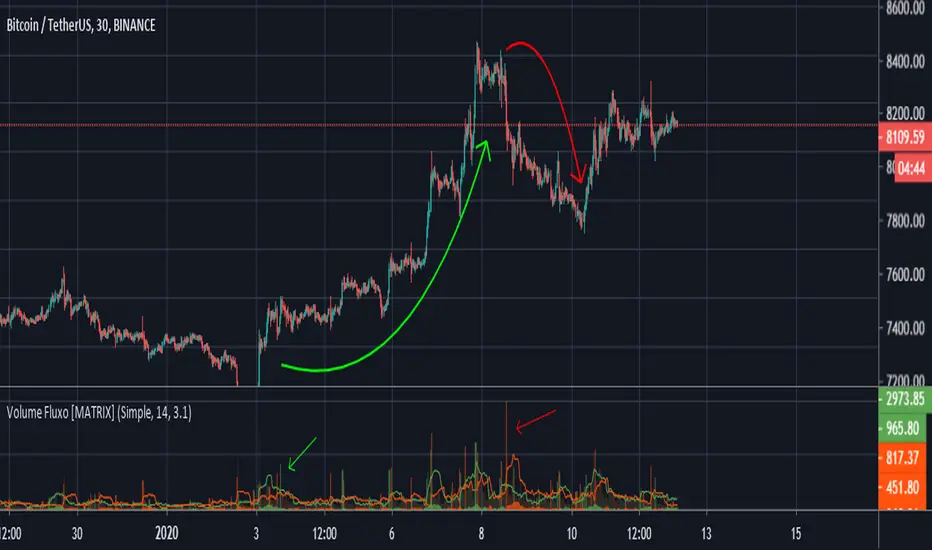
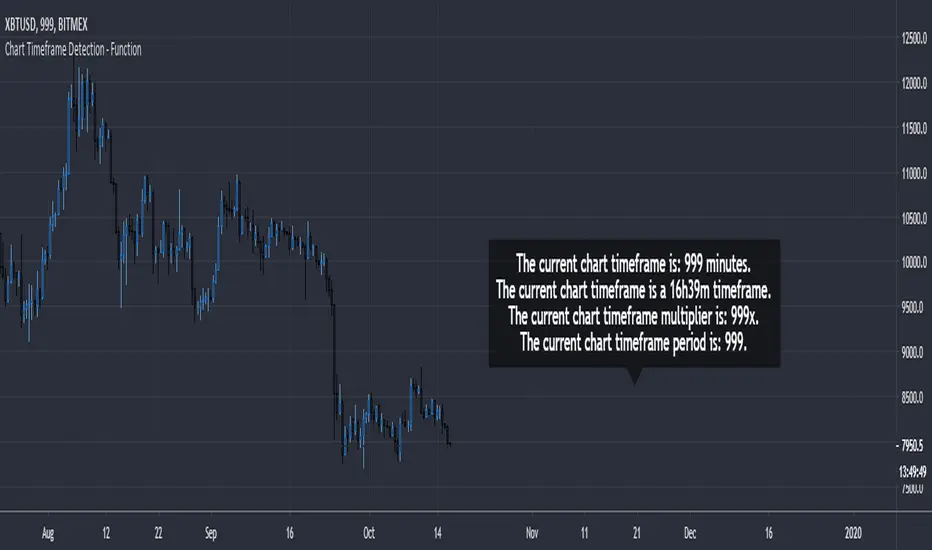
Chart Timeframe Detection - FunctionChart Timeframe Detection - Function
A small and effective function to detect the current chart timeframe in minutes.
It can be used to further detect a specific chart timeframe (a daily timeframe or even a 16h39m timeframe).
The result is returned as integer.
[RESEARCH] Heikin-Ashi Chart IdentifierA deterministic approach to identify Heikin-Ashi chart type.
The script checks the next statements about HA:
HA chart does not have any gaps in a classic sense
Every new HA open price is calculated using a specific recurrence formula. This fact also means that initial HA open price is used to calculate all the next and so on (a construction of Infinite Impulse Response filters)
The script works correctly being applied to other chart types:
Classic Candlestick
Range Bars
Line Break
Traditional Renko
ATR Renko
Traditional Point-and-Figure
ATR Point-and-Figure
Kagi
For special ones: this code allows you to check whether your script is being executed with Heikin-Ashi candles or not inside your script.
Ev sistr 'ta Laou!

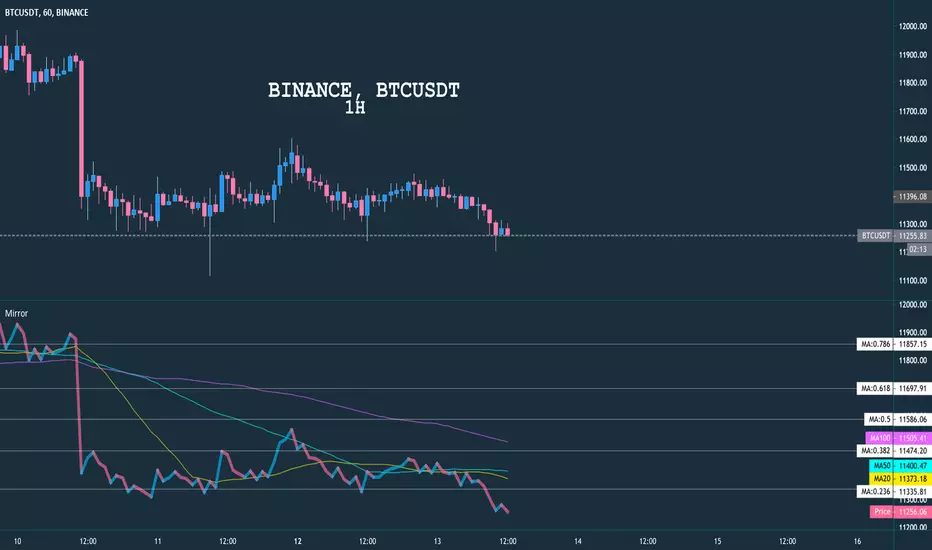
Mirror Chart MultitimeframeDescription
Allow user to display any chart from any timeframe with indicator Moving Average and Auto Fibonacci
Setting
Chart From , please enter your index symbol, example: BINANCE:BTCUSDT or ETHBTC
Timeframe , which time frame to show the chart (no impact with main chart)
MA 20, MA 50, MA 100 , check any MA that you want to display
Fibo Range , enter total candle that will be used for fibo
Show Fibo 0-1 , show fibo line from 0, 0.236 and so on to 1
Example
It shows many charts with different timeframes
RSI Chart by Atilla YurtsevenRSI Chart helps me to spot divergences easily. Give this a try.
Disclaimer: This is not financial advice
Trade safe,
Atilla Yurtseven


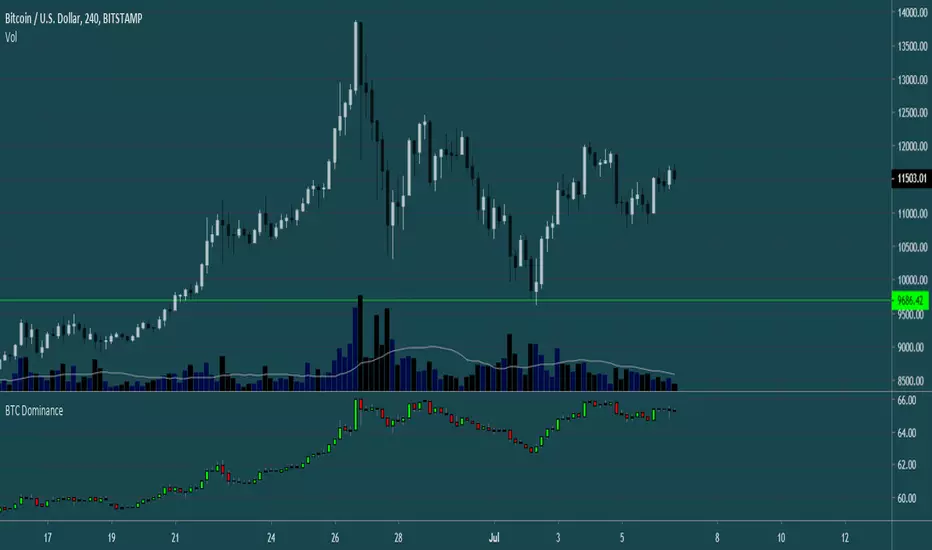
BTC DominanceThis Script plots the BTC Dominance chart in an indicator window, so you don't have to bother with tabs as much when doing your analysis.
tips are always welcome at: (38uGQJDDZDL6wX48x4gYTccPeQ3ZHVYmY4)
I hope you enjoy the script :)
Tower Line IndicatorHere is the code of twr indicator
I'v already posted a idea about this indicator. You guys can make this chart more complete if you want.
Complete indicator is just fixed the color align in some price pattern.
The rule is hard to write for me but we have simple version here. :)
Read more about tower line:
Tower line here
Need help about tower line(To add the color align when price expand or other situation)
Detail about tower line
Have you heard about tower line
IO_Heikin-Ashi OverlayThis is Traditional Heikin-Ashi bars overlayed with regular candlestick/any chart type
Although HA is available in TradingView by default, this script is to recalculate HA by traditional calculations.
This version REPAINTS!! This is because Traditional HA uses Close Price (which is calculated on the fly).
-- Invsto

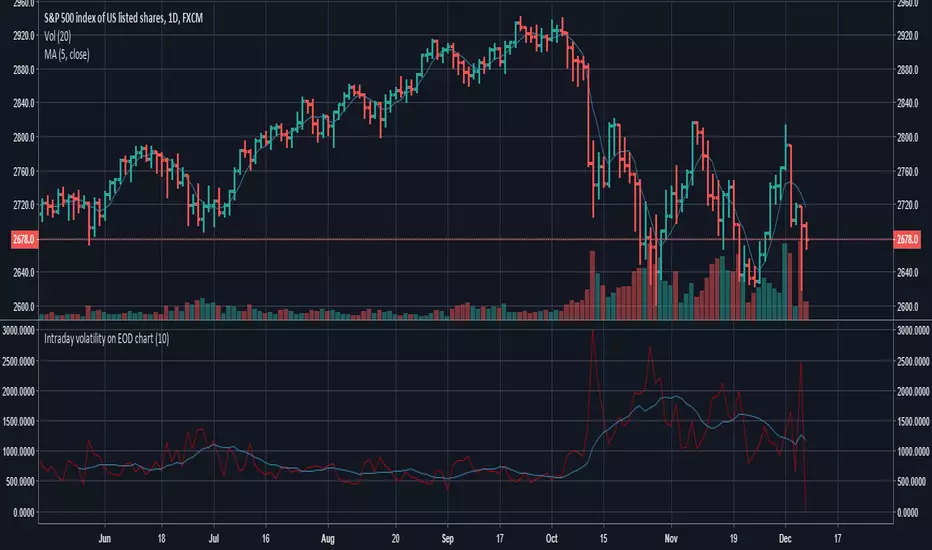
Intraday volatility on EOD chartThis indicator will allow you to compare Daily bars with Intraday insight.
Indicator draws the sum of high-low intraday bars on EOD timeframe.
The purpose is to compare TR or ATR with intraday data, because high-low on 1 daily bar says little about intraday bars inside.
You can replace the function (cum(high - low)) with whatever you need to calculate on intraday bars.
RSI BackgoundPlots a Green/Red strip on the price chart to highlight when RSI goes overbought or oversold.
You can optimize it by yourself on the source code, just change "70" or "30" for your desired value.
Cheers!

top&bottomYou can find "Top&Bottom" on chart by this indicator. This is described by TMA theory.
I reccomend using this for scalping trade.
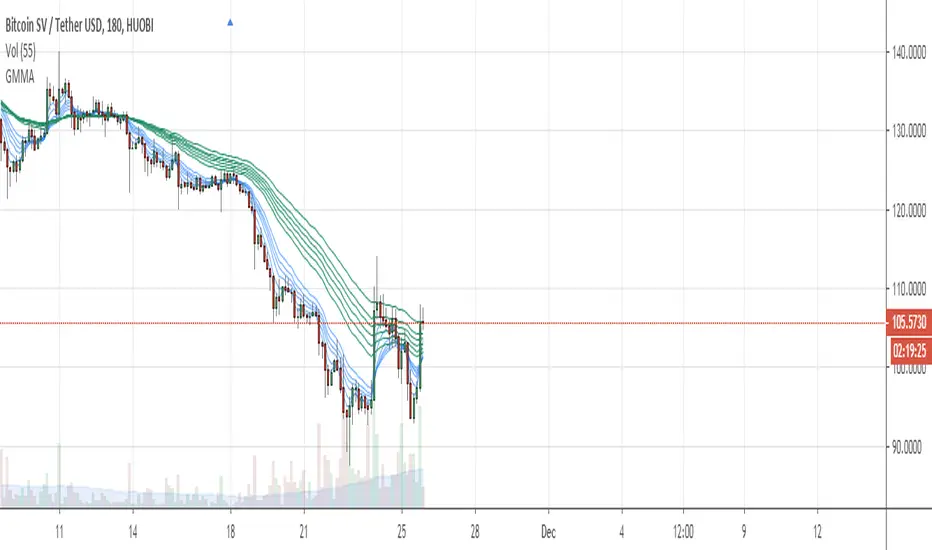
8-10 MAs Net chart ema/smatihs script can select SMA/EMA's Moving Average Net chart , anyone you want.
Basically this net chart supply 8 MAs and also you can use additionally 2 more Moving Averages.


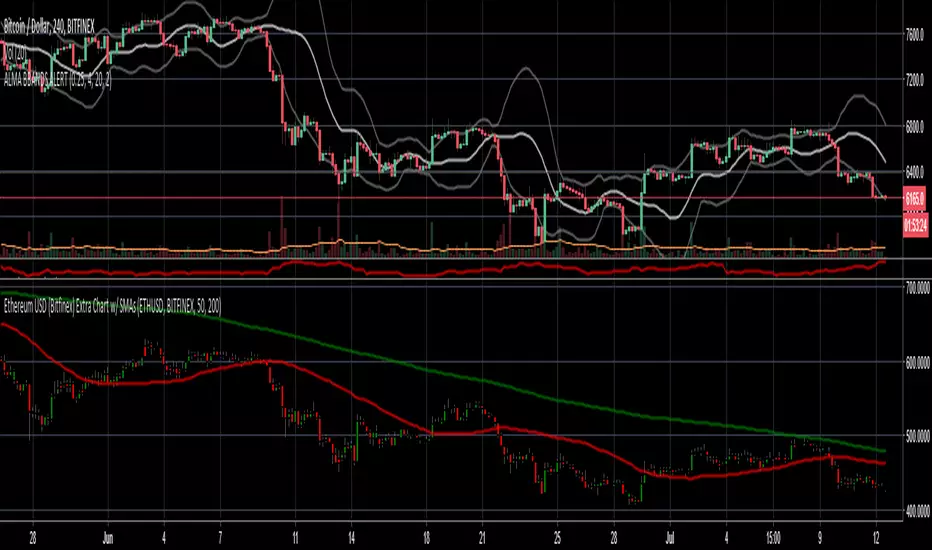
Extra Chart / SMAsThis allows you to load an additional security on your chart with two SMAs. Default it is set to BITFINEX:ETHUSD with a 50 SMA and 200SMA.
I can add additional indicators by request. I also do custom indicator development, those interested feel free to contact me.
To change which security is displayed, simply go into indicator settings and add the symbol with the format EXCHANGE:TICKER
You can change MA lengths under indicator settings as well.
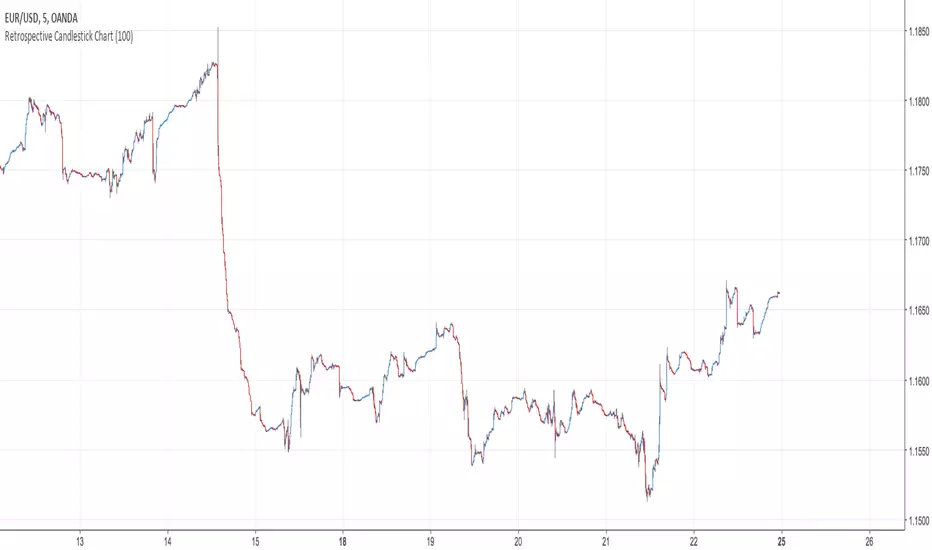
Retrospective Candlestick ChartWhen i was in Japan with some traders colleagues we talked about traditional charting tools from this country and how they changed the way we look at our charts today. Then suddenly one of the japanese traders i have met earlier said "Why not making another charting tool ? Smoother than Heikin-Ashi and including all the information a trader may need but easier to interpret".
So i had the idea of averaging the input and the output of the respective close / open / high and low price using a recursive exponential window functions, each values will be closer to their true value if they are volatile, if they are not then those values will look smoother, the length input represents the reactivity of the candles, high values represents smoother results but less reactive.The goal of those candles is to make all the information easier to interpret by a trader.
500 input length , the price look smoother, supports and resistances are easier to make.
The interpretation of highs and lows are important, the Retrospective Candlestick Chart save you time by showing only huge movements.
Weis Wave ChartThis indicator is based on the Weis Wave described by David H. Weis in his book Trades About to Happen: A Modern Adaptation of the Wyckoff Method, more info how to use this indicator can be found in this video . The Weis Wave is an adaptation of Richard D. Wyckoff’s method Wave Charts. It works in all time periods and can be applied to all asset types.
Unlike other implementations I found here on TradingView, this implementation make use of a Renko-like zig zag pattern, very similar to how it is described in David H. Weis' book. The settings for the zig zag pattern are very similar to the standard Renko settings here on TradingView, in the "Renko Assignment Method" you either chose "ATR" or "Traditional" (read more about it here ). The ATR length or the brick size is then entered in the textbox "Value". You can also chose another setting in the "Renko Assignment Method" drop down named "Part of Price" which calculate the brick size from the current close and divide it by the value in the text box "Value". It is also possible to chose if the zig zag pattern shall use the high/low, the open/close or just the close as the most extreme values in its calculation, you select this in the drop down "Price Source".
TradingView's pine script does currently not support to print non-static text on the chart, so it is not possible at this point to write out the volume on the zig zag chart. It is also not possible to have both an overlay and separate chart pane in the same indicator, therefor this indicator is split up in two.
You can find the volume indicator here:
