Multi conditions, curve fitting strategies - indicators combinedThe goal of this script is to educate about curve fitted strategies.
You can use it to combine multiple indicators with many parameters, for both entry and exit, all at once, in order to evaluate their combined effect with either AND or OR operators.
Available technical indicators:
- Intra Bar Strengh (IBS)
- Fisher Transform
- Buy the dip (after *nb* falling bars)
- Timing (mondays | fridays)
- Timing (Five days low etc ...)
- SMA
- EMA
- RSI
- Higher Timeframe RSI (choose a HTF)
- HML
- Accumulation / Distribution
- Stochastic
- Point of control moving average (from me)
Buy orders options:
- Limit order percentage from entry point
- Stop order percentage from entry point
- Entry price source
- Nb of bars behind entry point (as price reference for order)
Sell orders option:
- Exit price source
- Nb of bars behind exit reference point
Take profits and stop losses:
- Take profit percentage
- Stop loss percentage
- Only take profit from exit signal if higher than entry take profits
Other parameters:
- Put a limit to the number of exit signals
- Always trigger exit signal after {n} bars
It is *highly* encouraged to use the "skip random trades" checkbox in order to add some noise and see the outcome of the strategy if the market would have played differently for the asset.
Of course the whole point of this little dashboard is to see that a performance chart depends on market conditions, performance is often more random than predictable and curve fitting doesn't create nice equity curves.
This script is a provided entirely free of charge and open source. It is based on my multi-conditions matrice library.
Combining
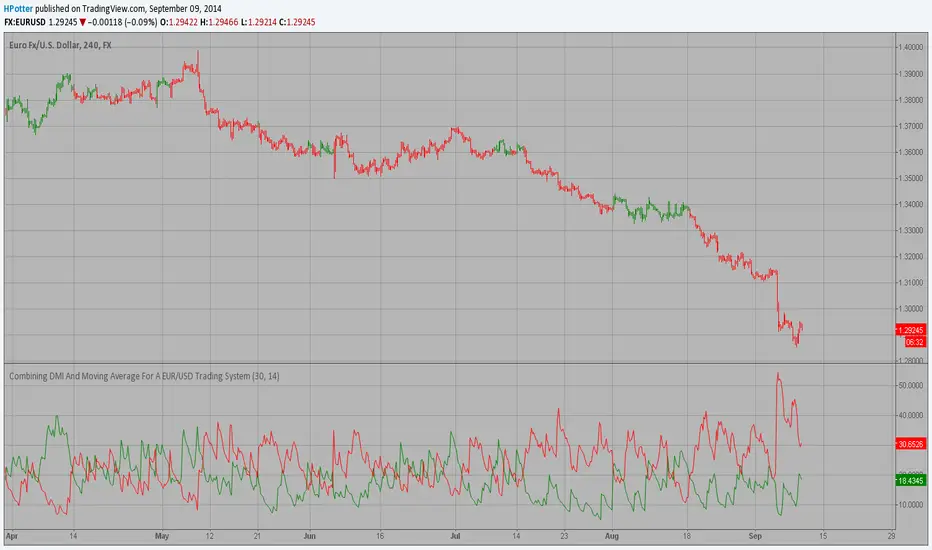
Combining DMI And Moving Average For A EUR/USD Trading SystemCombining DMI And Moving Average For A EUR/USD Trading System, by Rombout Kerstens
The related article is copyrighted material from Stocks & Commodities Aug 2009
Combining Exponential And Volume WeightingThe related article is copyrighted material from Stocks & Commodities 2009 Oct