swing indicator Installation & Configuration - swing Indicator
⚙️ Parameter Configuration
"Settings" Group (General Parameters)
Show Moving Average: Show/hide the OI moving average
✅ Recommended: Enabled to visualize the trend
Helps identify if OI is above or below its average
MA Period: Moving average period (default: 20)
📊 Common values:
20: Short/medium term trend (responsive)
50: Medium term trend (balanced)
100: Long term trend (stable)
Compare with Volume: Display normalized volume in background
💡 Useful to compare OI evolution with volume
Helps identify divergences between Open interest (oi) and Volume
OI Significant Change Threshold: Detection threshold for significant changes
Available options: 10%, 15%, 20%, 25%, 30%, 40%
🎯 10-15%: High sensitivity (many signals, possible noise)
🎯 20-25%: Normal sensitivity (moderate signals, recommended)
🎯 30-40%: Low sensitivity (rare but very significant signals)
⚡ This threshold determines when green/red triangles appear
Manual OI Symbol (optional): Manually enter the OI symbol
📝 Leave empty for automatic detection
⚙️ Use only if your symbol is not automatically recognized
Manual example: COMEX:GC1!_OI for gold
"Visual Signals" Group
Show Triangles (Significant Changes): Show/hide triangles
▲ GREEN Triangle = Significant OI increase (> configured threshold)
▼ RED Triangle = Significant OI decrease (< -configured threshold)
✅ Recommended: Enabled to see important changes
💡 Disable if you find the chart too cluttered
Show Circles (MA Crossovers): Show/hide circles
● GREEN Circle = OI crosses MA upward
● RED Circle = OI crosses MA downward
✅ Recommended: Enabled if you use MA crossover strategy
💡 Disable if you focus only on OI variations
"Style" Group (Color Customization)
OI Color: Main Open Interest histogram color
Default: Blue
🎨 Customize according to your visual preferences
OI Rising: Histogram color when OI increases
Default: Transparent green
Subtle display of direction
OI Falling: Histogram color when OI decreases
Default: Transparent red
Subtle display of direction
MA Color: Moving average color
Default: Orange
Should contrast with OI color
Volume Color: Normalized volume background color
Default: Transparent gray
Discreet enough not to hinder reading
📊 Reading the Information Panel
The panel at the top right of the chart displays:
By: Alphaomega18
Indicator creator's signature
⚠️ WARNING: OI symbol not detected
Only appears if OI symbol is not automatically detected
Action: Check symbol or enter manually
Open Interest
Current Open Interest value
Format: number of contracts (e.g., 485.2K = 485,200 contracts)
Change
OI % change from previous bar
🟢 Green = OI increase
🔴 Red = OI decrease
Ex: +2.45% = OI increased by 2.45%
Threshold
Displays configured threshold for alerts
Ex: "25%" = alerts triggered at +25% or -25%
Yellow color for visibility
MA(20)
Current moving average value
Number in parentheses indicates period
Ex: MA(50) if you configured a 50 period
Signal
🟢 Strong Trend: OI > MA → Strong participation, solid trend
🔴 Weak Trend: OI < MA → Weak participation, fragile trend
🎯 Visual Signals on Chart
Triangles (Significant Changes)
▲ GREEN Triangle (bottom of chart)
Meaning: Significant OI increase
Trigger: OI increases more than configured threshold
Example: If threshold = 25%, triangle appears when OI +25% or more
📈 Interpretation: New contracts opened = growing interest
▼ RED Triangle (bottom of chart)
Meaning: Significant OI decrease
Trigger: OI decreases more than configured threshold
Example: If threshold = 25%, triangle appears when OI -25% or less
📉 Interpretation: Massive position closing = disengagement
Circles (Moving Average Crossovers)
🟢 GREEN Circle (bottom of chart)
Meaning: OI just crossed MA upward
Signal: Open interest back above its average
📊 Interpretation: Interest returning, potential trend start
🔴 RED Circle (top of chart)
Meaning: OI just crossed MA downward
Signal: Open interest back below its average
📊 Interpretation: Decreasing interest, potential weakening
🔔 Alert Configuration
Create an alert:
Right-click on chart → "Add Alert" (or ALT + A)
In "Condition", select "Open Interest"
Choose alert type from 4 available
Configure notification options
Click "Create"
Available alert types:
OI Significant Increase
Triggers when OI increases beyond configured threshold
Example: Threshold 25% → Alert if OI +25% or more
Use: Detect massive influx of new contracts
OI Significant Decrease
Triggers when OI decreases beyond configured threshold
Example: Threshold 25% → Alert if OI -25% or less
Use: Detect massive position closing
OI crosses MA up
Triggers when OI crosses its moving average upward
Condition: OI was below MA and crosses above
Use: Identify interest returning
OI crosses MA down
Triggers when OI crosses its moving average downward
Condition: OI was above MA and crosses below
Use: Identify decreasing interest
Notification configuration:
✉️ Email: Receive alert via email
📱 SMS: Receive alert via SMS (subscription required)
🔔 Popup: Notification on TradingView
📲 App: Notification on TradingView mobile app
🔗 Webhook: Send alert to external system
💡 Advanced Interpretation
Combined OI + Price Analysis:
Open InterestPriceInterpretationSuggested Action↑ Rising↑ Rising🟢 STRONG UptrendNew buyers entering, robust trend, consider long positions↑ Rising↓ Falling🔴 STRONG DowntrendNew sellers entering, bearish pressure, consider short positions↓ Falling↑ Rising📊 Short coveringClosing short positions, potentially temporary move↓ Falling↓ Falling📊 Long liquidationClosing long positions, potentially temporary move
OI vs Moving Average:
OI > MA (Signal: Strong Trend)
Open interest above its average
Market participation above normal
Trend supported by growing interest
✅ Increased confidence in market direction
OI < MA (Signal: Weak Trend)
Open interest below its average
Market participation below normal
Potentially fragile trend
⚠️ Caution: trend lacks conviction
OI vs Volume:
Rising OI + Rising Volume
New contracts + high trading activity
💪 Very strong trend signal
Falling OI + Rising Volume
Position closing + high activity
⚡ Potential reversal or massive profit-taking
Stable OI + Rising Volume
Transfer of positions between traders
🔄 Changing hands, no new commitments
🛠️ Troubleshooting
❌ Issue: "⚠️ WARNING - OI symbol not detected"
✅ Solutions:
Check contract symbol
Make sure you're on a continuous futures contract (e.g., GC1!, CL1!)
Not on a specific contract (e.g., GCZ2024)
Enter symbol manually
Go to Settings → Manual OI Symbol
Format: EXCHANGE:SYMBOL_OI
Examples:
Gold: COMEX:GC1!_OI
WTI Crude: NYMEX:CL1!_OI
Natural Gas: NYMEX:NG1!_OI
Check data availability
Not all markets have public OI data
Verify on TradingView if OI data exists
❌ Issue: No data displayed (empty chart)
✅ Solutions:
Change timeframe
OI is generally published daily
Switch to Daily (1D) or Weekly (1W)
Intraday timeframes may not have data
Check data connection
Refresh TradingView page
Check your TradingView subscription (some data requires subscription)
Test on another market
Try with gold (COMEX:GC1!) which always has OI data
If it works, problem comes from initial market
❌ Issue: Too many visual signals (cluttered chart)
✅ Solutions:
Increase detection threshold
Settings → OI Significant Change Threshold
Change from 20% to 30% or 40%
Fewer signals, but more significant
Disable some signals
Visual Signals → Uncheck "Show Triangles" or "Show Circles"
Keep only the most important signals for you
Adjust colors
Style → Reduce color opacity
Make signals more discreet visually
❌ Issue: Not enough signals
✅ Solutions:
Reduce detection threshold
Settings → OI Significant Change Threshold
Change to 10% or 15%
More signals, but beware of noise
Enable all signals
Visual Signals → Check "Show Triangles" AND "Show Circles"
Full display of all events
Reduce MA period
Settings → MA Period → Change from 20 to 10
More responsive MA = more crossovers
📈 Compatible Markets (Auto-detection)
✅ Energy (NYMEX)
CL, CL1!: WTI Crude Oil
BZ, BZ1!: Brent Crude
NG, NG1!: Natural Gas
RB, RB1!: RBOB Gasoline
HO, HO1!: Heating Oil
✅ Precious Metals (COMEX/NYMEX)
GC, GC1!: Gold
SI, SI1!: Silver
PL, PL1!: Platinum
PA, PA1!: Palladium
HG, HG1!: Copper
✅ Industrial Metals (LME)
ALI, ALI1!: Aluminum
ZNC, ZNC1!: Zinc
NI, NI1!: Nickel
✅ Agriculture - Grains (CBOT)
ZC, ZC1!: Corn
ZW, ZW1!: Wheat
ZS, ZS1!: Soybeans
ZM, ZM1!: Soybean Meal
ZL, ZL1!: Soybean Oil
ZO, ZO1!: Oats
ZR, ZR1!: Rice
✅ Agriculture - Softs (ICE)
SB, SB1!: Sugar
KC, KC1!: Coffee
CC, CC1!: Cocoa
CT, CT1!: Cotton
OJ, OJ1!: Orange Juice
✅ Livestock (CME)
LE, LE1!: Live Cattle
GF, GF1!: Feeder Cattle
HE, HE1!: Lean Hogs
✅ Other
LBS, LBS1!: Lumber (CME)
🎓 Usage Tips
For beginners:
Start with default parameters (threshold 25%, MA 20)
Enable all visual signals
Focus on liquid markets (gold, crude oil)
Observe how OI reacts to price movements
For intermediate traders:
Adjust threshold according to market volatility (15-30%)
Combine with other technical indicators
Create alerts for significant changes
Analyze OI/Price divergences
For advanced traders:
Use multiple MA periods (20, 50, 100)
Analyze OI/Volume/Price correlation
Configure alerts on multiple timeframes
Integrate into complete trading strategy
📊 Practical Example
Scenario: Gold Trading (COMEX:GC1!)
Initial setup:
Threshold: 20% (gold volatile)
MA: 20 days
All signals enabled
Timeframe: Daily (1D)
Observation:
Gold price: Uptrend
OI: ▲ Green triangle (increase of +22%)
Signal: 🟢 Strong Trend (OI > MA)
Interpretation:
New buyers massively entering
Uptrend supported by OI
Strong market conviction
Action:
✅ Long position validated by OI
Stop loss below technical support
Monitor if OI continues to increase
✨ Made by Alphaomega18
Commodities

XAUMO MegaBar VSA by Mohamed Mahmoud XAUMO MegaBar VSA — Smart Money Breakout & Reversal Engine for XAUUSD
(Educational Use Only)
1) WHAT THIS INDICATOR DOES
XAUMO MegaBar VSA is an institutional-style smart money engine for XAUUSD designed to show you what professional money is doing, not just where price is moving.
It combines:
- MegaBar detection on 1H and 15m
- VSA (Volume Spread Analysis) events
- VPOC / WVPOC and volume clusters
- Liquidity sweeps, CHoCH, order blocks, FVGs
- Full Fibonacci leg mapping (retracements + extensions)
- Pre-built execution ladders (Entry, SL, TP1–TP4, Reverse Fib trades)
All in one dashboard with:
- Color-coded candles
- Clean, ATR-offset labels
- Optional tables and debug panels
So traders can quickly decide:
“Is this move driven by smart money, or is it just noise?”
2) CORE MODULES & FEATURES
A) SESSION + ACCUMULATION / DISTRIBUTION CONTEXT
- Session filter: London, New York, Overlap, or custom.
- Accumulation / distribution zones shaded on chart with adjustable colors/opacity.
- Quick legend so you always know if the market is in “smart money accumulation” or “distribution”.
HOW TRADERS USE IT:
Focus only on your trading session and instantly see if volume is building (accumulation), unloading (distribution), or flat. This helps you avoid trading in dead liquidity.
--------------------------------------------------
B) MEGABAR ENGINE + FIB MAP
- Automatically detects “MegaBars” (institutional candles) on 15m and 1H.
- Uses body size, range, and volume to pick only meaningful bars.
- Builds a full Fibonacci map from each active MegaBar:
• Retracements: 0, 13, 23.6, 38.2, 50, 61.8, 78.6, 86.2, 100, and -33.
• Extensions: 125% up to 600%+ (configurable ladder).
- Per-level style controls:
• Color, width, line style (solid/dotted/dashed).
• Optional price labels with ATR-based offsets.
- Main Fib legend that explains shallow / normal / deep reload zones.
HOW TRADERS USE IT:
You stop guessing where to buy or sell. You trade around the institutional leg:
- Buy dips into defined reload zones after bullish MegaBars.
- Sell rallies into extension zones after bearish MegaBars.
- Use clean, pre-mapped structure for both scalps and swings.
--------------------------------------------------
C) VSA ENGINE + CANDLE LABELING
- Detects a full set of VSA events such as:
• No Demand / No Supply
• Stopping Volume
• Absorption
• Springs / Upthrusts
• Buying Climax / Selling Climax
• Bullish / Bearish EVR
• Tests and confirmed VSA signals at S/R
- Enhances with:
• Body vs total range analysis
• Wick dominance for exhaustion vs aggression
• Momentum and volume confirmation filters
HOW TRADERS USE IT:
Each label becomes a “comment” from smart money on the chart:
- “No Demand” near resistance + weak RVOL = skip long entries.
- “Stopping Volume” + spring at Fib reload zone + VPOC cluster = potential high-quality long.
- Combine VSA with the MegaBar Fib map and volume profile for structured decisions.
--------------------------------------------------
D) SUPERSONIC BREAKOUT ENGINE
- Calculates a breakout strength score using:
• RVOL and volume expansion
• Spread expansion vs recent bars
• Body quality (body vs range)
• Bar progress (how much of the candle’s time has elapsed)
- Differentiates:
• Potential vs confirmed breakouts
• Strong, volume-backed moves vs weak spikes
- Optional debug label explaining:
• Momentum score
• Volume ratio and RVOL
• Spread behaviour
• Body quality
• Bar elapsed %
HOW TRADERS USE IT:
You avoid chasing every big candle.
You only act when:
- Breakout strength is high,
- Volume confirms the move,
- Structure (Fib / VPOC / CHoCH) is aligned.
--------------------------------------------------
E) VPOC / WVPOC CLUSTERS & DYNAMIC ZONES
- Tracks real-time VPOC and WVPOC.
- Identifies VPOC/WVPOC clusters as powerful S/R zones.
- Confirms bullish or bearish breaks when price clears these levels with volume.
- Provides dynamic SL and TP logic:
• SL near/behind VPOC with ATR buffer.
• TP ladders aligned with volume structure.
HOW TRADERS USE IT:
You anchor your risk to where the most volume traded, not random price points:
- Use VPOC as a rational stop placement.
- Treat VPOC/WVPOC clusters as “coiled springs” – zones where large moves often start.
--------------------------------------------------
F) SMART MONEY ENTRY ENGINE (1H + 15M MEGABARS)
- Uses MTF `request.security` logic to bring 1H MegaBars into lower timeframes.
- Identifies:
• 1H + 15m confluence entries (A-grade setups).
• Single-TF entries (B-grade setups).
- Pre-calculates for each scenario:
• Entry level (Fib-based within the MegaBar range).
• Stop loss (beyond range or leg-based).
• TP1–TP4 along Fib extensions / structure.
- Labels show:
• “Entry = …”
• “SL = …”
• “TP1 = … / TP2 = … / TP3 = … / TP4 = …”
with adjustable font size and ATR-based offsets.
- Optional “show only latest” mode to keep your chart clean.
- Alert-ready so you can receive notifications when conditions are met.
HOW TRADERS USE IT:
You get a fully defined execution ladder:
- The engine tells you where a logical entry is,
- Where a logical SL should be,
- And how to scale out with multiple targets.
You can use:
- Confluence setups for main trades,
- Single-TF setups for more frequent but lower conviction trades.
--------------------------------------------------
G) REVERSE FIB TRADING MODULE
- Triggers after extended moves when key TPs are hit.
- Looks for:
• Rejection candles at or beyond major extensions.
• Exhaustion + VSA confirmation.
- Builds a reverse (counter-trend) Fib plan:
• Counter-trend entry from extension extremes.
• TP ladder based on 0.618, 0.786, 1.236, 1.382, 1.5, 1.618, 2.0, etc.
• SL and TSL based on ATR and Fib distance.
- ATR timeframe adapts to chart timeframe.
HOW TRADERS USE IT:
You can fade overextended moves once structure and P/A agree:
- Trend traders can use it to tighten or exit.
- Counter-trend traders can structure “fade” setups with defined risk.
--------------------------------------------------
H) LIQUIDITY SWEEPS, CHoCH, ORDER BLOCKS, FVGs
- Detects sweeps above highs and below lows (liquidity grabs).
- Marks CHoCH (Change of Character) when structure flips with volume.
- Basic smart money order block detection (bullish / bearish).
- FVGs (Fair Value Gaps) shaded on chart, removed when filled.
HOW TRADERS USE IT:
Combine sweeps + CHoCH + MegaBar + VSA + VPOC:
- Join clean, volume-backed continuations.
- Fade obvious stop hunts when they reject into strong zones.
--------------------------------------------------
I) VSA + BREAKOUT DASHBOARD TABLE (OPTIONAL)
- Compact table with:
• VSA context
• Breakout score
• RVOL / volume status
• Spread and candle quality
• ATR regime
• Close position within the bar
• VPOC and elapsed bar percentage
HOW TRADERS USE IT:
Before pressing the button, glance at the table:
- Is volatility supportive?
- Is volume confirming?
- Is this a clean breakout or a tired move?
This pushes you toward rule-based execution and away from impulse.
--------------------------------------------------
3) TYPICAL TRADING WORKFLOW WITH XAUMO MEGABAR VSA
A) Pick timeframe and session
- Use 15m or 1H on XAUUSD.
- Align the indicator’s session inputs with your actual trading hours.
B) Read context first
- Check accumulation / distribution zones.
- Look at VSA events and the breakout engine.
- Note where VPOC / WVPOC are relative to price.
C) Find the active MegaBar and its Fib structure
- Identify the most recent bull/bear MegaBar.
- See if price is:
• Pulling back into reload zones,
• Breaking out of them,
• Or extending into high-risk zones.
D) Wait for smart money confirmation
- Look for:
• Confluence setups (1H + 15m MegaBars),
• Strong breakout score,
• Valid VSA signals,
• Helpful structure: CHoCH, FVG, sweeps.
E) Execute using the printed ladders
- Use the on-chart Entry / SL / TP labels as your execution framework.
- Adjust lot size and risk % according to your own plan.
F) Manage and exit
- Use ATR / VPOC logic to trail or lock profits.
- Rotate to reverse Fib setups if extensions look exhausted.
4) WHO THIS INDICATOR IS FOR
- Gold traders (XAUUSD CFD or spot) on 15m and 1H.
- Traders who prefer institutional structure (volume, VPOC, SMC, Fib) over simple indicators.
- Traders who want pre-structured entries, SL, and TP ladders without losing flexibility.
- Advanced students of VSA and smart money concepts who want everything in one tool.
5) FULL EDUCATIONAL DISCLAIMER (READ CAREFULLY)
- This indicator and all descriptions are for EDUCATIONAL PURPOSES ONLY.
- NOTHING in this script, its labels, tables, alerts, outputs, or documentation is:
• Investment advice
• Trading advice
• A recommendation to buy or sell any asset
• A signal service or portfolio management tool
- Markets are risky. Trading leveraged instruments such as CFDs, futures, or margin products involves a HIGH RISK of loss, including the possible loss of ALL invested capital.
- Past performance, backtests, or hypothetical examples DO NOT guarantee future results.
- Any probabilities, scores, or “quality levels” shown by the indicator are purely algorithmic and DO NOT represent guarantees or promises of profit.
- You are solely responsible for:
• Your position sizing
• Your leverage
• Your entries, exits, and risk management
• Compliance with local regulations and tax rules
- Before trading live with real money, you should:
• Thoroughly backtest and forward-test the indicator.
• Use a demo account to understand how signals behave in real time.
• Consult a licensed financial professional if you need personalised investment or trading advice.
- By using this indicator:
• You accept that the author and any associated entities or brands (including XAUMO, XAUMO indicators, and any promotional text) bear NO LIABILITY for any financial losses, missed gains, or decisions you make based on this tool.
• You agree that you are acting entirely at your own risk and that all outputs are informational and educational, not prescriptive trading instructions.
In short:
Use XAUMO MegaBar VSA as a powerful educational and analytical companion,
NOT as a substitute for your own independent judgment, testing, and risk control.
=====================================================
XAUMO MegaBar VSA — محرّك البريك آوت و الريفرسال بتاع السمارت ماني للدهب
( استخدام تعليمي بس)
1) المؤشّر ده بيعمل إيه؟
XAUMO MegaBar VSA معمول مخصوص للـ XAUUSD عشان يورّيك "الفلوس الكبيرة" بتتحرك إزاي،
مش بس السِعر رايح فين.
بيجمع في حتّة واحدة:
- رصد MegaBar على الساعة والربع ساعة
- VSA (Volume Spread Analysis) – سلوك الفوليوم جوّه الشمعة
- VPOC / WVPOC و تجمّعات الفوليوم المهمّة
- سويپس لليكويديتي + CHoCH + Order Blocks + FVGs
- خريطة فيبوناتشي كاملة (Retrace + Extensions)
- سلالم تنفيذ جاهزة (Entry, SL, TP1–TP4 + صفقات Reverse Fib)
وكل ده:
- بألوان واضحة على الشموع
- لِيبلات متظبّطة بـ ATR Offset
- Tables و Panels اختيارية
عشان المتداول يسأل نفسه:
"الحركة دي بتاعة سمارت ماني؟ ولا مجرد دوشة ملوش لازمة؟"
2) أهم الموديولات اللي جوّه المؤشّر
A) الكونتكست بتاع السيشن + تجميع/توزيع
- فلتر جلسات: لندن – نيو يورك – overlap – أو وقت تحطّه انت.
- مناطق Accumulation / Distribution متظلّلة بألوان أنت بتختارها.
- لچند بسيط يوضّح لك السوق دلوقتي: تجميع؟ توزيع؟ ولا نايم.
المتداول يستخدمه إزاي؟
تركّز بس في الجلسة اللي انت شغّال فيها، وتشوف فورًا:
فيه بناء مراكز؟ فيه تصريف؟ ولا مفيش فوليوم أصلاً؟
ده يقلّل دخولك في أوقات السوق فيها “ميت”.
--------------------------------------------
B) محرّك الـ MegaBar + خريطة الفيبوناتشي
- المؤشّر يلقط لوحده الـ MegaBars (شموع مؤسّسات) على 15m و 1h.
- بيعتمد على: حجم الجسم، مدى الشمعة، الفوليوم.
- يرسم خريطة فيبوناتشي كاملة من الرجل الأساسية:
• Retrace: 0, 13, 23.6, 38.2, 50, 61.8, 78.6, 86.2, 100, -33
• Extensions: من 125% لحد 600%+ (سلم قابل للتعديل)
- لكل مستوى:
• لون / سماكة / ستايل (سوليد – دوتيد – داشد)
• ليبل سِعر مع Offset بـ ATR
- لچند يشرح لك Reload Zones: ضحلة / عادية / عميقة.
المتداول يستخدمه إزاي؟
بدل ما “تخمّن” فين تشتري وتبيع:
- تشتري الدِپ جوّه مناطق Reload بعد MegaBar صاعد.
- تبيع الريبوند جوّه Extensions بعد MegaBar هابط.
- عندك هيكل واضح للسوينج والسكالب من غير فوضى.
--------------------------------------------
C) VSA + لِيبلات على الشموع
- يكتشف أحداث VSA زي:
• No Demand / No Supply
• Stopping Volume
• Absorption
• Spring / Upthrust
• Buying / Selling Climax
• EVR (شموع مجنونة فوليومًا)
• Tests و Confirmed Signals عند الدعوم/المقاومات
- مع تحسينات:
• تحليل Body vs Range
• مين اللي غالب؟ جسم الشمعة ولا الذيول؟
• فلتر Momentum + Volume
المتداول يستخدمه إزاي؟
كل ليبل على الشمعة = كومنت من السمارت ماني:
- No Demand عند مقاومة + RVOL ضعيف → بلاش تشتري.
- Stopping Volume + Spring جوّه Reload Zone + VPOC → فرصة قوية للشراء.
- توصل بين VSA + Fib + VPOC فتفهم “مين بيكسب المعركة”.
--------------------------------------------
D) محرّك البريك آوت Supersonic
- بيحسب Score للقوة بتاعة البريك آوت من:
• RVOL + Volume Expansion
• توسّع السبريد مقارنة بالشموع السابقة
• جودة جسم الشمعة (جسم ولا ذيل)
• نسبة الوقت اللي عدّى من الشمعة الحالية
- يفرّق بين:
• بريك آوت محتمل vs مؤكد
• حركة قوية مدعومة بفوليوم vs “شمعة شو”
- يقدر يطلع ليبل Debug يشرح:
• Momentum Score
• Volume Ratio / RVOL
• Spread Behaviour
• Body Quality
• % الوقت اللي فات من عمر الشمعة
المتداول يستخدمه إزاي؟
ماتجريش ورا كل شمعة كبيرة:
- استنَى لما يكون الـ Score عالي،
- والفوليوم مصدّق الحركة،
- والهيكل (Fib / VPOC / CHoCH) موافق.
ساعتها بس البريك آوت يستاهل المخاطرة.
--------------------------------------------
E) VPOC / WVPOC + مناطق الفوليوم
- يرقب VPOC و WVPOC في الوقت الحقيقي.
- يحدّد Clusters مهمة تتحوّل لـ Support / Resistance محترم.
- يراقب كسر المناطق دي بفوليوم واضح (بداية موجة جديدة).
- SL و TP ديناميك:
• SL حوالين VPOC مع Buffer من ATR.
• TP متوزع على مستويات فيبوناتشي و زونات فوليوم.
المتداول يستخدمه إزاي؟
بتربط مخاطرتك بأين اشتغل الفوليوم التقيل:
- VPOC = منطق منطقي للستوب.
- Clusters = زون ضغط ينفع يبدأ منها ترند قوي.
--------------------------------------------
F) محرّك الدخول بتاع السمارت ماني (1h + 15m MegaBars)
- يجيب MegaBars بتاعة الساعة جوّه فريمات أقل بالـ `request.security`.
- يميّز:
• Confluence بين MegaBar الساعة + MegaBar الربع ساعة (صفقة A-Grade).
• MegaBar على فريم واحد بس (B-Grade).
- يجهّز تلقائيًا:
• Entry
• SL
• TP1–TP4 على Extensions و مستويات هيكلية.
- اللّيبلات تكتب:
• Entry = …
• SL = …
• TP1 = … / TP2 = … / TP3 = … / TP4 = …
مع تحكّم في حجم الخط و ATR Offset.
- فيه اختيار “أظهر آخر سيناريو بس” عشان الشارت يفضل نضيف.
- جاهز للـ Alerts لما الشروط تكمّل.
المتداول يستخدمه إزاي؟
يبقى عندك Execution Ladder كامل:
- فين تدخل،
- فين تحط الستوب،
- إزاي تقسم الخروج على أكتر من هدف.
--------------------------------------------
G) موديل الـ Reverse Fib (صفقات عكس الاتجاه)
- بيشتغل بعد ما السعر يبالغ في الحركة و يوصل Extensions معيّنة.
- يدور على:
• شموع رفض عند/بعد Extensions.
• Exhaustion + إشارة VSA.
- يرسم خطة عكسية:
• Entry عكسي من Extension Extreme.
• TP سلم مبني على 0.618, 0.786, 1.236, 1.382, 1.5, 1.618, 2.0, … إلخ
• SL و TSL مبنيين على ATR و مسافة الفيبوناتشي.
المتداول يستخدمه إزاي؟
لو انت ترند تريدر:
- تستخدمه عشان تقفل/تخفف عند تمدّد مبالغ فيه.
لو انت Counter-Trend:
- يديك سيناريو “فِيد” منطقي بمخاطرة محسوبة.
--------------------------------------------
H) سويپس لليكويديتي + CHoCH + Order Blocks + FVGs
- يوسم مناطق ضرب الستوبات فوق الهاي وتحت اللو (Liquidity Grabs).
- يحدد CHoCH لما الاتجاه يغيّر شخصيته مع فوليوم.
- يرصد Order Blocks أساسية (Bullish / Bearish).
- يظلّل الـ FVGs و يشيلها لما تتعبّى.
المتداول يستخدمه إزاي؟
تجمع بين:
MegaBar + VSA + Fib + VPOC + Liquidity:
- يا إمّا تلحق موجة نظيفة،
- يا إمّا تفِيد Stop Hunt غبي اتكشف على الشارت.
--------------------------------------------
I) داشبورد VSA + Breakout (Table اختياري)
- Table صغيرة فيها:
• حالة VSA
• قوة البريك آوت
• RVOL / Volume
• Spread & Candle Quality
• حالة ATR
• مكان الإغلاق جوّه الشمعة
• وضع VPOC
• نسبة الوقت اللي عدّى من الشمعة
المتداول يستخدمه إزاي؟
قبل ما تدوس Buy / Sell:
- تبص على التابل ثانيتين:
الدنيا شغّالة ولا لأ؟
فيه فوليوم؟ فيه ترند؟ ولا حركة ميتة؟
ده يقلل قرارات “من غير plan”.
3) سيناريو شغل متداول على XAUMO MegaBar VSA
1) اختار الفريم + الجلسة
- 15m أو 1h على XAUUSD.
- ظبّط سيشن لندن/نيويورك زي وقت شغلك الحقيقي.
2) اقرأ الكونتكست
- السوق بيبنِي مراكز؟ بيصفّي؟ ولا نايم؟
- إيه إشارات الـ VSA و Score البريك آوت؟
- فين VPOC / WVPOC من السعر؟
3) دور على MegaBar النشط و خريطة الفيبوناتشي بتاعته
- السعر:
• بيرجّع جوّه Reload Zone؟
• بيكسر البرنچ؟
• ولا داخل على Overextension؟
4) استنَى تأكيد السمارت ماني
- Confluence بين MegaBar الساعة والربع ساعة.
- Breakout Score محترم.
- VSA منطقي (No Demand, Stopping Volume, Spring, …).
- Structure: CHoCH / FVG / Liquidity Sweep في اتجاه الصفقة.
5) نفّذ باستخدام السلم المطبوع على الشارت
- استخدم Entry / SL / TP1–TP4 كـ هيكل أساسي.
- عدّل اللوت / الريسك حسب خطتك انت.
6) الإدارة والخروج
- استعمل ATR + VPOC في Trailing/Lock.
- لما Extensions تبان مبالغ فيها → ركّز على Reverse Fib.
4) المؤشّر ده مناسب لمين؟
- اللي بيتاجر دهب XAUUSD (CFD أو Spot) على 15m و 1h.
- اللي بيحب شغل مؤسّسات: Volume, VPOC, SMC, Fib مش مؤشرات بسيطة.
- اللي عايز Execution Plan جاهز (Entry/SL/TP) بس لسه عنده حريّة تعديل.
- اللي عايز يتعلّم VSA و Smart Money Concepts بشكل تطبيقي على شارت واحد.
5) إخلاء مسؤولية كامل (مهم تقراه)
- المؤشّر ده وكل الكلام اللي حواليه للتعليم بس.
- مش:
• نصيحة استثمارية،
• ولا توصية شراء/بيع،
• ولا خدمة إدارة محافظ،
• ولا سيجنال سيرڤس.
- التداول في الأسواق (خصوصًا المشتقات، الـ CFD، الفيوتشر) فيه مخاطرة عالية جدًا،
وممكن تخسر جزء كبير أو كل رأس مالك.
- أي أداء سابق، باك تست، أو مثال افتراضي → مش ضمان لنتيجة مستقبلية.
- أي نسبة احتمالات، Scores، أو “Quality” بيطلعها المؤشّر:
• دي حسابات كود، مش ضمان ربح،
• مش وعد ولا تعهّد بأي نتيجة.
- انت المسؤول 100% عن:
• حجم العقود اللي بتدخلها،
• الرافعة اللي بتستخدمها،
• أماكن الدخول والخروج،
• وإدارة المخاطرة بتاعتك،
• والتزامك بالقوانين والضرائب في بلدك.
- قبل ما تستخدم المؤشّر على حساب حقيقي:
• جرّب كويس على باك تست و فورورد تست،
• اشتغل فترة على Demo،
• لو محتاج نصيحة مالية شخصية → ارجع لمستشار مالي مرخَّص.
باختصار:
XAUMO MegaBar VSA ده أداة تعليمية وتحليلية قوية تساعدك تفهم حركة الذهب،
مش زرار “اطبع فلوس”.
انت صاحب القرار، وانت صاحب المسؤولية، وانت اللي بتتحمّل أي ربح أو خسارة.

Universal Lot Size Calculator (Forex, Index, Metals)Multi-functional lot size calculator with support for various instruments
🎯 MAIN FEATURES:
Universal — works with Forex, indices, metals, and custom instruments
Auto-detect — automatically detects instrument type by ticker
Precise position sizing - considering risk and currency conversions
Currency conversion — automatic conversion between deposit currencies
Advanced visualization — entry, stop-loss, take-profit lines
Smart table — convenient display of all parameters
⚙️ SETTINGS GROUPS:
📈 Instrument Settings
Instrument Type — selection: Auto, Forex, Index, Metals, Custom
Custom Contract Size — manual contract size configuration
Use Manual Exchange Rate — manual rate for currency conversion
💰 Account & Risk Settings
Deposit Currency — account currency (USD, EUR, GBP, CHF, JPY)
Account Size — deposit amount
Risk in % — risk percentage from deposit
🎯 Price Levels
Entry Price — entry price
Stop Price — stop-loss price
Target Price — take-profit price
Color settings for each line
📊 Risk/Reward Settings
Manual Target Price — manual TP setting
Show R Levels — display profit levels in R multiples
Show only last R level — show only the last R level
Number of R Levels — number of R levels (1-10)
🎨 Line Styles & Table Appearance
Line style settings (solid, dashed, dotted)
Line width
Table position and size
Color schemes
📈Supported instrument types:
Forex — standard lot 100,000
Indices — E-mini futures (US100=20, SP500=50, US30=5, DAX=25)
Metals — Gold=100 oz, Silver=5000 oz
Custom — user-defined contract size
📱 KEY FEATURES:
- Auto instrument detection:
Indices: US100, SP500, US30, DAX
Metals: XAUUSD (Gold), XAGUSD (Silver)
Forex: all currency pairs
- Smart table with key parameters:
Instrument type and contract size
Account size and risk
Entry/exit prices
Calculated lot size
- Visual elements:
Dynamic level lines
Labels with profit/loss calculations
R-levels for target prices
- Currency conversion:
Automatic rate fetching
Support for USD, EUR, GBP, CHF, JPY
Manual rate setting when needed
⚠️ IMPORTANT NOTES:
Contract sizes may vary between brokers
For CFD brokers use Custom type with Contract Size = 1
During weekends currency rates may be unavailable — use manual rate
When trading in different currencies verify conversion accuracy
🚀 HOW TO USE:
Select instrument type (Auto for auto-detection)
Set deposit size and account currency
Define risk percentage (1-100%)
Specify prices for entry, stop-loss, and take-profit
Use calculated lot to open positions
⚠️ RESETTING CALCULATIONS:
To reuse the calculator with new price levels, you need to:
Right-click on the indicator's table/chart
Select "Reset Points" from the context menu
OR manually update all three price levels (Entry, Stop Loss, Take Profit) in the settings

John NQ levels. v2NQ levels lines critical points
so you can take longs or shorts from levels that fail or become resistance.
enjoy

MACD Forecast Colorful [DiFlip]MACD Forecast Colorful
The Future of Predictive MACD — is one of the most advanced and customizable MACD indicators ever published on TradingView. Built on the classic MACD foundation, this upgraded version integrates statistical forecasting through linear regression to anticipate future movements — not just react to the past.
With a total of 22 fully configurable long and short entry conditions, visual enhancements, and full automation support, this indicator is designed for serious traders seeking an analytical edge.
⯁ Real-Time MACD Forecasting
For the first time, a public MACD script combines the classic structure of MACD with predictive analytics powered by linear regression. Instead of simply responding to current values, this tool projects the MACD line, signal line, and histogram n bars into the future, allowing you to trade with foresight rather than hindsight.
⯁ Fully Customizable
This indicator is built for flexibility. It includes 22 entry conditions, all of which are fully configurable. Each condition can be turned on/off, chained using AND/OR logic, and adapted to your trading model.
Whether you're building a rules-based quant system, automating alerts, or refining discretionary signals, MACD Forecast Colorful gives you full control over how signals are generated, displayed, and triggered.
⯁ With MACD Forecast Colorful, you can:
• Detect MACD crossovers before they happen.
• Anticipate trend reversals with greater precision.
• React earlier than traditional indicators.
• Gain a powerful edge in both discretionary and automated strategies.
• This isn’t just smarter MACD — it’s predictive momentum intelligence.
⯁ Scientifically Powered by Linear Regression
MACD Forecast Colorful is the first public MACD indicator to apply least-squares predictive modeling to MACD behavior — effectively introducing machine learning logic into a time-tested tool.
It uses statistical regression to analyze historical behavior of the MACD and project future trajectories. The result is a forward-shifted MACD forecast that can detect upcoming crossovers and divergences before they appear on the chart.
⯁ Linear Regression: Technical Foundation
Linear regression is a statistical method that models the relationship between a dependent variable (y) and one or more independent variables (x). The basic formula for simple linear regression is:
y = β₀ + β₁x + ε
Where:
y = predicted variable (e.g., future MACD value)
x = independent variable (e.g., bar index)
β₀ = intercept
β₁ = slope
ε = random error (residual)
The regression model calculates β₀ and β₁ using the least squares method, minimizing the sum of squared prediction errors to produce the best-fit line through historical values. This line is then extended forward, generating a forecast based on recent price momentum.
⯁ Least Squares Estimation
The regression coefficients are computed with the following formulas:
β₁ = Σ((xᵢ - x̄)(yᵢ - ȳ)) / Σ((xᵢ - x̄)²)
β₀ = ȳ - β₁x̄
Where:
Σ denotes summation; x̄ and ȳ are the means of x and y; and i ranges from 1 to n (number of observations). These equations produce the best linear unbiased estimator under the Gauss–Markov assumptions — constant variance (homoscedasticity) and a linear relationship between variables.
⯁ Regression in Machine Learning
Linear regression is a foundational model in supervised learning. Its ability to provide precise, explainable, and fast forecasts makes it critical in AI systems and quantitative analysis.
Applying linear regression to MACD forecasting is the equivalent of injecting artificial intelligence into one of the most widely used momentum tools in trading.
⯁ Visual Interpretation
Picture the MACD values over time like this:
Time →
MACD →
A regression line is fitted to recent MACD values, then projected forward n periods. The result is a predictive trajectory that can cross over the real MACD or signal line — offering an early-warning system for trend shifts and momentum changes.
The indicator plots both current MACD and forecasted MACD, allowing you to visually compare short-term future behavior against historical movement.
⯁ Scientific Concepts Used
Linear Regression: models the relationship between variables using a straight line.
Least Squares Method: minimizes squared prediction errors for best-fit.
Time-Series Forecasting: projects future data based on past patterns.
Supervised Learning: predictive modeling using labeled inputs.
Statistical Smoothing: filters noise to highlight trends.
⯁ Why This Indicator Is Revolutionary
First open-source MACD with real-time predictive modeling.
Scientifically grounded with linear regression logic.
Automatable through TradingView alerts and bots.
Smart signal generation using forecasted crossovers.
Highly customizable with 22 buy/sell conditions.
Enhanced visuals with background (bgcolor) and area fill (fill) support.
This isn’t just an update — it’s the next evolution of MACD forecasting.
⯁ Example of simple linear regression with one independent variable
This example demonstrates how a basic linear regression works when there is only one independent variable influencing the dependent variable. This type of model is used to identify a direct relationship between two variables.
⯁ In linear regression, observations (red) are considered the result of random deviations (green) from an underlying relationship (blue) between a dependent variable (y) and an independent variable (x)
This concept illustrates that sampled data points rarely align perfectly with the true trend line. Instead, each observed point represents the combination of the true underlying relationship and a random error component.
⯁ Visualizing heteroscedasticity in a scatterplot with 100 random fitted values using Matlab
Heteroscedasticity occurs when the variance of the errors is not constant across the range of fitted values. This visualization highlights how the spread of data can change unpredictably, which is an important factor in evaluating the validity of regression models.
⯁ The datasets in Anscombe’s quartet were designed to have nearly the same linear regression line (as well as nearly identical means, standard deviations, and correlations) but look very different when plotted
This classic example shows that summary statistics alone can be misleading. Even with identical numerical metrics, the datasets display completely different patterns, emphasizing the importance of visual inspection when interpreting a model.
⯁ Result of fitting a set of data points with a quadratic function
This example illustrates how a second-degree polynomial model can better fit certain datasets that do not follow a linear trend. The resulting curve reflects the true shape of the data more accurately than a straight line.
⯁ What is the MACD?
The Moving Average Convergence Divergence (MACD) is a technical analysis indicator developed by Gerald Appel. It measures the relationship between two moving averages of a security’s price to identify changes in momentum, direction, and strength of a trend. The MACD is composed of three components: the MACD line, the signal line, and the histogram.
⯁ How to use the MACD?
The MACD is calculated by subtracting the 26-period Exponential Moving Average (EMA) from the 12-period EMA. A 9-period EMA of the MACD line, called the signal line, is then plotted on top of the MACD line. The MACD histogram represents the difference between the MACD line and the signal line.
Here are the primary signals generated by the MACD:
• Bullish Crossover: When the MACD line crosses above the signal line, indicating a potential buy signal.
• Bearish Crossover: When the MACD line crosses below the signal line, indicating a potential sell signal.
• Divergence: When the price of the security diverges from the MACD, suggesting a potential reversal.
• Overbought/Oversold Conditions: Indicated by the MACD line moving far away from the signal line, though this is less common than in oscillators like the RSI.
⯁ How to use MACD forecast?
The MACD Forecast is built on the same foundation as the classic MACD, but with predictive capabilities.
Step 1 — Spot Predicted Crossovers:
Watch for forecasted bullish or bearish crossovers. These signals anticipate when the MACD line will cross the signal line in the future, letting you prepare trades before the move.
Step 2 — Confirm with Histogram Projection:
Use the projected histogram to validate momentum direction. A rising histogram signals strengthening bullish momentum, while a falling projection points to weakening or bearish conditions.
Step 3 — Combine with Multi-Timeframe Analysis:
Use forecasts across multiple timeframes to confirm signal strength (e.g., a 1h forecast aligned with a 4h forecast).
Step 4 — Set Entry Conditions & Automation:
Customize your buy/sell rules with the 20 forecast-based conditions and enable automation for bots or alerts.
Step 5 — Trade Ahead of the Market:
By preparing for future momentum shifts instead of reacting to the past, you’ll always stay one step ahead of lagging traders.
📈 BUY
🍟 Signal Validity: The signal will remain valid for X bars.
🍟 Signal Sequence: Configurable as AND or OR.
🍟 MACD > Signal Smoothing
🍟 MACD < Signal Smoothing
🍟 Histogram > 0
🍟 Histogram < 0
🍟 Histogram Positive
🍟 Histogram Negative
🍟 MACD > 0
🍟 MACD < 0
🍟 Signal > 0
🍟 Signal < 0
🍟 MACD > Histogram
🍟 MACD < Histogram
🍟 Signal > Histogram
🍟 Signal < Histogram
🍟 MACD (Crossover) Signal
🍟 MACD (Crossunder) Signal
🍟 MACD (Crossover) 0
🍟 MACD (Crossunder) 0
🍟 Signal (Crossover) 0
🍟 Signal (Crossunder) 0
🔮 MACD (Crossover) Signal Forecast
🔮 MACD (Crossunder) Signal Forecast
📉 SELL
🍟 Signal Validity: The signal will remain valid for X bars.
🍟 Signal Sequence: Configurable as AND or OR.
🍟 MACD > Signal Smoothing
🍟 MACD < Signal Smoothing
🍟 Histogram > 0
🍟 Histogram < 0
🍟 Histogram Positive
🍟 Histogram Negative
🍟 MACD > 0
🍟 MACD < 0
🍟 Signal > 0
🍟 Signal < 0
🍟 MACD > Histogram
🍟 MACD < Histogram
🍟 Signal > Histogram
🍟 Signal < Histogram
🍟 MACD (Crossover) Signal
🍟 MACD (Crossunder) Signal
🍟 MACD (Crossover) 0
🍟 MACD (Crossunder) 0
🍟 Signal (Crossover) 0
🍟 Signal (Crossunder) 0
🔮 MACD (Crossover) Signal Forecast
🔮 MACD (Crossunder) Signal Forecast
🤖 Automation
All BUY and SELL conditions can be automated using TradingView alerts. Every configurable condition can trigger alerts suitable for fully automated or semi-automated strategies.
⯁ Unique Features
Linear Regression: (Forecast)
Signal Validity: The signal will remain valid for X bars
Signal Sequence: Configurable as AND/OR
Table of Conditions: BUY/SELL
Conditions Label: BUY/SELL
Plot Labels in the graph above: BUY/SELL
Automate & Monitor Signals/Alerts: BUY/SELL
Background Colors: "bgcolor"
Background Colors: "fill"
Linear Regression (Forecast)
Signal Validity: The signal will remain valid for X bars
Signal Sequence: Configurable as AND/OR
Table of Conditions: BUY/SELL
Conditions Label: BUY/SELL
Plot Labels in the graph above: BUY/SELL
Automate & Monitor Signals/Alerts: BUY/SELL
Background Colors: "bgcolor"
Background Colors: "fill"

Best Metal to Sell → More BTCWhichever precious metal has outperformed Bitcoin the most over the last 21 days (by >4%) is showing short-term strength → sell a small slice of that metal and rotate into BTC.
Orange = trim some gold → buy BTC
Grey = trim some silver → buy BTC
Black = no clear edge → hold
This is a gradual, disciplined rebalancing tool for anyone holding physical gold & silver who wants to slowly increase their BTC exposure on relative strength spikes — without ever going “all-in”.
You decide the pace: 1% per signal, pause anytime, or stop when you’ve reached your personal comfort level of BTC allocation.
2020–2025 backtest (weekly 1% rotations):
$200k metals → 18.4 BTC + $0 metals left = $1.68 million
HODL metals only = $320k
HODL BTC from day one = ~$1.4 million
It’s not about beating BTC every cycle — it’s about turning stagnant metals into more sats, at your own pace.

Gold Thai CompassGold Thai Compass Indicator
Calculates Thai Gold Price (96.5%) by converting XAU/USD with the USD/THB exchange rate in real time
Displays the calculated gold_price_thb directly on the chart with a clean right-aligned label for easy price reading
Includes customizable reference lines — add, remove, rename, recolor, and adjust each line independently
Supports multiple editable lines (e.g., 4 levels) with price labels displayed beside each line
Provides user-friendly input settings (e.g., custom price sources, spread/adjustment options)
Updates dynamically with live market data — suitable for trading, analysis, and Thai gold price tracking
Designed for TradingView (Pine Script) and optimized for clarity and usability
Optional visibility controls to show/hide labels and reference lines for a cleaner chart layout

[MTX] Weekly Support & Resistance Weekly Support & Resistance
Overview
Discover key market structure with this all-in-one indicator:
Weekly Support & Resistance (SR) levels , Fair Value Gap (FVG) detection , and Automatic Fibonacci retracements .
Designed for MTX traders, it plots non-repainting weekly highs/lows/opens/closes, highlights unmitigated FVGs for potential imbalances, and auto-draws Fib levels, Perfect for swing/day traders on XAUUSD.
🚀 Key Features
- Weekly SR Levels : Plots previous week's High (resistance), Low (support), Open, and Close. Optional historical levels (Week -2/-3).
- SR Zones : Customizable % zones around levels for dynamic support/resistance bands. Fill colors for easy visualization.
- FVG Detection : Identifies bullish (green) and bearish (red) Fair Value Gaps on your chart timeframe.
- buy/sell Signals :
- Trend Filter : Optional EMA/SMA to filter signals
- Auto Fibonacci : auto-retracement with 20+ levels (0%, 23.6%, 38.2%, 50%, 61.8%, 100%, extensions to 423.6%, negatives). Custom colors, labels, and background fills.
- Alerts: Built-in for FVG creation/mitigation + all buy/sell signals. Set up once for real-time notifications.
⚠️ Important Disclaimer
This indicator is for educational and analysis purposes only. It provides visual tools and signals based on historical price action— not financial advice. Past performance ≠ future results. Trading involves risk; use proper risk management. Backtest thoroughly. No guarantees of profitability. Consult a financial advisor.
#tradingview #smc #MTX #fvg #fibonacci #supportresistance

9/15 EMA Scalper 9/15 EMA Scalper — by uzairbaloch
This script is a price-action based scalping system built around the 9 EMA and 15 EMA trend structure.
It identifies short-term reversal points where the market pulls back into the EMAs and confirms direction with a strong candle signal.
The strategy looks for:
• A clear EMA trend (9 above 15 for buys, 9 below 15 for sells)
• Pullback into EMA9/EMA15 with candle bodies touching the fast EMA
• Strong confirmation candle (engulfing / strong momentum / controlled wick)
• Optional slope filter to avoid flat, choppy sessions
• Automatic trade labels showing Entry, SL and TP (based on R:R)
The script is designed for scalping on gold, indices, and high-volatility FX pairs.
It resets trade logic immediately after SL or TP is hit, so it can catch the next valid signal without delay.
This tool is meant as an indicator — not a full strategy — and can be used to visually mark high-probability EMA pullback setups with precise levels.
Author: uzairbaloch

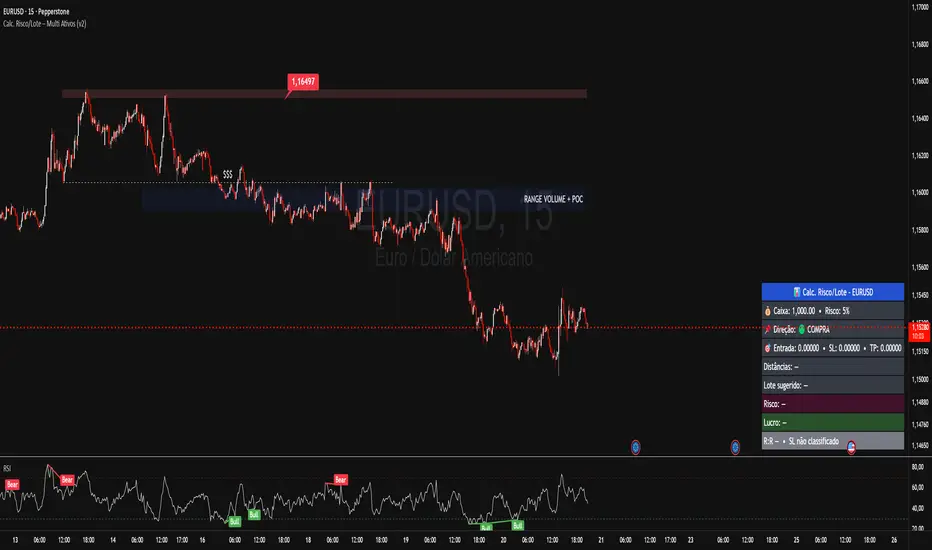
Calc. Risco/Lote – Multi Ativos (v2)Works for:
Forex (EURUSD, GBPUSD, USDCHF, USDCAD, USDJPY etc.)
Indices (US30, NAS100, GER40…)
Gold (XAUUSD), etc.
You manually enter:
Cash / Balance (USD)
Risk per trade (%)
Direction (Buy/Sell)
Entry Price
Stop Price (SL)
Target Price (TP)
The indicator calculates:
Distance between SL and TP in points
Value per point (automatic per asset)
Ideal lot / position size
Loss if SL hits (USD)
Profit if TP hits (USD)
Risk/Reward (R:R)
Fear & Greed Oscillator - Risk SentimentThe Fear & Greed Oscillator – Risk Sentiment is a macro-driven sentiment indicator inspired by the popular Fear & Greed Index , but rebuilt from the ground up using real, market-based economic data and statistical normalization.
While the traditional Fear & Greed Index uses components like volatility, volume, and social media trends to estimate sentiment, this version is powered by the Copper/Gold ratio — a historically respected gauge of macroeconomic confidence and risk appetite.
📈 Expansion vs. Contraction Theory
At the heart of this oscillator is a simple macroeconomic insight:
🟢 Copper performs well during periods of economic expansion and risk-on behavior (industrials, construction, manufacturing growth).
🔴 Gold performs well during periods of economic contraction , as a classic risk-off, capital-preserving asset.
By tracking the ratio of Copper to Gold prices over time and converting it into a Z-score , this tool shows when macro sentiment is statistically stretched toward greed or fear — based on how unusually strong one side of the ratio is relative to its historical average.
⚙️ How It Works
The script takes two user-defined tickers (default: Copper and Gold) and calculates their ratio.
It then applies Z-score normalization over a user-defined period (default: 200 bars).
A color gradient line is plotted:
🔴 Z < -2 = Extreme Fear
🟣 -2 to 0 = Mild Fear to Neutral
🔵 0 to 2 = Neutral to Greed
🟢 Z > 2 = Extreme Greed
Visual guides at ±1, ±2, ±3 standard deviations give immediate context.
Includes alert conditions when the Z-score crosses above +2 (Greed) or below -2 (Fear).
🔔 Alerts
“Z-Score has entered the Greed Zone ” when Z > 2
“Z-Score has entered the Fear Zone ” when Z < -2
These are designed to help catch macro sentiment extremes before or during large shifts in market behavior.
⚠️ Disclaimer
This indicator is a macro sentiment tool, not a direct trading signal. While the Copper/Gold ratio often reflects economic risk trends, correlation with risk assets (like Bitcoin or equities) is not guaranteed and may vary by cycle. Always use this indicator in conjunction with other tools and contextual analysis.

[AutoZone_mrkim]- Use wisely
- The indicator will automatically draw the Order Block zone for each timeframe
- It will change color if a zone is broken out
- Each timeframe will have different zone levels depending on the timeframe used

Lot Size CalculatorLot Size Calculator for Gold (XAU)
This indicator helps traders calculate the proper lot size for Gold (XAU) based on their entry, stop loss, and risk amount in USD.
You can set your entry and stop levels directly on the chart, and adjust your dollar risk from the settings panel.
The indicator measures the distance between entry and stop to calculate the position size that matches your selected risk.
A clean, customizable table displays key values such as Risk, Entry, Stop, Target, Lots, and Pips.
You can easily hide specific rows, change colors, and adjust layout options to fit your chart style.
Designed specifically for Gold traders, this tool provides a simple and visual way to manage risk directly on the chart.

XenoSmooth Predictive Candles - Advanced Heikin Ashi CandlesXenoSmooth Predictive Candles
Summary in one paragraph
A synthetic candle engine for crypto, FX, equities, and futures on intraday to swing timeframes. It reduces noise and flip delay so structure is easier to read. The core novelty is a predictive open with inertia plus slope lead fused with a zero lag body filter and an overshoot based wick model normalized by the real range and capped by ATR. Add it to a clean chart, hide regular candles if desired, and tune lengths. Shapes can move while the bar is open and settle on close. For conservative workflows read on bar close.
Scope and intent
• Markets. Major FX pairs, index futures, large cap equities, liquid crypto
• Timeframes. One minute to daily
• Purpose. Faster and smoother visual structure than Heikin Ashi while keeping causality and realistic wicks
Originality and usefulness
• Unique concept. Predictive open with inertia and slope lead plus selectable zero lag body filter and ATR capped wick overshoot in percent of real range
• Failure mode addressed. Late flips in chop and unreal long wicks from raw extremes
• Testability. Every control is an input. Users can toggle body method, lengths, clipping, and percent modeling
• Portable yardstick. ATR based wick cap and percent of bar range scale across symbols
Method overview in plain language
Build a robust base price from O, H, L, and extra weight on Close. Smooth it with a chosen filter to produce the synthetic close. Drive a predictive open that follows the synthetic close with tunable inertia and a small lead from the last bar slope. Model wicks as the portion of the real extremes that extends beyond the synthetic body, smooth that overshoot, normalize by the bar range if selected, then cap by ATR to avoid tail spikes. Clamp synthetic values to the real high and low if enabled.
Base measures
• Range basis. True Range for the ATR cap and High minus Low for percent normalization
• Return basis. Not used
Components
• Body Base Blend. Weighted O H L with a close bias to stabilize the base
• Zero Lag Body Filter. ZLEMA or Super Smoother or WMA to set the synthetic close
• Predictive Open. Inertial follow of the synthetic close plus a slope lead term
• Wick Overshoot Model. Smoothed extension beyond the body, optional percent of real range, ATR cap
• Clamp Option. Keeps synthetic open and close inside the real bar range
Fusion rule
• Synthetic close equals filtered base
• Synthetic open equals previous open plus inertia times distance to synthetic close plus slope lead
• Wicks equal smoothed overshoot above and below the body, optionally percent of range then converted back to price and capped by ATR
Inputs with guidance
Setup
• Signal timeframe. Uses the chart timeframe
• Invert direction. Not applicable
• Session windows. Not applicable
Logic
• Body length. Core smoothing length for the synthetic close. Typical 6 to 14. Higher gives smoother and slower. Lower gives faster flips
• Body method. ZLEMA or Super Smoother or WMA. ZLEMA is fastest. Super Smoother is calmest
• Close weight in base. 0 to 1. Higher gives stronger emphasis on close and less noise
• Open inertia. 0 to 1. Higher makes the open follow the close more tightly
• Lead gain. 0 to 1. Higher adds more phase lead. Keep modest to avoid overshoot
• Clamp body to real range. On keeps synthetic body inside high and low
• Wick smooth length. Typical 4 to 10. Higher reduces jitter
• Overshoot as percent. On stabilizes wicks across regimes
• ATR length. Typical 10 to 20 for the cap
• Max wick equals ATR times. 0 disables. 1.0 to 2.0 contains extreme tails
Filters
• Efficiency or trend filter. Not used
• Micro versus macro range relation. Not used
• Location filter. Not used
Realism and responsible publication
• No performance claims
• Intrabar motion reminder. Shapes can move while a bar forms and settle on close
• Strategies must use standard candles for signals and orders
Honest limitations and failure modes
• High impact releases and thin liquidity can distort wicks and produce gaps that any smoother cannot predict
• Very quiet regimes can reduce contrast. Consider longer body length
• Session time on the chart controls the definition of each bar

Willy ORB for Gold – Session Presets (NY 5m)What it does:
Plots the opening-range high/low for the main Gold sessions (Shanghai, Tokyo, Sydney, Frankfurt, London, New York 5-minute OR by default). It projects TP1/TP2 expansion targets, supports a timezone offset so opens line up with your broker, and includes breakout alerts on confirmed closes.
⸻
Why it’s Gold-friendly
• New York (COMEX pit): 5-minute opening range at ~20:20 local (via your offset) to capture the most active burst.
• London / Frankfurt: strong European volatility windows for XAU/USD.
• Shanghai / Tokyo / Sydney: structure-setting sessions before momentum builds.
⸻
Features
• Session presets: SH, TK, SY, FR, LDN, NY (5m) — toggle individually
• 15m OR for all sessions except NY (5m) by default (editable per session)
• TP1 / TP2 expansion targets (user-defined multiples)
• Labels for 15m/5m range and targets; customizable styles
• Timezone offset control (aligns lines to your local clock)
• Daily auto-reset for clean levels
• Alerts: “Closed Above Range High” / “Closed Below Range Low” per session
⸻
How to use
1. Add to chart (best on 1–15m).
2. In settings → Gold Sessions, toggle the sessions you want.
3. Set “My time offset from chart (hours)” so session lines match your broker time.
4. Trade the breakouts: when price closes beyond the session high/low, TP levels plot automatically.
⸻
Parameters (quick guide)
• Targets: TP1/TP2 multiples (e.g., 1.0 and 2.0).
• Labels: left/right label placement, line styles/colors.
• Sessions: enable/disable + choose each session’s OR length (NY defaults to 5m).
⸻
Tips for XAU/USD
• London often gives the cleanest first breakout.
• New York tends to drive continuation after data releases.
• Consider pairing with volume/volatility or HTF trend for confluence.
⸻
Notes
• Built in Pine Script v6.
• Indicator (not a strategy). For backtests, use a companion strategy that trades the closes beyond the OR with SL at the opposite side and TP by R.
⸻
Disclaimer
For educational purposes only. Not financial advice. Always backtest and manage risk.

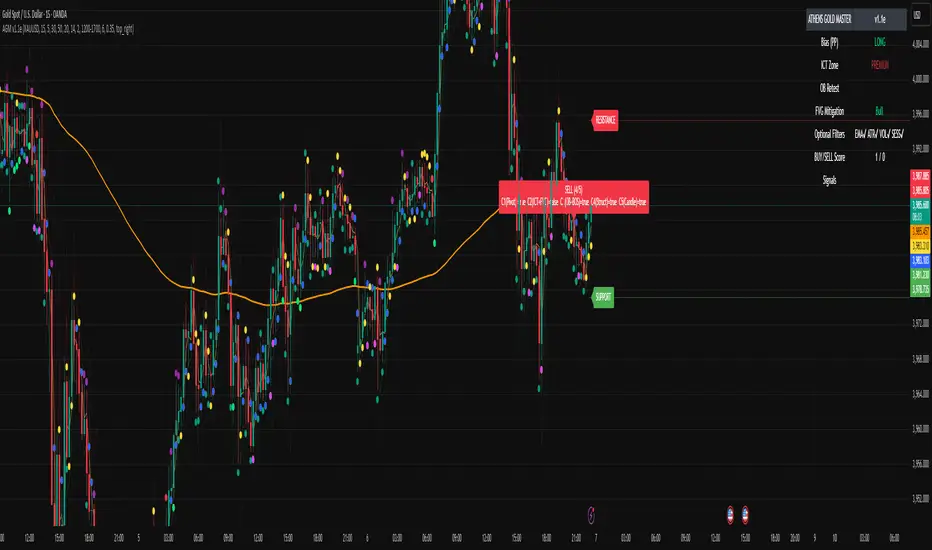
ATHENS GOLD MASTER v1.1e — by ATHENSATHENS GOLD MASTER v1.1e — by ATHENS
Professional Smart-Money-Based Gold Trading System
Built with institutional precision and ICT logic for XAUUSD traders.
⚙️ Core Strategy Components
✅ ICT Premium/Discount Model
✅ Daily Pivot Points & Price Bias
✅ Order Block & Break of Structure Detection
✅ Fair Value Gap (FVG) Mitigation Logic
✅ Dynamic Support & Resistance Recognition
✅ Candlestick + Chart Pattern Confirmation
✅ Multi-Timeframe Structure Alignment
💡 How It Works
The indicator scans real-time GOLD price action and generates Buy / Sell signals only when 3 or more confirmations align across smart money and technical confluence.
Each signal is visually marked on the chart with labels showing:
Confirmation count (1–5)
Key structure notes (Pivot, OB, FVG, etc.)
Support/Resistance zone tags
🧠 Optional Filters for Accuracy (90%+)
EMA-200 Trend Filter
ATR Volatility Filter
Volume Strength Filter
Session-Time Restriction (London–New York Overlap)
🟩 Buy Signal Example
Price above Pivot & in Discount Zone
Bullish Order Block Retest
FVG Mitigation Confirmed
Bullish Engulfing / Pin-Bar Confirmation
🟥 Sell Signal Example
Price below Pivot & in Premium Zone
Bearish Order Block Retest
FVG Mitigation Confirmed
Bearish Engulfing / Pin-Bar Confirmation
📊 Extra Features
Live Bias Table (Panel)
Selective Smart S/R Zones
Auto Session Filter
Alerts for Buy, Sell, and Strong Confluences
Best for: Gold Traders, ICT Students, Smart-Money Concepts Enthusiasts, and Professional Price-Action Analysts.
⚜️ Developed by ATHENS | Sahan Akalanka
📈 “Trade Smart. Think Institutional.”
15-Min Opening Range Indicator & Breakout Targets (ORB)- Willy
🔍 Overview
The **15-Min ORB (Opening Range Breakout)** indicator automatically identifies the **first 15-minute high and low range** after a market opens — and plots breakout targets based on user-defined expansion multiples.
It’s designed for traders who use **Opening Range Breakout (ORB)** strategies across multiple markets or sessions — and want **precise timing adjusted to their own timezone**.
---
⚙️ Features
🕐 **Time-Zone Offset (Local Adjustment)**
* Automatically shift your ORB window to match your **local timezone**.
* No more guessing when “09:30” happens in your region.
* Simply set the **offset (hours ahead or behind chart time)** and the indicator adjusts everything automatically.
⏱ **15-Minute Opening Range**
* Plots the high and low of your chosen 15-minute window.
* Works with any market or trading session (NYSE, London, Tokyo, Crypto, etc.).
* User can define **custom start hour and minute**.
🎯 **Breakout Targets (TP1, TP2)**
* Automatically calculates and draws **Take Profit levels** using customizable expansion multiples.
* Configurable TP1 / TP2 lines and labels with selectable styles (solid, dashed, dotted).
💬 **Visual Labels**
* Clear text labels showing:
* 15m High and Low levels.
* TP1 and TP2 targets.
* Label placement (left or right) adjustable for chart preference.
🧹 **Automatic Daily Reset**
* Resets all levels and targets at your midnight (or market day boundary).
* Ensures clean new ORB levels every day.
🔔 **Breakout Alerts**
* Built-in TradingView alerts for:
* **Closed Above 15m High**
* **Closed Below 15m Low**
---
🧭 How to Use
1. **Add to Chart**
* Click “Add to Favorite Scripts” and apply to your desired symbol.
* Works best on intraday timeframes (1m–15m).
2. **Set Your Market Session**
* Choose your **Range Start Hour and Minute** (e.g., 9:30 for NYSE).
* Set **My Time Offset from Chart (hours)** — for example:
* NYSE 9:30 New York → Bangkok (+12 hours)
* London 8:00 → Bangkok (+7 hours)
* The indicator adjusts automatically.
3. **Monitor the Range**
* The first 15-minute high and low are drawn as purple lines.
* When price breaks above or below, TP levels appear.
4. **Trade Your Plan**
* Alerts trigger when candles close outside the range.
* Manage targets using the expansion multipliers.
---
🧮 Example Settings
| Market | Local Open (Your Time) | Range Start (chart time) | Offset | Notes |
| :----------- | :--------------------------------- | :----------------------- | :----- | :----------------------- |
| NYSE (US) | 9:30 AM New York → 9:30 PM Bangkok | 9 | +12 | Typical for Thai traders |
| LSE (UK) | 8:00 AM London → 3:00 PM Bangkok | 8 | +7 | EU market overlap |
| Tokyo | 9:00 AM Tokyo → 7:00 AM Bangkok | 9 | +2 | Asian session |
| Crypto (UTC) | 0:00 UTC → 7:00 AM Bangkok | 0 | +7 | 24/7 markets |
---
📐 Parameters
### 15-Minute Range
* **Display 15-Minute Range** — toggles the range lines.
* **Show 15-Minute Labels** — toggles the range high/low labels.
* **Range Start Hour / Minute** — defines the start of your 15m window.
* **My Time Offset from Chart (hours)** — shifts the calculation to your local time.
* **Range Color / Style** — customize the look of your range lines.
### Targets
* **TP1 Expansion Multiple** — default `1.0` (equal to full range).
* **TP2 Expansion Multiple** — default `2.0`.
* **Show TP1 / TP2 Levels & Labels** — toggle individually.
* **TP Label Color** — customize breakout target visuals.
### Labels
* **Label Position (Left/Right)** — choose where labels appear on chart.
---
## 💡 Strategy Ideas
* Combine with volume or volatility filters for better confirmation.
* Use alongside VWAP, EMA, or session profiles for confluence.
* Apply on different markets:
* **Stocks (NYSE, NASDAQ)** — morning ORB strategy.
* **FX (London Open)** — volatility breakout.
* **Crypto (UTC 00:00)** — daily range breakout.
---
🧩 Technical Notes
* Built in **Pine Script v6**.
* Works on all intraday timeframes.
* Time calculations are local-adjusted using integer offset logic (avoids DST issues).
* No repainting — range values lock once 15m window completes.
---
🚀 Author Notes
Created for traders who want **simple, reliable ORB logic that respects your timezone**.
No unnecessary complexity — everything resets cleanly each day.
Tested and verified on:
* BTCUSD (Binance)
* ES1! (CME Futures)
* NAS100 / SPX500
* EURUSD / GBPJPY
* Thai SET50 index
---
🔔 Alerts
* “Closed Above 15m High”
* “Closed Below 15m Low”
You can configure custom alerts with your own messages.
---
## ⚠️ Disclaimer
This script is **for educational purposes only**.
It does not constitute financial advice or guarantee results.
Always backtest and trade responsibly.

Gold THB per Baht (XAU -> Thai baht gold)What it does
This indicator converts international gold prices (XAU) into Thai retail “baht gold” price (THB per 1 baht gold weight) in real time. It multiplies the XAU price (per troy ounce) by USD/THB and converts ounces to Thai baht-weight using the exact gram ratios.
Formula
THB per baht gold = XAU (USD/oz) × USDTHB × (15.244 / 31.1035) × (1 + Adjustment%) + FlatFeeTHB
1 troy ounce = 31.1035 g
1 Thai baht gold = 15.244 g
Conversion factor ≈ 0.490103

Reactive Curvature Smoother Moving Average IndicatorSummary in one paragraph
RCS MA is a reactive curvature smoother for any liquid instrument on intraday through swing timeframes. It helps you act only when context strengthens by adapting its window length with a normalized path energy score and by smoothing with robust residual weights over a quadratic fit, then optionally blending a capped one step forecast. Add it to a clean chart and watch the single colored line. Shapes can shift while a bar forms and settle on close. For conservative use, judge on bar close.
Scope and intent
• Markets: major FX pairs, index futures, large cap equities, liquid crypto
• Timeframes: one minute to daily
• Purpose: reduce lag in trends while resisting chop and outliers
• Limits: indicator only, no orders
Originality and usefulness
• Novelty: adaptive window selection by minimizing normalized path energy with directionality bias, plus Huber weighted residuals and curvature aware penalty, finished with a mintick capped forecast blend
• Failure modes addressed: whipsaws from fixed length MAs and outlier spikes that pull means
• Testable: Inputs expose all components and optional diagnostics show chosen length, directionality, and energy
• Portable yardstick: forecast cap uses mintick to stay symbol aware
Method overview in plain language
Base measures
• Range span of the tested window and a path energy defined as the sum of squared price increments, normalized by span
Components
Adaptive window chooser: scans L between Min and Max using an energy over trend score and picks the lowest score
Robust smoother: fits a quadratic to the last L bars, computes residuals, applies Huber weights and an exponential residual penalty scaled down when curvature is high
Forecast blend: projects one step ahead from the quadratic, caps displacement by a multiple of mintick, blends by user weight
Fusion rule
• Final line equals robust mean plus optional capped forecast blend
Signal rule
• Visual bias only: color turns lime when close is above the line, red otherwise
What you will see on the chart
• One colored line that tightens in trends and relaxes in chop
• Optional debug overlays for core value, chosen L, directionality, and energy
• Optional last bar label with L, directionality, and energy
• Reminder: drawings can move intrabar and settle on close
Inputs with guidance
Setup
• Source: price series to smooth
Logic
• Min window l_min. Typical 5 to 21. Higher increases stability, adds lag
• Max window l_max. Typical 40 to 128. Higher reduces noise, adds lag ceiling
• Length step grid_step. Typical 1 to 8. Smaller is finer and heavier
• Trend bias trend_bias. Typical 0.50 to 0.80. Higher favors trend persistence
• Residual penalty lambda_base. Typical 0.8 to 2.0. Higher downweights large residuals more
• Huber threshold huber_k. Typical 1.5 to 3.0. Higher admits more outliers
• Curvature guard curv_guard. Typical 0.3 to 1.0. Higher reduces influence when curve is tight
• Forecast blend lead_blend. 0 disables. Typical 0.10 to 0.40
• Forecast cap lead_limit. Typical 1 to 5 minticks
• Show chosen L and metrics show_debug. Diagnostics toggle
Optional: enable diagnostics to see length, direction, and energy
Realism and responsible publication
• No performance claims. Past results never guarantee future outcomes
• Shapes can move while bars are open and settle on close
• Use on standard candles for analysis and combine with your own risk process
Honest limitations and failure modes
• Very quiet regimes can reduce energy contrast, length selection may hover near the bounds
• Gap heavy symbols can disrupt quadratic fit on the window edges
• Excessive forecast blend may look anticipatory; use low values and the cap

Liquidity Swap Detector Ultimate - Cedric JeanjeanAdvanced Smart Money Concepts indicator designed to detect high-probability liquidity sweeps and institutional order flow reversals. This professional-grade tool combines multiple ICT (Inner Circle Trader) strategies to identify optimal entry points.
═══════════════════════════════════════════════════════
📊 KEY FEATURES:
✅ Smart Swing Detection
- Identifies confirmed swing highs and lows using adaptive lookback periods
- Eliminates false signals through double-confirmation logic
- Detects liquidity grabs at key market structure points
✅ Fair Value Gap (FVG) Analysis
- Multi-timeframe FVG detection for enhanced accuracy
- Filters imbalances by minimum size threshold
- Combines current timeframe and higher timeframe FVGs
✅ Advanced Volatility Filter
- ATR-based volatility analysis to avoid low-quality setups
- Adjustable volatility threshold (default 0.35%)
- Ensures entries during optimal market conditions
✅ Precision Signal Generation
- LONG signals: Confirmed swing lows + FVG + volatility confirmation
- SHORT signals: Confirmed swing highs + FVG + volatility confirmation
- Clear visual markers with price labels
✅ Comprehensive Alert System
- Three alert types: Simple, Detailed, JSON (for webhooks)
- Separate LONG/SHORT alert controls
- Compatible with MT5 integration via webhooks
- TradingView native alertcondition support
✅ Professional Dashboard
- Real-time ATR monitoring
- Volatility percentage display
- FVG status indicator
- Alert status tracker
═══════════════════════════════════════════════════════
⚙️ CUSTOMIZABLE PARAMETERS:
🔹 Lookback Swing (1-50): Defines swing detection sensitivity
🔹 ATR Multiplier: Controls wick filter strength
🔹 Volatility Filter: Minimum required market volatility (%)
🔹 FVG Filter: Minimum fair value gap size (%)
🔹 FVG Timeframe: Higher timeframe for multi-TF analysis
🔹 Visual Options: Toggle swing marks, FVG zones, labels
🔹 Alert Controls: Enable/disable LONG/SHORT notifications
═══════════════════════════════════════════════════════
📈 HOW IT WORKS:
1. The indicator scans for confirmed swing points using a robust double-confirmation algorithm
2. Simultaneously analyzes Fair Value Gaps on both current and higher timeframes
3. Validates market volatility to ensure sufficient price movement
4. Generates precise entry signals when all conditions align
5. Triggers customizable alerts for instant notification
═══════════════════════════════════════════════════════
🎯 BEST PRACTICES:
- Use on liquid markets (Forex majors, indices, crypto)
- Recommended timeframes: 15m, 1H, 4H
- Combine with support/resistance for confirmation
- Adjust lookback period based on market volatility
- Test alert settings before live trading
- Use JSON alerts for automated trading integration
═══════════════════════════════════════════════════════
⚡ ALERT CONFIGURATION:
1. Click the Alert icon (bell) in TradingView
2. Select "Liquidity Swap Detector Ultimate - TITAN v6"
3. Choose your preferred alert condition:
- LONG Signal: Only bullish setups
- SHORT Signal: Only bearish setups
- ANY Signal: All trading opportunities
4. Set expiration and notification preferences
5. For MT5 integration: Select "JSON" message type and configure webhook URL

Smart MACD Volume Trader# Smart MACD Volume Trader
## Overview
Smart MACD Volume Trader is an enhanced momentum indicator that combines the classic MACD (Moving Average Convergence Divergence) oscillator with an intelligent high-volume filter. This combination significantly reduces false signals by ensuring that trading signals are only generated when price momentum is confirmed by substantial volume activity.
The indicator supports over 24 different instruments including major and exotic forex pairs, precious metals (gold and silver), energy commodities (crude oil, natural gas), and industrial metals (copper). For forex and commodity traders, the indicator automatically maps to CME and COMEX futures contracts to provide accurate institutional-grade volume data.
## Originality and Core Concept
Traditional MACD indicators generate signals based solely on price momentum, which can result in numerous false signals during low-activity periods or ranging markets. This indicator addresses this critical weakness by introducing a volume confirmation layer with automatic institutional volume integration.
**What makes this approach original:**
- Signals are triggered only when MACD crossovers coincide with elevated volume activity
- Implements a lookback mechanism to detect volume spikes within recent bars
- Automatically detects and maps 24+ forex pairs and commodities to their corresponding CME and COMEX futures contracts
- Provides real institutional volume data for forex pairs where spot volume is unreliable
- Combines two independent market dimensions (price momentum and volume) into a single, actionable signal
- Includes intelligent asset detection that works across multiple exchanges and ticker formats
**The underlying principle:** Volume validates price movement. When institutional money enters the market, it creates volume signatures. By requiring high volume confirmation and using actual institutional volume data from futures markets, this indicator filters out weak price movements and focuses on trades backed by genuine market participation. The automatic futures mapping ensures that forex and commodity traders always have access to the most accurate volume data available, without manual configuration.
## How It Works
### MACD Component
The indicator calculates MACD using standard methodology:
1. **Fast EMA (default: 12 periods)** - Tracks short-term price momentum
2. **Slow EMA (default: 26 periods)** - Tracks longer-term price momentum
3. **MACD Line** - Difference between Fast EMA and Slow EMA
4. **Signal Line (default: 9-period SMA)** - Smoothed average of MACD line
**Crossover signals:**
- **Bullish:** MACD line crosses above Signal line (momentum turning positive)
- **Bearish:** MACD line crosses below Signal line (momentum turning negative)
### Volume Filter Component
The volume filter adds an essential confirmation layer:
1. **Volume Moving Average** - Calculates exponential MA of volume (default: 20 periods)
2. **High Volume Threshold** - Multiplies MA by ratio (default: 2.0x or 200%)
3. **Volume Detection** - Identifies bars where current volume exceeds threshold
4. **Lookback Period** - Checks if high volume occurred in recent bars (default: 5 bars)
**Signal logic:**
- Buy/Sell signals only trigger when BOTH conditions are met:
- MACD crossover/crossunder occurs
- High volume detected within lookback period
### Automatic CME Futures Integration
For forex traders, spot FX volume data can be unreliable or non-existent. This indicator solves this problem by automatically detecting forex pairs and mapping them to corresponding CME futures contracts with real institutional volume data.
**Supported Major Forex Pairs (7):**
- EURUSD → CME:6E1! (Euro FX Futures)
- GBPUSD → CME:6B1! (British Pound Futures)
- AUDUSD → CME:6A1! (Australian Dollar Futures)
- USDJPY → CME:6J1! (Japanese Yen Futures)
- USDCAD → CME:6C1! (Canadian Dollar Futures)
- USDCHF → CME:6S1! (Swiss Franc Futures)
- NZDUSD → CME:6N1! (New Zealand Dollar Futures)
**Supported Exotic Forex Pairs (4):**
- USDMXN → CME:6M1! (Mexican Peso Futures)
- USDRUB → CME:6R1! (Russian Ruble Futures)
- USDBRL → CME:6L1! (Brazilian Real Futures)
- USDZAR → CME:6Z1! (South African Rand Futures)
**Supported Cross Pairs (6):**
- EURJPY → CME:6E1! (Uses Euro Futures)
- GBPJPY → CME:6B1! (Uses British Pound Futures)
- EURGBP → CME:6E1! (Uses Euro Futures)
- AUDJPY → CME:6A1! (Uses Australian Dollar Futures)
- EURAUD → CME:6E1! (Uses Euro Futures)
- GBPAUD → CME:6B1! (Uses British Pound Futures)
**Supported Precious Metals (2):**
- Gold (XAUUSD, GOLD) → COMEX:GC1! (Gold Futures)
- Silver (XAGUSD, SILVER) → COMEX:SI1! (Silver Futures)
**Supported Energy Commodities (3):**
- WTI Crude Oil (USOIL, WTIUSD) → NYMEX:CL1! (Crude Oil Futures)
- Brent Oil (UKOIL) → NYMEX:BZ1! (Brent Crude Futures)
- Natural Gas (NATGAS) → NYMEX:NG1! (Natural Gas Futures)
**Supported Industrial Metals (1):**
- Copper (COPPER) → COMEX:HG1! (Copper Futures)
**How the automatic detection works:**
The indicator intelligently identifies the asset type by analyzing:
1. Exchange name (FX, OANDA, TVC, COMEX, NYMEX, etc.)
2. Currency pair pattern (6-letter codes like EURUSD, GBPUSD)
3. Commodity identifiers (XAU for gold, XAG for silver, OIL for crude)
When a supported instrument is detected, the indicator automatically switches to the corresponding futures contract for volume analysis. For stocks, cryptocurrencies, and other assets, the indicator uses the native volume data from the current chart.
**Visual feedback:**
An information table appears in the top-right corner of the MACD pane showing:
- Current chart symbol
- Exchange name
- Currency pair or asset name
- Volume source being used (highlighted in orange for futures, yellow for native volume)
- Current high volume status
This provides complete transparency about which data source the indicator is using for its volume analysis.
## How to Use
### Basic Setup
1. Add the indicator to your chart
2. The indicator displays in a separate pane (MACD) and overlay (signals/volume bars)
3. Default settings work well for most assets, but can be customized
### Signal Interpretation
### Visual Signals
**Visual Signals:**
- **Green "BUY" label** - Bullish MACD crossover confirmed by high volume
- **Red "SELL" label** - Bearish MACD crossunder confirmed by high volume
- **Green/Red candles** - Highlight bars with volume exceeding the threshold
- **Light green/red background** - Emphasizes signal bars on the chart
**Information Table:**
A detailed information table appears in the top-right corner of the MACD pane, providing real-time transparency about the indicator's operation:
- **Chart:** Current symbol being analyzed
- **Exchange:** The exchange or data feed being used
- **Pair:** The currency pair or asset name extracted from the ticker
- **Volume From:** The actual symbol used for volume analysis
- Orange color indicates CME or COMEX futures are being used (automatic institutional volume)
- Yellow color indicates native volume from the chart symbol is being used
- Hover tooltip shows whether automatic futures mapping is active
- **High Volume:** Current status showing YES (green) when volume exceeds threshold, NO (gray) otherwise
This table ensures complete transparency and allows you to verify that the correct volume source is being used for your analysis.
**Volume Analysis:**
- Gray histogram bars = Normal volume
- Red histogram bars = High volume (exceeds threshold)
- Green line = Volume moving average baseline
**MACD Analysis:**
- Blue line = MACD line (momentum indicator)
- Orange line = Signal line (trend confirmation)
- Gray dotted line = Zero line (bullish above, bearish below)
### Parameter Customization
**MACD Parameters:**
- Adjust Fast/Slow EMA lengths for different sensitivities
- Shorter periods = More signals, faster response
- Longer periods = Fewer signals, less noise
**Volume Parameters:**
- **Volume MA Period:** Higher values smooth volume analysis
- **High Volume Ratio:** Lower values (1.5x) = More signals; Higher values (3.0x) = Fewer, stronger signals
- **Volume Lookback Bars:** Controls how recent the volume spike must be
**Direction Filters:**
- **Only Buy Signals:** Enables long-only strategy mode
- **Only Sell Signals:** Enables short-only strategy mode
### Alert Configuration
The indicator includes three alert types:
1. **Buy Signal Alert** - Triggers when bullish signal appears
2. **Sell Signal Alert** - Triggers when bearish signal appears
3. **High Volume Alert** - Triggers when volume exceeds threshold
To set up alerts:
1. Click the indicator name → "Add alert on Smart MACD Volume Trader"
2. Select desired alert condition
3. Configure notification method (popup, email, webhook, etc.)
## Trading Strategy Guidelines
### Best Practices
**Recommended markets:**
- Liquid stocks (large-cap, high daily volume)
- Major forex pairs (EURUSD, GBPUSD, USDJPY, AUDUSD, USDCAD, USDCHF, NZDUSD)
- Exotic forex pairs (USDMXN, USDRUB, USDBRL, USDZAR)
- Cross pairs (EURJPY, GBPJPY, EURGBP, AUDJPY, EURAUD, GBPAUD)
- Precious metals (Gold, Silver with automatic COMEX futures mapping)
- Energy commodities (Crude Oil, Natural Gas with automatic NYMEX futures mapping)
- Industrial metals (Copper with automatic COMEX futures mapping)
- Major cryptocurrency pairs
- Index futures and ETFs
**Timeframe recommendations:**
- **Day trading:** 5-minute to 15-minute charts
- **Swing trading:** 1-hour to 4-hour charts
- **Position trading:** Daily charts
**Risk management:**
- Use signals as entry confirmation, not standalone strategy
- Combine with support/resistance levels
- Consider overall market trend direction
- Always use stop-loss orders
### Strategy Examples
**Trend Following Strategy:**
1. Identify overall trend using higher timeframe (e.g., daily chart)
2. Trade only in trend direction
3. Use "Only Buy" filter in uptrends, "Only Sell" in downtrends
4. Enter on signal, exit on opposite signal or at resistance/support
**Volume Breakout Strategy:**
1. Wait for consolidation period (low volume, tight MACD range)
2. Enter when signal appears with high volume (confirms breakout)
3. Target previous swing highs/lows
4. Stop loss below/above recent consolidation
**Forex Scalping Strategy (with automatic CME futures):**
1. The indicator automatically detects forex pairs and uses CME futures volume
2. Trade during active sessions only (use session filter)
3. Focus on quick profits (10-20 pips)
4. Exit at opposite signal or profit target
**Commodities Trading Strategy (Gold, Silver, Oil):**
1. The indicator automatically maps to COMEX and NYMEX futures contracts
2. Trade during high-liquidity sessions (overlap of major markets)
3. Use the high volume confirmation to identify institutional entry points
4. Combine with key support and resistance levels for entries
5. Monitor the information table to confirm futures volume is being used (orange color)
6. Exit on opposite MACD signal or at predefined profit targets
## Why This Combination Works
### The Volume Advantage
Studies consistently show that price movements accompanied by high volume are more likely to continue, while low-volume movements often reverse. This indicator leverages this principle by requiring volume confirmation.
**Key benefits:**
1. **Reduced False Signals:** Eliminates MACD whipsaws during low-volume consolidation
2. **Confirmation Bias:** Two independent indicators (price momentum + volume) agreeing
3. **Institutional Alignment:** High volume often indicates institutional participation
4. **Trend Validation:** Volume confirms that price momentum has "conviction"
### Statistical Edge
By combining two uncorrelated signals (MACD crossovers and volume spikes), the indicator creates a higher-probability setup than either signal alone. The lookback mechanism ensures signals aren't missed if volume spike slightly precedes the MACD cross.
## Supported Exchanges and Automatic Detection
The indicator includes intelligent asset detection that works across multiple exchanges and ticker formats:
**Forex Exchanges (Automatic CME Mapping):**
- FX (TradingView forex feed)
- OANDA
- FXCM
- SAXO
- FOREXCOM
- PEPPERSTONE
- EASYMARKETS
- FX_IDC
**Commodity Exchanges (Automatic COMEX/NYMEX Mapping):**
- TVC (TradingView commodity feed)
- COMEX (directly)
- NYMEX (directly)
- ICEUS
**Other Asset Classes (Native Volume):**
- Stock exchanges (NASDAQ, NYSE, AMEX, etc.)
- Cryptocurrency exchanges (BINANCE, COINBASE, KRAKEN, etc.)
- Index providers (SP, DJ, etc.)
The detection algorithm analyzes three factors:
1. Exchange prefix in the ticker symbol
2. Pattern matching for currency pairs (6-letter codes)
3. Commodity identifiers in the symbol name
This ensures accurate automatic detection regardless of which data feed or exchange you use for charting. The information table in the top-right corner always displays which volume source is being used, providing complete transparency.
## Technical Details
**Calculations:**
- MACD Fast MA: EMA(close, fastLength)
- MACD Slow MA: EMA(close, slowLength)
- MACD Line: Fast MA - Slow MA
- Signal Line: SMA(MACD Line, signalLength)
- Volume MA: Exponential MA of volume
- High Volume: Current volume >= Volume MA × Ratio
**Signal logic:**
```
Buy Signal = (MACD crosses above Signal) AND (High volume in last N bars)
Sell Signal = (MACD crosses below Signal) AND (High volume in last N bars)
```
## Parameters Reference
| Parameter | Default | Description |
|-----------|---------|-------------|
| Volume Symbol | Blank | Manual override for volume source (leave blank for automatic detection) |
| Use CME Futures | False | Legacy option (automatic detection is now built-in) |
| Alert Session | 1530-2200 | Active session time range for alerts |
| Timezone | UTC+1 | Timezone for alert sessions |
| Volume MA Period | 20 | Number of periods for volume moving average |
| High Volume Ratio | 2.0 | Volume threshold multiplier (2.0 = 200% of average) |
| Volume Lookback | 5 | Number of bars to check for high volume confirmation |
| MACD Fast Length | 12 | Fast EMA period for MACD calculation |
| MACD Slow Length | 26 | Slow EMA period for MACD calculation |
| MACD Signal Length | 9 | Signal line SMA period |
| Only Buy | False | Filter to show only bullish signals |
| Only Sell | False | Filter to show only bearish signals |
| Show Signals | True | Display buy and sell labels on chart |
## Optimization Tips
**For volatile markets (crypto, small caps):**
- Increase High Volume Ratio to 2.5-3.0
- Reduce Volume Lookback to 3-4 bars
- Consider faster MACD settings (8, 17, 9)
**For stable markets (large-cap stocks, bonds):**
- Decrease High Volume Ratio to 1.5-1.8
- Increase Volume MA Period to 30-50
- Use standard MACD settings
**For forex (with automatic CME futures):**
- The indicator automatically uses CME futures when forex pairs are detected
- Set appropriate trading session based on your timezone
- Use Volume Lookback of 5-7 bars
- Consider session-based alerts only
- Monitor the information table to verify correct futures mapping
**For commodities (Gold, Silver, Oil, Copper):**
- The indicator automatically maps to COMEX and NYMEX futures
- Increase High Volume Ratio to 2.0-2.5 for metals
- Use slightly higher Volume MA Period (25-30) for smoother analysis
- Trade during active market hours for best volume data
- The information table will show the futures contract being used (orange highlight)
## Limitations and Considerations
**What this indicator does NOT do:**
- Does not predict future price direction
- Does not guarantee profitable trades
- Does not replace proper risk management
- Does not work well in extremely low-volume conditions
**Market conditions to avoid:**
- Pre-market and after-hours sessions (low volume)
- Major news events (volatile, unpredictable volume)
- Holidays and low-liquidity periods
- Extremely low float stocks
## Conclusion
Smart MACD Volume Trader represents a significant evolution of the traditional MACD indicator by combining volume confirmation with automatic institutional volume integration. This dual-confirmation approach significantly improves signal quality by filtering out low-conviction price movements and ensuring traders work with accurate volume data.
The indicator's automatic detection and mapping system supports over 24 instruments across forex, commodities, and metals markets. By intelligently switching to CME and COMEX futures contracts when appropriate, the indicator provides forex and commodity traders with the same quality of volume data that stock traders naturally have access to.
This indicator is particularly valuable for traders who want to:
- Align their entries with institutional money flow
- Avoid getting trapped in false breakouts
- Trade forex pairs with reliable volume data
- Access accurate volume information for gold, silver, and energy commodities
- Combine momentum and volume analysis in a single, streamlined tool
Whether you are day trading stocks, swing trading forex pairs, or positioning in commodities markets, this indicator provides a robust framework for identifying high-probability momentum trades backed by genuine institutional participation. The automatic futures mapping works seamlessly across all supported instruments, requiring no manual configuration or expertise in futures markets.
---
## Support and Updates
This indicator is actively maintained and updated based on user feedback and market conditions. For questions about implementation or custom modifications, please use the comments section below.
**Disclaimer:** This indicator is for educational and informational purposes only. Past performance does not guarantee future results. Always conduct your own analysis and risk management before trading.

Indian Gold Festival Dates HistoricalIndian Gold Festival Dates (1975-2025)
Marks 8 major Indian festivals associated with gold buying over 50 years of historical data. Essential for analyzing seasonal patterns and cultural demand cycles in gold markets.
Festivals Included:
Dhanteras (Gold) - Most auspicious gold buying day
Diwali (Orange) - Festival of Lights
Akshaya Tritiya (Green) - "Never-ending" prosperity
Dussehra (Red) - Victory and success
Makar Sankranti (Cyan) - Solar new year
Gudi Padwa (Magenta) - Hindu New Year (Maharashtra)
Ugadi (Purple) - Hindu New Year (South India)
Navratri (Yellow) - 9-day festival
Features:
✓ 408 exact historical dates (1975-2025)
✓ Color-coded vertical lines for easy identification
✓ Toggle individual festivals on/off
✓ Adjustable line width and labels
✓ Works on all timeframes (best on daily/weekly)
Perfect for traders analyzing gold seasonality, Indian market sentiment, and cultural demand patterns. Use on XAUUSD, GC1!, or Indian gold futures.

Fair Value Lead-Lag Model [BackQuant]Fair Value Lead-Lag Model
A cross-asset model that estimates where price "should" be relative to a chosen reference series, then tracks the deviation as a normalized oscillator. It helps you answer two questions: 1) is the asset rich or cheap vs its driver, and 2) is the driver leading or lagging price over the next N bars.
Concept in one paragraph
Many assets co-move with a macro or sector driver. Think BTC vs DXY, gold vs real yields, a stock vs its sector ETF. This tool builds a rolling fair value of the charted asset from a reference series and shows how far price is above or below that fair value in standard deviation units. You can shift the reference forward or backward to test who leads whom, then use the deviation and its bands to structure mean-reversion or trend-following ideas.
What the model does
Reference mapping : Pulls a reference symbol at a chosen timeframe, with an optional lead or lag in bars to test causality.
Fair value engine : Converts the reference into a synthetic fair value of the chart using one of four methods:
Ratio : price/ref with a rolling average ratio. Good when the relationship is proportional.
Spread : price minus ref with a rolling average spread. Good when the relationship is additive.
Z-Score : normalizes both series, aligns on standardized units, then re-projects to price space. Good when scale drifts.
Beta-Adjusted : rolling regression style. Uses covariance and variance to compute beta, then builds a fair value = mean(price) + beta * (ref − mean(ref)).
Deviation and bands : Computes a z-scored deviation of price vs fair value and plots sigma bands (±1, ±2, ±3) around the fair value line on the chart.
Correlation context : Shows rolling correlation so you can judge if deviations are meaningful or just noise when co-movement is weak.
Visuals :
Fair value line on price chart with sigma envelopes.
Deviation as a column oscillator and optional line.
Threshold shading beyond user-set upper and lower levels.
Summary table with reference, deviation, status, correlation, and method.
Why this is useful
Mean reversion framework : When correlation is healthy and deviation stretches beyond your sigma threshold, probability favors reversion toward fair value. This is classic pairs logic adapted to a driver and a target.
Trend confirmation : If price rides the fair value line and deviation stays modest while correlation is positive, it supports trend persistence. Pullbacks to negative deviation in an uptrend can be buyable.
Lead-lag discovery : Shift the reference forward by +N bars. If correlation improves, the reference tends to lead. Shift backward for the reverse. Use the best setting for planning early entries or hedges.
Regime detection : Large persistent deviations with falling correlation hint at regime change. The relationship you relied on may be breaking down, so reduce confidence or switch methods.
How to use it step by step
Pick a sensible reference : Choose a macro, index, currency, or sector driver that logically explains the asset’s moves. Example: gold with DXY, a semiconductor stock with SOXX.
Test lead-lag : Nudge Lead/Lag Periods to small positive values like +1 to +5 to see if the reference leads. If correlation improves, keep that offset. If correlation worsens, try a small negative value or zero.
Select a method :
Start with Beta-Adjusted when the relationship is approximately linear with drift.
Use Ratio if the assets usually move in proportional terms.
Use Spread when they trade around a level difference.
Use Z-Score when scales wander or volatility regimes shift.
Tune windows :
Rolling Window controls how quickly fair value adapts. Shorter equals faster but noisier.
Normalization Period controls how deviations are standardized. Longer equals stabler sigma sizing.
Correlation Length controls how co-movement is measured. Keep it near the fair value window.
Trade the edges :
Mean reversion idea : Wait for deviation beyond your Upper or Lower Threshold with positive correlation. Fade back toward fair value. Exit at the fair value line or the next inner sigma band.
Trend idea : In an uptrend, buy pullbacks when deviation dips negative but correlation remains healthy. In a downtrend, sell bounces when deviation spikes positive.
Read the table : Deviation shows how many sigmas you are from fair value. Status tells you overvalued or undervalued. Correlation color hints confidence. Method tells you the projection style used.
Reading the display
Fair value line on price chart: the model’s estimate of where price should trade given the reference, updated each bar.
Sigma bands around fair value: a quick sense of residual volatility. Reversions often target inner bands first.
Deviation oscillator : above zero means rich vs fair value, below zero means cheap. Color bins intensify with distance.
Correlation line (optional): scale is folded to match thresholds. Higher values increase trust in deviations.
Parameter tips
Start with Rolling Window 20 to 30, Normalization Period 100, Correlation Length 50.
Upper and Lower Threshold at ±2.0 are classic. Tighten to ±1.5 for more signals or widen to ±2.5 to focus on outliers.
When correlation drifts below about 0.3, treat deviations with caution. Consider switching method or reference.
If the fair value line whipsaws, increase Rolling Window or move to Beta-Adjusted which tends to be smoother.
Playbook examples
Pairs-style reversion : Asset is +2.3 sigma rich vs reference, correlation 0.65, trend flat. Short the deviation back toward fair value. Cover near the fair value line or +1 sigma.
Pro-trend pullback : Uptrend with correlation 0.7. Deviation dips to −1.2 sigma while price sits near the −1 sigma band. Buy the dip, target the fair value line, trail if the line is rising.
Lead-lag timing : Reference leads by +3 bars with improved correlation. Use reference swings as early cues to anticipate deviation turns on the target.
Caveats
The model assumes a stable relationship over the chosen windows. Structural breaks, policy shocks, and index rebalances can invalidate recent history.
Correlation is descriptive, not causal. A strong correlation does not guarantee future convergence.
Do not force trades when the reference has low liquidity or mismatched hours. Use a reference timeframe that captures real overlap.
Bottom line
This tool turns a loose cross-asset intuition into a quantified, visual fair value map. It gives you a consistent way to find rich or cheap conditions, time mean-reversion toward a statistically grounded target, and confirm or fade trends when the driver agrees.
