Borna Zones Entry First Close BreakThis indicator marks close-based entry signals for DAX / GER40 on the 1-minute timeframe, using two fixed intraday zones:
08:00 candle → Zone 08
09:00 candle → Zone 09
If the zones overlap, an entry is marked on the first candle close breaking the combined zone.
If the zones are separated, an entry is marked on the first candle close breaking the 09:00 zone, in the direction of the 08:00 zone.
Entries are shown only between 09:00 and 11:00 and only on the first valid breakout (no repeated signals).
Concept

Volume Edge Pro[wjdtks255]Volume Edge Pro: Indicator Description
Volume Edge Pro is an advanced volume analysis tool designed to identify institutional accumulation and significant supply levels. Unlike standard volume bars, this indicator categorizes trading volume into four distinct types based on price action and historical comparisons, helping traders spot high-probability breakout opportunities.
Key Components:
Blue Bars (PPV - Pocket Pivot Volume): Indicates institutional accumulation. It appears when up-day volume exceeds the highest down-day volume of the last 10 trading sessions.
Green Bars (RGV - Recent Green Volume): Represents strong buying pressure where up-day volume is higher than the 50-period moving average.
Red Bars (RRV - Recent Red Volume): Signifies heavy supply or selling pressure where down-day volume is higher than the 50-period moving average.
Grey Bars: Represents standard market volume without significant institutional involvement.
Trading Strategy (How to Trade)
1. Identifying Accumulation (The Base)
Look for multiple Blue Bars (PPV) during a consolidation phase or within a "base." This suggests that "Smart Money" is quietly accumulating shares without significantly driving up the price yet.
2. The Buy Signal
The ideal entry point is when the price breaks out of a consolidation resistance level, especially when the breakout is confirmed by a Blue (PPV) or Green (RGV) bar. The presence of PPV signals within the base increases the reliability of the breakout.
3. Overcoming Supply (The RRV Rule)
When a Red Bar (RRV) appears, it marks a level of "unconsumed supply."
Treat the high of the RRV candle as a resistance level.
A bullish reversal or continuation is confirmed only when the price reclaims the high of the RRV day or when subsequent PPVs/RGVs overwhelm the previous selling volume.
4. Risk Management
If a massive Red Bar (RRV) appears after a long uptrend and the price breaks below the prior support, it may indicate institutional distribution (selling), signaling a time to exit or tighten stop-losses.

XAUUSD 240m Pivot PointsThis Indicator helps you to automatically find pivot point S1 S2 S3 R1 R2 and R3 for each and every candle that occurs in 4 hr tf

Master Strategy: BTC W1 Mean Reversion [Institutional SOP]Overview This is an institutional-grade Mean Reversion and Range Rotation strategy designed specifically for Bitcoin (BTC/USDT) Perpetual Futures. It operates on the philosophy that liquidity resides at the extremes of the previous week's range (Previous Week High/Low). The strategy looks for false breakouts (Sweeps) followed by a confirmed return to the range (Reclaim), targeting the weekly equilibrium (EQ).
Core Logic: The Deviation Play Unlike standard breakout strategies, this indicator hunts for trapped liquidity.
Weekly Levels (Fixed): It calculates PWH (Previous Week High) and PWL (Previous Week Low) based on confirmed, closed weekly data. These levels act as the "Box" for the current week.
The Sweep: We wait for price to pierce the PWH or PWL (taking liquidity/stops). The script uses a dynamic ATR-based threshold to filter out noise (micro-pokes).
The Reclaim (4H Close): A signal is generated ONLY if a 4H candle closes back inside the weekly range shortly after the sweep. This confirms rejection of higher/lower prices.
The Entry: The script suggests a Limit Order at the retested level (PWH/PWL) to maximize R:R.
Institutional Quality Filters ("Kill Switches") To prevent trading in unfavorable conditions, the script includes strict SOP (Standard Operating Procedure) filters:
Trend Filter (ADX): Blocks mean reversion signals if the daily trend is too strong (ADX > 25).
Expansion Filter: Blocks signals if price accepted levels outside the range for too long (prevents fighting a true breakout).
Weekly Range Filter: Filters out weeks that are statistically too tight (chop) or too wide (expansion).
Time Filter: A reclaim must happen within a set number of 4H bars after the sweep (default: 3).
Key Features
Zero Repainting: Logic is based strictly on closed candles ( , , ).
State Machine Logic: Uses internal memory to track sweeps regardless of chart timeframe glitches.
Operational Dashboard: Displays current status, countdown to next decision candle (4H close), and exact parameters for the last valid signal (Entry, SL, TP).
Unified Alerting: A single "Any function call" alert handles both Long and Short scenarios dynamically.
Clean Visuals: Levels are plotted with line breaks to avoid visual clutter between weeks.
How to Use
Timeframe: Set your chart to 4H. This is crucial as the logic relies on 4H closes.
Signals: Wait for the "4H RECLAIM" label.
Execution: Place a Limit Order at the suggested Level (PWH/PWL).
Stop Loss: Use the calculated SL provided by the indicator (Swing extreme + ATR buffer).
Target: TP1 is always the EQ (Equilibrium/Mid-range).

SB A / A++ ALERT ENGINE (Alerts Only)SB A / A++ Alert Engine
Session-Based Level Rejection Strategy (Automation-Ready)
Overview
The SB A / A++ Alert Engine is a rules-based TradingView indicator designed to identify high-probability institutional-style reversal trades using Stacey Burke–inspired concepts such as previous day levels, session structure, opening ranges, and round numbers.
This tool is alerts-only by design, making it ideal for:
TradingView alerts
Webhook automation
Telegram / Discord signal delivery
External trade execution systems
It does not repaint and evaluates signals on confirmed bar close only.
---
Core Trading Idea
Price frequently reacts at important reference levels during active trading sessions.
This script looks for rejection + confirmation at those levels and grades setups based on confluence and candle quality.
Only A-grade and A++-grade setups are alerted.
---
What the Script Detects
📌 Key Levels (Confluence Engine)
Previous Day High / Low
Initial Balance (Mon–Tue range, active Wed–Fri)
Session Opening Range (first hour of London / NY)
Round Numbers (configurable tick spacing)
Each level touched contributes to confluence — without double-counting the same zone.
---
🕒 Session Control
Signals are only allowed during:
London Session
New York Session
Includes:
Session resets
Max alerts per session
Cooldown between signals
---
🔎 Candle Confirmation
Valid signals require clear rejection behavior, such as:
Bullish / Bearish Engulfing candle
Strong Pin Bar (wick ≥ 2× body)
---
🧠 Trade Grades
A Trade
Valid session
ATR percentile filter passed
≥ 1 level of confluence
Directional rejection
A++ Trade
All A-Trade rules
Strong confirmation candle (engulf or pin)
≥ 2 independent confluence zones
Grades are displayed visually and included in alert payloads.
---
📊 Volatility Filter (ATR Percentile)
Instead of fixed ATR thresholds, the script uses an ATR percentile rank, ensuring trades only trigger when volatility is above normal for that market.
This adapts automatically across:
Forex
Indices
Futures
Crypto
---
Visual Output
▲ Green / Lime triangles → LONG (A / A++)
▼ Orange / Red triangles → SHORT (A / A++)
Color intensity reflects trade grade
Optional session shading (if enabled)
---
Alerts & Automation
All alerts are webhook-ready and structured for automation.
Each alert includes:
Symbol
Timeframe
Direction (LONG / SHORT)
Trade grade (A or A++)
Confluence count
Entry price (close of signal bar)
Designed to integrate with:
Telegram bots
Trade execution bridges
Risk management engines
---
What This Script Is (and Is Not)
✅ IS
A high-quality signal engine
Non-repainting
Automation-friendly
Institutional level-based logic
❌ IS NOT
A scalping indicator
A prediction tool
A “trade every candle” system
This tool favors patience, structure, and quality over frequency.
---
Recommended Usage
Timeframes: M5 – M15
Best markets: FX majors, indices, liquid crypto
Combine with your own execution, risk, and trade management rules
---
⚠️ Disclaimer
This script is for educational and informational purposes only. It does not constitute financial advice. Always test on demo or paper trading before using live capital.

Order Blocks & ImbalanceThis indicator automatically identifies and plots Order Blocks (also known as Fair Value Gaps or Imbalances) based on Smart Money Concepts (SMC) and ICT methodology. It detects significant price inefficiencies (gaps between candles) that often act as institutional supply or demand zones.
How It Works (Technical Methodology)
1. Fair Value Gap (FVG) Detection
The indicator identifies classic 3-candle imbalances:
- Bullish Order Block (Demand): When the low of the current candle is significantly below the high of the candle two bars ago (low - high ).
- Bearish Order Block (Supply): When the high of the current candle is significantly above the low of the candle two bars ago (low - high ).
A minimum size threshold is enforced using ATR(14) × user-defined multiplier (default 0.5) to filter out minor gaps and focus on meaningful inefficiencies.
2. Zone Creation
- Bullish zones are created at the candle two bars ago (the "origin" candle where inefficiency occurred).
- Bearish zones use the same origin candle.
- Zone boundaries:
Top = high of origin candle
Bottom = low of origin candle
This captures the full range where price moved aggressively, leaving an imbalance that institutions may later revisit.
3. Mitigation Detection
Zones can be mitigated in two ways (user-selectable):
- "Close": Zone is considered touched only if the close price enters the zone.
- "Wick": Zone is touched if any wick (high/low) enters the zone (more sensitive).
When mitigated:
- Background becomes more transparent
- Border turns dotted
- Label changes to "Mitigated"
Broken zones (price fully closes beyond the opposite side) are automatically deleted.
4. Zone Lifecycle Management
- Active Zone: Strong color fill (green for demand, red for supply) with solid border.
- Mitigated Zone: Faded color, dotted border – indicates partial fill or reduced strength.
- Broken Zone: Automatically removed from chart to reduce clutter.
Old zones are also pruned when exceeding 450 total to maintain performance.
5. Smart Visibility Engine (Optional)
When enabled:
- All zones are initially hidden.
- Only the closest relevant zones are shown:
- Up to user-defined limit (default 10) highest bullish zones (closest below price)
- Up to user-defined limit (default 10) lowest bearish zones (closest above price)
- Visible zones are automatically extended to the right and styled appropriately.
This keeps the chart clean while highlighting the most actionable zones near current price.
6. Visual Elements
- Demand Zones: Green fill, labeled "OB Demand"
- Supply Zones: Red fill, labeled "OB Supply"
- Tiny text size to minimize chart clutter
- Zones drawn as boxes using bar_index positioning
How to Use
Order Blocks represent areas of price inefficiency where smart money likely entered/exited positions aggressively.
- Demand Zones (Green): Potential long entry areas when price returns. Expect buying pressure to defend these levels. Best setups when price retests an active (non-mitigated) zone.
- Supply Zones (Red): Potential short entry areas when price returns. Expect selling pressure to emerge.
- Mitigated Zones: Lower probability – may act as weaker support/resistance.
- Smart Visibility: Highly recommended for cleaner charts. Focuses attention on zones most likely to be tested soon.
- Combine with:
- Break of Structure (BOS)/Change of Character (CHOCH)
- Liquidity grabs
- Higher timeframe confluence
- Volume or momentum confirmation
Use higher FVG threshold (e.g., 0.8–1.0) for fewer, higher-quality zones. Lower threshold for more aggressive detection.
Disclaimer
This indicator is a technical analysis tool and should be used in conjunction with other forms of analysis. Past performance does not guarantee future results. Always use proper risk management.


V3 Valentini Pro Scalper [Dashboard]Gemini 3.0 pro's take on Fabio Valentini's world #1 strategy scalp 12/19/2025

First Candle Range (FCR) Gold Strategy - EtubersThe 18:00 (6:00 PM) candle is widely used by traders in the Forex and Futures markets because it marks the New York market rollover and the start of the Asian session.
How the Strategy Works:
- The Range: The High and Low prices of the 1-hour candle (18:00–19:00) create a "Supply and Demand" zone.
- The Breakout: A candle closing above the high signals a bullish breakout; a candle closing below the low signals a bearish breakout.
- Institutional Memory: By extending this zone forward for 4 days, traders can identify where "old" 18:00 levels act as support or resistance in the future.
- Execution: Traders often wait for a breakout followed by a "retest" of the box boundary to enter a high-probability trade.

Wavelet Candle Constructor (Inc. Morlet) 2Here is the detailed description of the **Wavelet Candle** construction principles based on the code provided.
This indicator is not a simple smoothing mechanism (like a Moving Average). It utilizes the **Discrete Wavelet Transform (DWT)**, specifically the Stationary variant (SWT / à Trous Algorithm), to separate "noise" (high frequencies) from the "trend" (low frequencies).
Here is how it works step-by-step:
###1. The Wavelet Kernel (Coefficients)The heart of the algorithm lies in the coefficients (the `h` array in the `get_coeffs` function). Each wavelet type represents a different set of mathematical weights that define how price data is analyzed:
* **Haar:** The simplest wavelet. It acts like a simple average of neighboring candles. It reacts quickly but produces a "boxy" or "jagged" output.
* **Daubechies 4:** An asymmetric wavelet. It is better at detecting sudden trend changes and the fractal structure of the market, though it introduces a slight phase shift.
* **Symlet / Coiflet:** More symmetric than Daubechies. They attempt to minimize lag (phase shift) while maintaining smoothness.
* **Morlet (Gaussian):** Implemented in this code as a Gaussian approximation (bell curve). It provides the smoothest, most "organic" effect, ideal for filtering noise without jagged edges.
###2. The Convolution EngineInstead of a simple average, the code performs a mathematical operation called **convolution**:
For every candle on the chart, the algorithm takes past prices, multiplies them by the Wavelet Kernel weights, and sums them up. This acts as a **digital low-pass filter**—it allows the main price movements to pass through while cutting out the noise.
###3. The "à Trous" Algorithm (Stationary Wavelet Transform)This is the key difference between this indicator and standard data compression.
In a classic wavelet transform, every second data point is usually discarded (downsampling). Here, the **Stationary** approach is used:
* **Level 1:** Convolution every **1** candle.
* **Level 2:** Convolution every **2** candles (skipping one in between).
* **Level 3:** Convolution every **4** candles.
* **Level 4:** Convolution every **8** candles.
Because of this, **we do not lose time resolution**. The Wavelet Candle is drawn exactly where the original candle is, but it represents the trend structure from a broader perspective. The higher the `Decomposition Level`, the deeper the denoising (looking at a wider context).
###4. Independent OHLC ProcessingThe algorithm processes each component of the candle separately:
1. Filters the **Open** series.
2. Filters the **High** series.
3. Filters the **Low** series.
4. Filters the **Close** series.
This results in four smoothed curves: `w_open`, `w_high`, `w_low`, `w_close`.
###5. Geometric Reconstruction (Logic Repair)Since each price series is filtered independently, the mathematics can sometimes lead to physically impossible situations (e.g., the smoothed `Low` being higher than the smoothed `High`).
The code includes a repair section:
```pinescript
real_high = math.max(w_high, w_low)
real_high := math.max(real_high, math.max(w_open, w_close))
// Same logic for Low (math.min)
```
This guarantees that the final Wavelet Candle always has a valid construction: wicks encapsulate the body, and the `High` is strictly the highest point.
---
###Summary of ApplicationThis construction makes the Wavelet Candle an **excellent trend-following tool**.
* If the candle is **green**, it means that after filtering the noise (according to the selected wavelet), the market energy is bullish.
* If it is **red**, the energy is bearish.
* The wicks show volatility that exists within the bounds of the selected decomposition level.
Here is a descriptive comparison of **Wavelet Candles** against other popular chart types. As requested, this is a narrative explanation focusing on the differences in mechanics, interpretation philosophy, and the specific pros and cons of each approach.
---
###1. Wavelet Candles vs. Standard (Japanese) CandlesThis is a clash between "the raw truth" and "mathematical interpretation." Standard Japanese candles display raw market data—exactly what happened on the exchange. Wavelet Candles are a synthetic image created by a signal processor.
**Differences and Philosophy:**
A standard candle is full of emotion and noise. Every single price tick impacts its shape. The Wavelet Candle treats this noise as interference that must be removed to reveal the true energy of the trend. Wavelets decompose the price, reject high frequencies (noise), and reconstruct the candle using only low frequencies (the trend).
* **Wavelet Advantages:** The main advantage is clarity. Where a standard chart shows a series of confusing candles (e.g., a long green one, followed by a short red one, then a doji), the Wavelet Candle often draws a smooth, uniform wave in a single color. This makes it psychologically easier to hold a position and ignore temporary pullbacks.
* **Wavelet Disadvantages:** The biggest drawback is the loss of price precision. The Open, Close, High, and Low values on a Wavelet candle are calculated, not real. You **cannot** place Stop Loss orders or enter trades based on these levels, as the actual market price might be in a completely different place than the smoothed candle suggests. They also introduce lag, which depends on the chosen wavelet—whereas a standard candle reacts instantly.
###2. Wavelet Candles vs. Heikin AshiThese are close cousins, but they share very different "DNA." Both methods aim to smooth the trend, but they achieve it differently.
**Differences and Philosophy:**
Heikin Ashi (HA) is based on a simple recursive arithmetic average. The current HA candle depends on the previous one, making it react linearly.
The Wavelet Candle uses **convolution**. This means the shape of the current candle depends on a "window" (group) of past candles multiplied by weights (Gaussian curve, Daubechies, etc.). This results in a more "organic" and elastic reaction.
* **Wavelet Advantages:** Wavelets are highly customizable. With Heikin Ashi, you are stuck with one algorithm. With Wavelet Candles, you can change the kernel to "Haar" for a fast (boxy) reaction or "Morlet" for an ultra-smooth, wave-like effect. Wavelets handle the separation of market cycles better than simple HA averaging, which can generate many false color flips during consolidation.
* **Wavelet Disadvantages:** They are computationally much more complex and harder to understand intuitively ("Why is this candle red if the price is going up?"). In strong, vertical breakouts (pumps), Heikin Ashi often "chases" the price faster, whereas deep wavelet decomposition (High Level) may show more inertia and change color more slowly.
###3. Wavelet Candles vs. RenkoThis compares two different dimensions: Time vs. Price.
**Differences and Philosophy:**
Renko completely ignores time. A new brick is formed only when the price moves by a specific amount. If the market stands still for 5 hours, nothing happens on a Renko chart.
The Wavelet Candle is **time-synchronous**. If the market stands still for 5 hours, the Wavelet algorithm will draw a series of flat, small candles (the "wavelet decays").
* **Wavelet Advantages:** They preserve the context of time, which is crucial for traders who consider trading sessions (London/New York) or macroeconomic data releases. On a wavelet chart, you can see when volatility drops (candles become small), whereas Renko hides periods of stagnation, which can be misleading for options traders or intraday strategies.
* **Wavelet Disadvantages:** In sideways trends (chop), Wavelet Candles—despite the smoothing—will still draw a "snake" that flips colors (unless you set a very high decomposition level). Renko can remain perfectly clean and static during the same period, not drawing any new bricks, which for many traders is the ultimate filter against overtrading in a flat market.
###Summary**Wavelet Candles** are a tool for the analyst who wants to visualize the **structure of the wave and market cycle**, accepting some lag in exchange for noise reduction, but without giving up the time axis (like in Renko) or relying on simple averaging (like in Heikin Ashi). It serves best as a "roadmap" for the trend rather than a "sniper scope" for precise entries.

Hybrid Trend-Following Inside Bar BreakoutHybrid Trend-Following Inside Bar Breakout Strategy
The Hybrid Trend-Following Inside Bar Breakout Strategy is a rule-based trading system designed to capture strong directional moves while controlling risk during uncertain market conditions. It combines trend-following, price action, and volatility-based risk management into a single robust framework.
Core Concept
The strategy trades inside bar breakouts only in the direction of the dominant market trend. Inside bars represent periods of consolidation, and when price breaks out of this consolidation in a trending market, it often leads to impulsive moves with favorable risk–reward characteristics.
Key Components
1. Trend Filter
Uses 50 EMA and 200 EMA to define the market trend.
Bullish bias: 50 EMA above 200 EMA
Bearish bias: 50 EMA below 200 EMA
This filter prevents counter-trend trades and improves trade quality.
2. Volatility Filter
Compares fast ATR (14) with slow ATR (50).
Trades are taken only when volatility is expanding or above a minimum threshold.
This avoids low-volatility, choppy market conditions.
3. Inside Bar Breakout
An inside bar forms when the current candle’s high is lower than the previous candle’s high and the low is higher than the previous candle’s low.
A trade is triggered only when price breaks above or below the inside bar range in the direction of the trend.
4. Candle Quality Filter
Requires a minimum body-to-range ratio, ensuring that the breakout candle has strong momentum and is not driven by weak wicks.
Risk Management & Trade Management
Stop Loss (SL)
Placed using ATR-based dynamic stops, adapting to current market volatility.
Prevents tight stops in volatile conditions and wide stops in calm markets.
Partial Profit Taking
50% of the position is exited at 1.5R, locking in profits early.
This reduces psychological pressure and improves equity stability.
Trailing Stop
After partial profit is taken, the remaining position is managed with an ATR-based trailing stop.
Allows the strategy to capture large trend moves while protecting gains.
Cooldown Mechanism
After a losing trade, the system enters a cooldown period and skips a fixed number of bars.
This helps avoid revenge trading and overtrading during unfavorable market phases.
Why This Strategy Works
Trades only high-probability breakouts in trending markets
Adapts automatically to changing volatility
Combines price action precision with systematic risk control
Designed for consistent performance over long historical periods

Reentry BUY SELL OnlyReentry BBMA tapi per 4 jam sekali,,
Entri di time frame m15 folow buy dan sellnya

Kinetic RSI [Vel + Accel] + AlertsThe Problem with Standard RSI
Most traders use the Relative Strength Index (RSI) to see if a market is "Overbought" (above 70) or "Oversold" (below 30). The problem? A strong trend can stay overbought for days, burning short sellers, or an asset can stay oversold while price continues to crash. Standard RSI tells you where the price is, but it doesn't tell you how hard it is moving.
The Solution: Kinetic RSI
This script reimagines RSI by applying basic physics concepts: Velocity and Acceleration.
Instead of asking "Is RSI below 30?", this indicator asks: "Is RSI below 35 AND did it just make a violent, high-speed turn upwards?"
It filters out lazy, drifting price action and only signals when momentum is accelerating in a new direction.
How It Works (The Math)
Velocity: We calculate the speed of the RSI change (Current RSI - Previous RSI).
Acceleration: We calculate if that speed is increasing (Current Velocity - Previous Velocity).
The Trigger: A signal is only generated if the RSI is in an extreme zone (<35 or >65) AND it has high Velocity AND positive Acceleration.
How to Trade It
1. The "Kick" Signals (Background Highlights)
🟢 Green Background (Bullish Kick): The RSI was low, but buyers stepped in aggressively. The momentum is not just positive; it is accelerating upward. This is often a "V-Bottom" catch.
🔴 Red Background (Bearish Kick): The RSI was high, but sellers slammed the price down. Momentum is accelerating downward.
2. The Line Color
Lime Line: Velocity is positive (Momentum is rising).
Fuchsia Line: Velocity is negative (Momentum is falling).
Usage: If the background flashes Green (Buy Signal), but the line turns back to Fuchsia (Red) a few bars later, the move has failed—exit the trade.
Settings & Alerts
RSI Length: Standard 14 (Adjustable).
Velocity Threshold: Controls sensitivity.
Lower (e.g., 2-3): More signals, catches smaller reversals.
Higher (e.g., 5+): Fewer signals, catches only massive "shocks" to the price.
Alerts Included: You can set alerts for "Bullish Kick," "Bearish Kick," or "Any Kick" to get notified of volatility spikes.
Best Practices
Wait for the Close: This indicator measures the closing velocity. Always wait for the bar to close to confirm the background color signal.
Trend Filtering: This works best as a "Reversal" indicator. If the market is in a super-strong uptrend, ignore the Bearish (Red) signals and only take the Bullish (Green) dips.

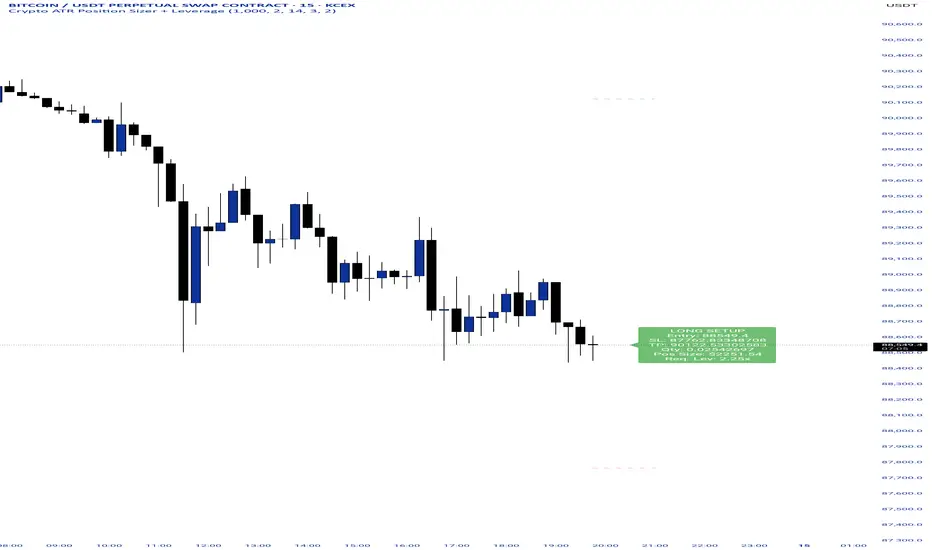
Crypto ATR Position Sizer + LeverageThis indicator is a "heads-up display" for crypto traders who need real time risk management without manually calculating position sizes. It uses Average True Range (ATR) to dynamically place Stop Losses based on current market volatility and automatically calculates the exact position size needed to respect your risk percentage.
Key Features:
Dynamic Risk Management: Stop Loss and Take Profit levels adjust automatically based on market volatility (ATR).
Auto-Position Sizing: Calculates the exact Quantity (in coins) and Position Value (in $) to ensure you never risk more than your defined percentage (e.g., 1% or 2%).
Leverage Calculator: Instantly sees the "Required Leverage" needed to execute the trade size relative to your account balance.
Crypto Precision: Displays up to 8 decimal places, making it compatible with both Bitcoin and low-sat altcoins.
Toggable Direction: Switch between Long and Short biases instantly via the settings menu.
How to Use:
Add the indicator to your chart.
Open Settings and input your Account Balance and Risk %.
Choose your direction (Long or Short) using the checkboxes.
The label will display your Entry, SL, TP, Coin Quantity, and Required Leverage in real-time.

Impulse %Impulse % — Liquidation Cascade Detector (BTC · 1H)
Impulse % identifies sharp impulsive price moves and liquidation cascades by measuring how much a candle’s range deviates from its historical average in percent.
How it works
Calculates the candle range (in %) relative to price and compares it to the average over N periods.
When the range exceeds the upper band, an Impulse is detected.
Inside each 1H candle, the indicator checks lower timeframes (1m / 5m) to classify the impulse phases:
PANIC — the first minutes of a violent move (forced liquidations, stop hunts).
CAUTION (Cascade) — continuation and “cleanup” phase with elevated risk.
Determines whether the impulse is against the trend using EMA 50 / EMA 200 — the most dangerous scenario.
Highlights risk zones to protect positions and filter new entries.
What it’s for
Avoid entering during liquidation cascades.
Exit at break-even or partially take profit during risky phases.
Recommended Settings — BTC (1H)
Calculation
Calculation TF: (empty = current)
Average Mode: By N bars
N (bars): 100
Range Type: High–Low
Bands
Upper Band (% of average): 130
Lower Band: Auto (same %)
Cascade (First Minutes)
Enable Cascade Filter: ON
When to trigger safety: Only against trend
PANIC (minutes): 3
CAUTION (minutes after PANIC): 15
Trend (EMA)
Use EMA Trend: ON
Fast EMA: 50
Slow EMA: 200
Lower TF Detection
Lower TF: 1m (or 5m if you prefer smoother signals)
Visualization
Style: Columns
Show Bands: ON
Show Band Lines & Mean: ON
How to read it (BTC · 1H)
Purple (PANIC): first minutes of liquidation — do not enter.
Yellow (CAUTION): cascade phase — high risk, manage/exit.
Normal color: no active cascade — strategy allowed.
Best practice:
1m/5m → real-time cascade detection
1H → decision level
4H → market context

Neosha Concept V4 (NY Time)
Imagine the financial market as a huge ocean. Millions of traders throw orders into it every second. But beneath all the noise, there is a powerful current that quietly controls where the waves move. That current is not a person, not a trader, and not random—it is an algorithm.
This algorithm is called the Interbank Price Delivery Algorithm (IPDA).
Think of it as the “navigation system” that guides price through the market.
IPDA has one job:
to move prices in a way that keeps the market efficient and liquid.
To do this, it constantly looks for two things:
1. Where liquidity is hiding
Liquidity is usually found above highs and below lows—where traders place stop losses. The algorithm moves price there first to collect that liquidity.
2. Where price became unbalanced
Sometimes price moves too fast and creates gaps or imbalances. IPDA returns to those areas later to “fix” the missing orders.
Once you start looking at the charts with this idea in mind, everything makes more sense:
Why price suddenly spikes above a high and crashes down
Why big moves leave gaps that price later fills
Why the market reverses right after taking stops
Why trends begin only after certain levels are hit
These are not accidents.
They are the algorithm doing its job.
Price moves in a repeating cycle:
Gather liquidity
Make a strong move (displacement)
Return to fix inefficiency
Deliver to the next target
Most beginners only see the candles.
But once you understand IPDA, you see the intention behind the candles.
Instead of guessing where price might go, you begin to understand why it moves there.
And once you understand the “why,” your trading becomes clearer, calmer, and far more accurate.


MTF Alignment & Key Levelsso this one is specifically for the 1hr and 4hr time frame. but what it does is alert you once the monthly weekly and daily timeframes align with a trend in a certain direction wether its bearish or bullish but then it will mark out key levels on the 1hr and 4hr time frame to indicate when price breaks through that level to enter a trade in the direction of the higher timeframes alignment.


Ashok 07 Dec 25 updated scriptTried to fix the bugs in previous script. Even now improvements are needed, but for now it looks reasonably profiting.


Obsidian Flux Matrix# Obsidian Flux Matrix | JackOfAllTrades
Made with my Senior Level AI Pine Script v6 coding bot for the community!
Narrative Overview
Obsidian Flux Matrix (OFM) is an open-source Pine Script v6 study that fuses social sentiment, higher timeframe trend bias, fair-value-gap detection, liquidity raids, VWAP gravitation, session profiling, and a diagnostic HUD. The layout keeps the obsidian palette so critical overlays stay readable without overwhelming a price chart.
Purpose & Scope
OFM focuses on actionable structure rather than marketing claims. It documents every driver that powers its confluence engine so reviewers understand what triggers each visual.
Core Analytical Pillars
1. Social Pulse Engine
Sentiment Webhook Feed: Accepts normalized scores (-1 to +1). Signals only arm when the EMA-smoothed value exceeds the `sentimentMin` input (0.35 by default).
Volume Confirmation: Requires local volume > 30-bar average × `volSpikeMult` (default 2.0) before sentiment flags.
EMA Cross Validation: Fast EMA 8 crossing above/below slow EMA 21 keeps momentum aligned with flow.
Momentum Alignment: Multi-timeframe momentum composite must agree (positive for longs, negative for shorts).
2. Peer Momentum Heatmap
Multi-Timeframe Blend: RSI + Stoch RSI fetched via request.security() on 1H/4H/1D by default.
Composite Scoring: Each timeframe votes +1/-1/0; totals are clamped between -3 and +3.
Intraday Readability: Configurable band thickness (1-5) so scalpers see context without losing space.
Dynamic Opacity: Stronger agreement boosts column opacity for quick bias checks.
3. Trend & Displacement Framework
Dual EMA Ribbon: Cyan/magenta ribbon highlights immediate posture.
HTF Bias: A higher-timeframe EMA (default 55 on 4H) sets macro direction.
Displacement Score: Body-to-ATR ratio (>1.4 default) detects impulses that seed FVGs or VWAP raids.
ATR Normalization: All thresholds float with volatility so the study adapts to assets and regimes.
4. Intelligent Fair Value Gap (FVG) System
Gap Detection: Three-candle logic (bullish: low > high ; bearish: high < low ) with ATR-sized minimums (0.15 × ATR default).
Overlap Prevention: Price-range checks stop redundant boxes.
Spacing Control: `fvgMinSpacing` (default 5) avoids stacking from the same impulse.
Storage Caps: Max three FVGs per side unless the user widens the limit.
Session Awareness: Kill zone filters keep taps focused on London/NY if desired.
Auto Cleanup: Boxes delete when price closes beyond their invalidation level.
5. VWAP Magnet + Liquidity Raid Engine
Session or Rolling VWAP: Toggle resets to match intraday or rolling preferences.
Equal High/Low Scanner: Looks back 20 bars by default for liquidity pools.
Displacement Filter: ATR multiplier ensures raids represent genuine liquidity sweeps.
Mean Reversion Focus: Signals fire when price displaces back toward VWAP following a raid.
6. Session Range Breakout System
Initial Balance Tracking: First N bars (15 default) define the session box.
Breakout Logic: Requires simultaneous liquidity spikes, nearby FVG activity, and supportive momentum.
Z-Score Volume Filter: >1.5σ by default to filter noisy moves.
7. Lifestyle Liquidity Scanner
Volume Z-Scores: 50-bar baseline highlights statistically significant spikes.
Smart Money Footprints: Bottom-of-chart squares color-code buy vs sell participation.
Panel Memory: HUD logs the last five raid timestamps, direction, and normalized size.
8. Risk Matrix & Diagnostic HUD
HUD Structure: Table in the top-right summarizes HTF bias, sentiment, momentum, range state, liquidity memory, and current risk references.
Signal Tags: Aggregates SPS, FVG, VWAP, Range, and Liquidity states into a compact string.
Risk Metrics: Swing-based stops (5-bar lookback) + ATR targets (1.5× default) keep risk transparent.
Signal Families & Alerts
Social Pulse (SPS): Volume-confirmed sentiment alignment; triangle markers with “SPS”.
Kill-Zone FVG: Session + HTF alignment + FVG tap; arrow markers plus SL/TP labels.
Local FVG: Captures local reversals when HTF bias has not flipped yet.
VWAP Raid: Equal-high/low raids that snap toward VWAP; “VWAP” label markers.
Range Breakout: Initial balance violations with liquidity and imbalance confirmation; circle markers.
Liquidity Spike: Z-score spikes ≥ threshold; square markers along the baseline.
Visual Design & Customization
Theme Palette: Primary background RGB (12,6,24). Accent shading RGB (26,10,48). Long accents RGB (88,174,255). Short accents RGB (219,109,255).
Stylized Candles: Optional overlay using theme colors.
Signal Toggles: Independently enable markers, heatmap, and diagnostics.
Label Spacing: Auto-spacing enforces ≥4-bar gaps to prevent text overlap.
Customization & Workflow Notes
Adjust ATR/FVG thresholds when volatility shifts.
Re-anchor sentiment to your webhook cadence; EMA smoothing (default 5) dampens noise.
Reposition the HUD by editing the `table.new` coordinates.
Use multiples of the chart timeframe for HTF requests to minimize load.
Session inputs accept exchange-local time; align them to your market.
Performance & Compliance
Pure Pine v6: Single-line statements, no `lookahead_on`.
Resource Safe: Arrays trimmed, boxes limited, `request.security` cached.
Repaint Awareness: Signals confirm on close; alerts mirror on-chart logic.
Runtime Safety: Arrays/loops guard against `na`.
Use Cases
Measure when social sentiment aligns with structure.
Plan ICT-style intraday rebalances around session-specific FVG taps.
Fade VWAP raids when displacement shows exhaustion.
Watch initial balance breaks backed by statistical volume.
Keep risk/target references anchored in ATR logic.
Signal Logic Snapshot
Social Pulse Long/Short: `sentimentEMA` gated by `sentimentMin`, `volSpike`, EMA 8/21 cross, and `momoComposite` sign agreement. Keeps hype tied to structural follow-through.
Kill-Zone FVG Long/Short: Requires session filter, HTF EMA bias alignment, and an active FVG tap (`bullFvgTap` / `bearFvgTap`). Labels include swing stops + ATR targets pulled from `swingLookback` and `liqTargetMultiple`.
Local FVG Long/Short: Uses `localBullish` / `localBearish` heuristics (EMA slope, displacement, sequential closes) to surface intraday reversals even when HTF bias has not flipped.
VWAP Raids: Detect equal-high/equal-low sweeps (`raidHigh`, `raidLow`) that revert toward `sessionVwap` or rolling VWAP when displacement exceeds `vwapAlertDisplace`.
Range Breakouts: Combine `rangeComplete`, breakout confirmation, liquidity spikes, and nearby FVG activity for statistically backed initial balance breaks.
Liquidity Spikes: Volume Z-score > `zScoreThreshold` logs direction, size, and timestamp for the HUD and optional review workflows.
Session Logic & VWAP Handling
Kill zone + NY session inputs use TradingView’s session strings; `f_inSession()` drives both visual shading and whether FVG taps are tradeable when `killZoneOnly` is true.
Session VWAP resets using cumulative price × volume sums that restart when the daily timestamp changes; rolling VWAP falls back to `ta.vwap(hlc3)` for instruments where daily resets are less relevant.
Initial balance box (`rangeBars` input) locks once complete, extends forward, and stays on chart to contextualize later liquidity raids or breakouts.
Parameter Reference
Trend: `emaFastLen`, `emaSlowLen`, `htfResolution`, `htfEmaLen`, `showEmaRibbon`, `showHtfBiasLine`.
Momentum: `tf1`, `tf2`, `tf3`, `rsiLen`, `stochLen`, `stochSmooth`, `heatmapHeight`.
Volume/Liquidity: `volLookback`, `volSpikeMult`, `zScoreLen`, `zScoreThreshold`, `equalLookback`.
VWAP & Sessions: `vwapMode`, `showVwapLine`, `vwapAlertDisplace`, `killSession`, `nySession`, `showSessionShade`, `rangeBars`.
FVG/Risk: `fvgMinTicks`, `fvgLookback`, `fvgMinSpacing`, `killZoneOnly`, `liqTargetMultiple`, `swingLookback`.
Visualization Toggles: `showSignalMarkers`, `showHeatmapBand`, `showInfoPanel`, `showStylizedCandles`.
Workflow Recipes
Kill-Zone Continuation: During the defined kill session, look for `killFvgLong` or `killFvgShort` arrows that line up with `sentimentValid` and positive `momoComposite`. Use the HUD’s risk readout to confirm SL/TP distances before entering.
VWAP Raid Fade: Outside kill zone, track `raidToVwapLong/Short`. Confirm the candle body exceeds the displacement multiplier, and price crosses back toward VWAP before considering reversions.
Range Break Monitor: After the initial balance locks, mark `rangeBreakLong/Short` circles only when the momentum band is >0 or <0 respectively and a fresh FVG box sits near price.
Liquidity Spike Review: When the HUD shows “Liquidity” timestamps, hover the plotted squares at chart bottom to see whether spikes were buy/sell oriented and if local FVGs formed immediately after.
Metadata
Author: officialjackofalltrades
Platform: TradingView (Pine Script v6)
Category: Sentiment + Liquidity Intelligence
Hope you Enjoy!
