Blue Ocean BOATS 24/5 US Market DataThis script utilizes Blue Ocean's ATS (Alternative Trading System) and U.S. exchange market data to create a continuous candlestick chart. The continuous data has the option to be used as an indicator or strategy source.
Requirements
The main chart symbol (which can be unrelated to the user-input Ticker Symbol) needs to be a 24/7 chart. An example symbol is CRYPTO:BTCUSD. CME_MINI:ES1! and FX:SPX500 work too, but are not truly 24/5 and will miss ~4 hours of the total trading week from the extended U.S. session.
The main chart's timeframe needs to be intraday. Because the script's output is currently inconsistent on daily or higher timeframes, it will disable itself.
The Ticker Symbol chosen should be a ticker that is traded on U.S. exchanges. This will provide both U.S. extended session data and a BOATS equivalent.
Usage & configuration
This script visualizes the 24-hour Monday-Friday chart of a U.S. exchange ticker. Going a step further, it can be used to compare the performance indices or cryptocurrencies to stock constituents of indices, cryptocurrency treasury stocks or holding ETFs.
The script's output, candlesticks, can be overlaid on the main chart or used as is. A "Price Source" plot is used for indicators or strategies.
Ticker Symbol: The U.S. ticker you'd like to view extended session and Blue Ocean ATS session data for.
Price Source: Price source that can be used for indicators or strategies.
Highlight Sessions: Highlight the different trading sessions.
Last Price Line: Show a horizontal line at the last traded price.
Ticker Symbol Check: Plots a label that will display only if the selected Ticker Symbol is not detected as a U.S. exchange traded ticker.
Earnings Label: Creates a label at the time of past earnings of the chosen Ticker Symbol. The time that the earnings are plotted is approximate. Because of this, the label is meant as an explanation for price action.
What this script does and how it works
It creates OHLC candlesticks by merging Blue Ocean's ATS market data and U.S. exchange data. From the OHLC data of both, a single output can be used for indicators or strategies.
References and further information
www.tradingview.com
The Blue Ocean ATS allows trading from 20:00 to 4:00 Eastern Time, Sunday through Thursday. This critical timeframe bridges the eight-hour overnight gap when major U.S. exchanges are closed.
blueocean-tech.io
Blue Ocean ATS, LLC is a US broker dealer which operates the alternative trading system BOATS. Our trading platform offers electronic access, price discovery, compliant regulatory reporting requirements, and standard clearing and settlement processes.
www.nyse.com
Hours mentioned are in Eastern Time.
Overnight trading remains far less active than extended hours trading. The hour with the highest overnight volume is 9:00PM, which averages 2.94 million shares per day and coincides with several Asian market opens. This volume is a fraction of the last hour of extended hours trading, which averages 43.22 million shares. The first hour of pre-core reported volume averages 113.30 million shares per day.
Overnight executions, in addition to the peak in the 9:00PM hour, also exhibits a smaller peak at 3:00AM, of 2.35 million shares. This coincides with several Asian bourses’ end of their regular trading day.
Example of using the script in the main chart window and the difference in how RSI may be calculated.
Note: ATS is not the name of the 20:00 to 4:00 ET session itself, and the term refers to a broader definition of trading systems that include dark pools, which can be different.
24/5 Monday-Friday really means NY time Sunday night to Friday afternoon.
Continuous

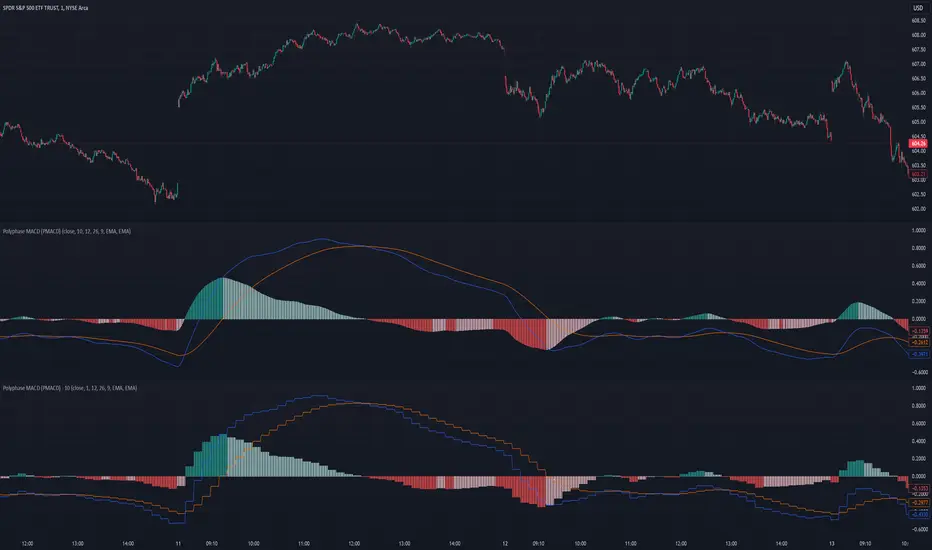
Polyphase MACD (PMACD)The Polyphase MACD (PMACD) uses polyphase decimation to create a continuous estimate of higher timeframe MACD behavior. The number of phases represents the timeframe multiplier - for example, 3 phases approximates a 3x higher timeframe.
Traditional higher timeframe MACD indicators update only when each higher timeframe bar completes, creating stepped signals that can miss intermediate price action. The PMACD addresses this by maintaining multiple phase-shifted MACD calculations and combining them with appropriate anti-aliasing filters. This approach eliminates the discrete jumps typically seen in higher timeframe indicators, though the resulting signal may sometimes deviate from the true higher timeframe values due to its estimative nature.
The indicator processes price data through parallel phase calculations, each analyzing a different time-offset subset of the data. These phases are filtered and combined to prevent aliasing artifacts that occur in simple timeframe conversions. The result is a smooth, continuous signal that begins providing meaningful values immediately, without requiring a warm-up period of higher timeframe bars.
The PMACD maintains the standard MACD components - the MACD line (fast MA - slow MA), signal line, and histogram - while providing a more continuous view of higher timeframe momentum. Users can select between EMA and SMA calculations for both the oscillator and signal components, with all calculations benefiting from the same polyphase processing technique.
Polyphase Stochastic RSI (PSRSI)The Polyphase Stochastic RSI (PSRSI) provides a continuous estimate of higher timeframe Stochastic RSI behavior by using polyphase decimation. The number of phases represents the timeframe multiplier - for example, 3 phases approximates a 3x higher timeframe.
While traditional higher timeframe indicators only update at the completion of each higher timeframe bar, the PSRSI creates a continuous signal by maintaining multiple phase-shifted calculations and combining them with appropriate anti-aliasing filters. This approach eliminates the gaps and discontinuities typically seen in higher timeframe indicators, though the resulting signal may sometimes deviate from the true higher timeframe values due to its estimative nature.
The indicator processes data through parallel phase calculations, each handling a different subset of price data offset in time. These phases are then filtered and combined to prevent aliasing artifacts that occur in simple timeframe conversions. The result is a smooth, continuous signal that starts providing meaningful values immediately, without requiring a warm-up period of higher timeframe bars.
Users can choose between RSI and Stochastic RSI modes, with both benefiting from the same polyphase processing technique. The indicator maintains the standard interpretation of overbought and oversold conditions while providing a more continuous view of higher timeframe momentum.

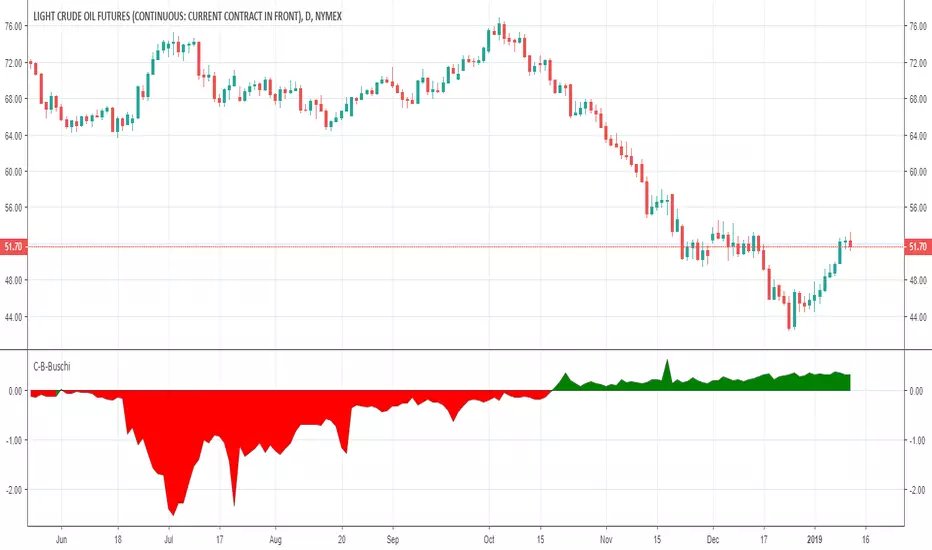
Contango-Backwardation-Buschi
English:
This script shows the difference between a future's continuous current contract (e. g. CL1!) and the continuous next contract (e. g. CL2!). Normally, the next contract is more expensive ("Contango" - shown in green). If the next contract is cheaper, the difference is negative ("Backwardation" - shown in red).
A change between Contango and Backwardation often corresponds with stronger price changes.
Deutsch:
Dieses Skript zeigt den Unterschied zwischen dem kontinuierlichen aktuellem Kontrakt eines Futures (z. B. CL1!) und dem kontinuierlichen Folgekontrakt (z. B. CL2!). Im Normalfall ist der Folgekontrakt teurer ("Contango" - angezeigt in grün). Wenn der Folgekontrakt billiger ist, ist die Differenz negativ ("Backwardation" - angezeigt in rot).
Ein Wechsel zwischen Contango und Backwardation korrespondiert häufig mit größeren Preisänderungen.