Filtered TEMA CrossoverFiltered Dual TEMA Crossover
This indicator is a trend-following tool based on the classic Dual Triple Exponential Moving Average (TEMA) Crossover strategy, enhanced with two robust filters: the Chop Index and the Average Directional Index (ADX).
The TEMA is known for its low lag and high responsiveness, making the crossover an effective signal for trend reversals. However, trading TEMA crossovers during sideways, choppy markets often leads to false signals. This is where the filters come in.
Key Features
▪️Dual TEMA Crossover: Plots two customizable TEMA lines (Fast and Slow) for clear visualization of the primary trend direction.
▪️Intelligent Signal Filtering: Buy and Sell signals are generated only when the market confirms it is in a trending state, thanks to two integrated filters:
➖Chop Index Filter: Blocks signals when the market is detected as sideways or consolidating (Chop Index reading above a user-defined threshold).
➖ADX Filter: Ensures signals are only taken when the trend strength is sufficient (ADX reading above a user-defined minimum threshold).
▪️Customizable Signals: Full control over the signal shapes (Arrows, Triangles, etc.), colors, text, and size.
How to Use It
Use the Filtered Dual TEMA Crossover to enter positions on trend continuation or reversal while dramatically reducing exposure to low-quality, whipsawing signals common in non-trending environments.
Before the filters:
After the filters:
Minimize Noise. Maximize Clarity. Trade the Trend.
Crossover

EMA Cross with SLEMA Cross with adjustable SL.
Created for M5 timeframe chart.
Best combine with MACD.

Shezab AlgoLabs EMA Trend UtilityOverview
This tool is a clean and practical EMA trend utility built to help traders quickly understand market direction, trend regime, and momentum shifts. It plots a fast EMA and slow EMA using a branded color theme and highlights transitions between bullish and bearish conditions. The script also includes optional visual crossover markers to make regime changes easier to spot.
How it works
The relationship between the fast and slow EMA is used to classify the trend environment:
When the fast EMA is above the slow EMA, the market is considered in a bullish phase.
When the fast EMA is below the slow EMA, the market is considered in a bearish phase.
The script also provides optional:
Colored bars reflecting trend direction
Crossover labels to highlight momentum shifts
Background cloud to visually emphasize trending or neutral conditions
Optional alerts for crossover events
These visual features help traders recognize potential trend transitions without implying a complete trading system.
How to use it
This tool is designed as a supplemental decision aid. Traders can combine it with their preferred structure analysis, volume tools, oscillators, or confirmation methods. The crossover markers and alerts highlight shifts in trend behavior but are informational rather than mechanical buy/sell signals. Users should apply their own risk-management and entry criteria.
Originality
This script goes beyond a standard EMA by combining multiple elements into a single, cohesive trend-clarification tool:
• regime coloring
• optional cloud regions
• crossover markers
• visual dynamic styling using a unified aesthetic palette
It is not a mashup of existing scripts; all components are integrated specifically to support traders who prefer a simple-yet-clear visual framework for understanding trend behavior.

Trend Cross Filter by Pooja⭐ Trend Cross Filter by Pooja
Trend Cross Filter by Pooja is a clean and efficient crossover-based entry tool designed to help traders identify momentum shifts with clarity. This indicator combines a fast RSI and a smoothed RSI-MA baseline with optional trend and volatility filters, allowing users to focus on higher-quality crossover signals.
The goal of this tool is to offer structured, easy-to-read entries without clutter or complexity. All signals appear directly on the chart using markers, making it suitable for intraday and short-term decision-making.
⭐ Key Features
🔶 1. RSI–MA Crossover Signals
Generates BUY/SELL signals when RSI crosses above or below its moving average.
Clean visual markers help highlight potential momentum changes.
🔶 2. Trend Strength Filter (Optional)
Uses a custom ADX calculation to allow signals only when trend strength meets the selected threshold.
🔶 3. Volatility Filter (ATR-Based)
An optional ATR/Price filter helps avoid signals during extremely low-volatility or flat periods.
🔶 4. RSI-MA Slope Filter
Allows users to accept only those signals where the slope of the RSI-MA indicates meaningful directional strength.
🔶 5. Minimum Bars Between Signals
Prevents back-to-back signals in noisy or sideways conditions.
🔶 6. Chart-Based Visual Signals
Signals appear directly on the price chart:
BUY markers for upward crossover
SELL markers for downward crossover
Users can choose between triangle or label-style signals.
🔶 7. Alert + Webhook Compatible
Built-in alert conditions for BUY and SELL signals.
Users can connect alerts to webhooks or automation tools if they wish.
🔶 8. Flexible Customization
All filters, thresholds, colors, and label styles can be adjusted easily based on personal preference.
⭐ How to Use
Add the indicator to your chart.
Choose your preferred signal style (Label / Triangle).
Enable or disable the ADX, ATR, or slope filters as needed.
Create TradingView alerts using the built-in BUY and SELL alert conditions if automation or notifications are required.
Combine signals with your own risk management and market analysis.
⭐ Notes
Works across multiple timeframes and different instruments.
Filtering options help reduce noise, but users should test settings based on their trading approach.
⚠️ Disclaimer
This indicator is a technical analysis tool created for educational and chart-analysis purposes.
It does not provide financial advice, does not guarantee profits, and should not be used as the sole basis for trading decisions.
Market conditions vary, and users are fully responsible for their own trades, risk management, and results.
Always test any tool or strategy on historical data or a demo environment before using in live markets.

9/21 EMA Trend TOP rIGHT CORNER INDICATORCrossover indicator for the 9 & 21 EMA. Buy Sell for cross up or down respectively. Daily, weekly and Monthly trend.

VWAP TrendSignalVWAP TrendSignal
VWAP (Volume-Weighted Average Price) is the market’s true fair value — the benchmark institutions use to see when price is balanced, extended, or trending with real intent.
Price often snaps back when it moves too far (mean reversion), and only shows genuine strength when it holds above or below VWAP.
VWAP TrendSignal makes this insight effortless by color-coding VWAP direction:
Yellow = VWAP rising → bullish pressure
Red = VWAP falling → bearish pressure
No bands. No noise. Just pure directional clarity.
Anchor VWAP to the Session, Week, Month, Quarter, or Year, and tailor the Slope Smoothing Filter to your timeframe:
1–2 smoothing → fast & reactive (1–5m scalping)
3–5 smoothing → clean & stable (5–15m intraday)
6–10 smoothing → slow flips (1H–4H swings)
10–15 smoothing → macro bias only (Daily/Weekly)
The line adapts to how you trade.
How to Use It
Mean Reversion
When price stretches far from VWAP, expect pullbacks or snapbacks.
Trend Direction
Yellow supports long bias, red supports short bias.
Simple, reliable, instantly visible.
Balance Zones
Price sitting near VWAP = compression, buildup, or chop.
A perfect signal to wait or prepare for a breakout.
Why It Works
VWAP TrendSignal distills institutional logic into a clean, single-line tool.
It shows fair value, trend slope, and balance all at once — making your chart clearer and your decisions faster.
Once you get used to reading it, trading without it feels blind.

Trend Pulse Algo (LTM)Trend Pulse Algo LTM Indicator Description
Overview
Trend Pulse Algo LTM is an advanced multi layer technical indicator designed for TradingView that combines moving average MA crossovers confirmation signals pivot based structure analysis imbalance zone detection and overextension warnings to identify potential trend shifts continuations and reversal points. It aims to provide traders with reliable entry and exit signals in trending markets while highlighting areas of market inefficiency imbalances and overextended price moves that could signal exhaustion.
This indicator operates on a pulse concept where it detects rhythmic shifts in market momentum through layered MAs a quick MA for short term sensitivity a mid MA for intermediate confirmation and a long MA as a baseline trend filter. Signals are generated based on alignments and crosses between these MAs but with added layers of confirmation to reduce false positives such as requiring consecutive bars above below the long MA and breaks of prior pivot highs lows. It incorporates higher timeframe HTF analysis for imbalance zones to capture broader market context making it suitable for swing trading trend following or scalping on lower timeframes when combined with the overextension detector.
Unlike simple MA crossover systems for example standard dual EMA strategies this algo uses adaptive MA types based on timeframe pivot deviation for structural breaks and a tally based confirmation to filter noise. Imbalance zones identify fair value gaps or inefficiencies between candle bodies and wicks where price may retrace to fill. Overextension is calculated relative to the mid MA using a rolling mean absolute deviation MAD ratio highlighting potential tops bottoms in strong trends. The result is a visually clean or detailed based on mode overlay that colors bars backgrounds plots labels for signals and pivots and draws zones to guide decision making.
How It Works
MA Layers and Signal Generation
Three MAs quick mid long are computed using either SMA or EMA selected dynamically based on the charts timeframe for optimal responsiveness for example EMA on lower TFs for faster signals.
Early Signals A crossover of the quick MA above the mid MA while above the long MA triggers a Possible Bull label indicating early momentum shifts. A crossunder below triggers Possible Bear.
Confirmed Signals Bullish confirmation requires a set number of bars closing above the long MA plus alignment quick greater than mid and a break above the prior pivot high. Bearish requires bars below the long MA and a break below the prior pivot low. This uses a counter mechanism to ensure persistence reducing whipsaws. Breaks are detected via crossovers under of close versus prior highs lows.
State persistence tracks the current regime bull bear warn early coloring the chart accordingly until a new signal overrides it.
Pivot Detection and Structure
Pivots are identified by scanning for highs lows separated by a minimum bar depth with a percentage deviation threshold to confirm validity. This follows a zigzag like approach but with deviation filtering for robustness.
Labels like HH Higher High HL Higher Low LH Lower High LL Lower Low highlight market structure helping identify trends for example HH HL for uptrends or breakdowns. These are used internally to validate signal breaks.
Imbalance Zones
Zones detect imbalances or gaps between candle bodies and prior highs lows where unfilled inefficiencies attract price.
For bullish zones If open greater than close and high minus low two less than zero a zone is drawn from calculated top bottom limits. Bearish similarly for close greater than open.
Supports current TF HTF or both. Zones extend rightward until filled price touches the opposite side or mid line if enabled then either delete or shorten based on settings. Mid lines can act as fill triggers for partial closures.
HTF data is fetched via security for broader context resetting on new HTF bars.
Overextension Indicator
Measures price deviation from the mid MA relative to a rolling average RMA of relative deviations over a length.
Multipliers define tiers mild for example two times avg deviation moderate three times extreme four times. Circles plot above below bars in bull bear states when thresholds are exceeded signaling potential reversals for example red for extreme tops in uptrends. This is akin to a Bollinger Band squeeze expansion but normalized to MA distance for trend specific warnings.
Chart Coloring and Visuals
Background or candle coloring reflects the state green for bull red for bear orange for warn blue for early.
Modes control clutter Clean hides MAs zones pivots Balanced shows essentials Detailed includes all.
How to Use It
Setup Add to your chart via TradingViews indicator search. Adjust inputs based on asset timeframe for example shorter MA periods for volatile cryptos longer for stocks.
Trading Strategy Ideas
Trend Following Enter long on Confirmed Bull labels exit on Confirmed Bear or extreme overextension circles. Use imbalance zones as support resistance for stops targets for example buy dips to unfilled bullish zones.
Reversal Scalping Watch for Possible Bull Bear near pivot labels for example HL LL and overextension in the opposite direction. Confirm with zone fills.
Multi TF Analysis Set HTF to D for daily context on hourly charts zones from HTF often act as magnets.
Risk Management Place stops below prior lows in bulls or above highs in bears. Target zone edges or MA crosses. Avoid trading against strong states without confirmation.
Alerts Set up via TradingView for Early Up Down or Up Down Confirm to notify on signal edges.
Limitations Best in trending markets may lag in ranges. Test on historical data no indicator is foolproof combine with volume price action.
Detailed Input Settings
Below is a comprehensive breakdown of all user adjustable inputs from the settings panel grouped as in the script. Each explains what it controls its effect on the indicators logic and usage tips. Defaults are provided for reference.
Chart Mode
Chart Mode default Detailed Mode options Clean Mode Balanced Mode Detailed Mode
Controls visual detail level. Clean Mode hides MAs imbalance zones and pivots for a minimal overlay focused on signals and coloring. Balanced Mode shows MAs and signals but omits zones pivots. Detailed Mode displays everything for in depth analysis. Use Clean for live trading to reduce clutter Detailed for backtesting structure review.
Display Settings
Color Style default Candles options Background Candles
Determines how states bull bear warn early are visualized. Background colors the chart area for example green shading for bull. Candles colors bar bodies wicks directly. Background is subtler for multi indicator setups Candles emphasizes signals on naked charts.
Imbalance Zone HTF Config
Higher TF Period default D
Sets the higher timeframe for imbalance detection for example D for daily four H for four hour. This fetches broader data to identify significant zones. Use a TF four to five times your current for context for example daily on one H charts avoid very high TFs like W on intraday for relevance.
TF Mode default Current TF options Current TF Current plus HTF HTF Only
Defines timeframe handling for zones. Current TF uses only your charts TF. Current plus HTF combines both for layered zones. HTF Only ignores current TF. Current plus HTF is ideal for multi TF confluence HTF Only simplifies for swing traders.
Shift default ten min zero max five hundred
Horizontal offset in bars for current TF zone labels. Higher values shift labels rightward to avoid overlap. Adjust if labels crowd the chart.
HTF Shift default twenty min zero max five hundred
Similar to Shift but for HTF zone labels. Use larger offsets for HTF to distinguish them visually.
Imbalance Zone Core Options
Mid Line Fill default false
Enables a midpoint line in each zone zones fill close short when price touches this mid line instead of the far edge. Activates partial fill logic for more conservative zone closure. Enable for tighter risk in volatile markets.
Remove Filled Zones default true
If true completely deletes filled zones if false shortens them to the fill point keeping history. True clears clutter false retains context for review.
Display TF on Zone default false
Shows the timeframe for example D IZ on zone labels. Useful for distinguishing current versus HTF zones in combined mode.
Max Upward Zones default twenty min one max fifty
Limits displayed bullish upward zones removes oldest when exceeded. Lower for cleaner charts higher for historical depth.
Max Downward Zones default twenty min one max fifty
Same as above but for bearish downward zones.
Imbalance Zone Visuals
Upward Zone color green at ninety percent transparency
Color for current TF upward imbalance zones. Adjust opacity for visibility.
HTF Upward Zone color lime at eighty percent transparency
Color for higher timeframe upward imbalance zones. Differentiate from current for example lighter shade.
Downward Zone color red at ninety percent transparency
Color for current TF downward imbalance zones.
HTF Downward Zone color maroon at eighty percent transparency
Color for higher timeframe downward imbalance zones.
Mid Line Color color white at eighty five percent transparency
Color for the optional midpoint line in zones.
Text Color color white
Color for text labels on zones.
MA Layers
Quick MA Period default ten min one
Length for the fastest moving average sensitive to short term price. Shorter for example five for scalping longer for example fifteen for less noise.
Mid MA Period default twenty min one
Intermediate MA length used for crossovers and overextension base. Typically two times quick for balance.
Long MA Period default fifty min one
Baseline trend filter length. Longer for example one hundred for major trends shorter for active trading.
MA Variants by Period
Under one H default EMA options SMA EMA
MA type for timeframes under one hour for example EMA for faster response.
One H to less than five H default EMA options SMA EMA
MA type for one to five hour timeframes.
Five H to less than one D default EMA options SMA EMA
MA type for five hour to one day timeframes.
One D plus default EMA options SMA EMA
MA type for daily and higher timeframes. Adapt to market EMA for trends SMA for mean reversion.
Signal Confirmation
Bull Confirm Bars default one min zero
Consecutive bars needed above long MA for bull confirmation. Zero for instant higher for example three filters noise but delays entries.
Bear Confirm Bars default two min zero
Same for bear below long MA. Asymmetrical default higher for bears assumes uptrend bias.
Pivot Detection
Pivot Depth default six min one
Min bars between pivots. Higher reduces minor swings lower captures more structure.
Pivot Deviation percent default one point zero min zero point one
Percent change required for new pivot. Higher ignores small moves for example two percent for stocks zero point five percent for forex.
Display HH and HL default true
Shows labels for Higher Highs Lows bullish structure.
Display LH and LL default true
Shows labels for Lower Highs Lows bearish structure.
Overextension Indicator
Show Overextension Circles Potential Tops default true
Enables circles above bars in bull states for potential tops.
Show Overextension Circles Potential Bottoms default true
Enables below bars in bear states for bottoms.
Overextension Length default fourteen min one
Period for rolling relative deviation average. Matches RSI STOCH defaults for alignment.
Mild Multiplier default two point zero min zero point zero
Threshold for mild overextension yellow circle. Zero disables tier.
Moderate Multiplier default three point zero min zero point zero
For moderate orange.
Extreme Multiplier default four point zero min zero point zero
For extreme red. Tune lower for sensitive warnings in ranging markets.

Dashboard Trader _V1
📊 Dashboard Trader – Adaptive Structure, Trend & Zones
Description:
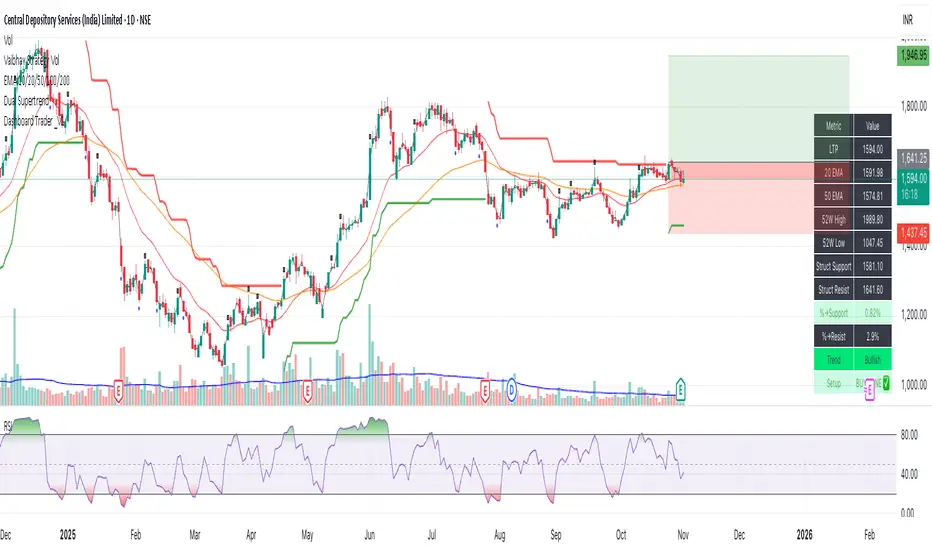
NSE Dashboard V3 is a next-gen support–resistance and trend-mapping indicator designed for positional and swing traders. It combines price structure, moving averages, and adaptive pivot logic to highlight Buy Zones, Take-Profit Zones, and overall market direction — all inside a clean, compact dashboard.
⸻
🧩 What It Does
• Auto-detects structural support & resistance zones using adaptive pivot clustering logic.
• Tracks broken levels dynamically — old supports removed, new ones added.
• Identifies trend bias using dual EMAs (20-EMA & 50-EMA).
• Displays a live dashboard table showing:
• LTP (Last Traded Price)
• 20 EMA / 50 EMA
• 52-week High & Low (true daily data)
• Structural Support & Resistance
• % Distance to each zone
• Trend direction
• Trade Setup Zone → BUY ✅ / TAKE PROFIT ⚠ / NEUTRAL
⸻
🧠 How to Trade It
1. Check the trend:
• 20 EMA > 50 EMA → Bullish bias (look for long entries).
• 20 EMA < 50 EMA → Bearish bias (look for short or avoid longs).
2. Enter near support:
• When price is ≤ 2% above Struct Support and trend is bullish → BUY ZONE ✅
3. Exit or reduce near resistance:
• When price is ≤ 2% below Struct Resistance → TAKE PROFIT ⚠
4. If no valid resistance (at ATH):
• Trail stop below 20 EMA or last swing low.
⸻
⚙️ Key Features
• EMA-based trend detection
• Dynamic structural zone calculation (auto-updates)
• Daily timeframe 52-week High/Low
• Auto color-coded zones and table
• Works on all NSE stocks, futures, or indices
• Optional refresh every new bar
• Lightweight – optimized for live chart use
⸻
📈 Best Used For
• Swing trading / Positional setups (Daily or 4-hour charts)
• Intraday confirmation on lower timeframes (15-min+)
• Trend continuation entries and risk-defined reversals
⸻
⚠️ Disclaimer
This indicator is for educational purposes only.
It does not constitute financial advice or a buy/sell recommendation.
Always combine with your own price action, volume, and risk management.
⸻
💬 Author’s Note
Built for traders who think in zones, not signals.
Trade where risk is smallest and structure is strongest.
— Wealthcafe Investments
Portfolio Strategy TesterThe Portfolio Strategy Tester is an institutional-grade backtesting framework that evaluates the performance of trend-following strategies on multi-asset portfolios. It enables users to construct custom portfolios of up to 30 assets and apply moving average crossover strategies across individual holdings. The model features a clear, color-coded table that provides a side-by-side comparison between the buy-and-hold portfolio and the portfolio using the risk management strategy, offering a comprehensive assessment of both approaches relative to the benchmark.
Portfolios are constructed by entering each ticker symbol in the menu, assigning its respective weight, and reviewing the total sum of individual weights displayed at the top left of the table. For strategy selection, users can choose between Exponential Moving Average (EMA), Simple Moving Average (SMA), Wilder’s Moving Average (RMA), Weighted Moving Average (WMA), Moving Average Convergence Divergence (MACD), and Volume-Weighted Moving Average (VWMA). Moving average lengths are defined in the menu and apply only to strategy-enabled assets.
To accurately replicate real-world portfolio conditions, users can choose between daily, weekly, monthly, or quarterly rebalancing frequencies and decide whether cash is held or redistributed. Daily rebalancing maintains constant portfolio weights, while longer intervals allow natural drift. When cash positions are not allowed, capital from bearish assets is automatically redistributed proportionally among bullish assets, ensuring the portfolio remains fully invested at all times. The table displays a comprehensive set of widely used institutional-grade performance metrics:
CAGR = Compounded annual growth rate of returns.
Volatility = Annualized standard deviation of returns.
Sharpe = CAGR per unit of annualized standard deviation.
Sortino = CAGR per unit of annualized downside deviation.
Calmar = CAGR relative to maximum drawdown.
Max DD = Largest peak-to-trough decline in value.
Beta (β) = Sensitivity of returns relative to benchmark returns.
Alpha (α) = Excess annualized risk-adjusted returns relative to benchmark.
Upside = Ratio of average return to benchmark return on up days.
Downside = Ratio of average return to benchmark return on down days.
Tracking = Annualized standard deviation of returns versus benchmark.
Turnover = Average sum of absolute changes in weights per year.
Cumulative returns are displayed on each label as the total percentage gain from the selected start date, with green indicating positive returns and red indicating negative returns. In the table, baseline metrics serve as the benchmark reference and are always gray. For portfolio metrics, green indicates outperformance relative to the baseline, while red indicates underperformance relative to the baseline. For strategy metrics, green indicates outperformance relative to both the baseline and the portfolio, red indicates underperformance relative to both, and gray indicates underperformance relative to either the baseline or portfolio. Metrics such as Volatility, Tracking Error, and Turnover ratio are always displayed in gray as they serve as descriptive measures.
In summary, the Portfolio Strategy Tester is a comprehensive backtesting tool designed to help investors evaluate different trend-following strategies on custom portfolios. It enables real-world simulation of both active and passive investment approaches and provides a full set of standard institutional-grade performance metrics to support data-driven comparisons. While results are based on historical performance, the model serves as a powerful portfolio management and research framework for developing, validating, and refining systematic investment strategies.

SZO - Signal Zone Oscillator ## Signal Zone Oscillator - SZO
**Created by:** @TraderCurses
**Version:** 1.0 (October 2025)
### ▌ OVERVIEW
The Signal Zone Oscillator (SZO) is a comprehensive momentum tool designed to provide a clearer, more nuanced view of market dynamics. It synthesizes three of the most powerful classic indicators—RSI, a unique MACD Ratio, and the Stochastic oscillator—into a single, unified signal.
The indicator's core feature is the **"Signal Zone"**: a colored area between the main oscillator line and its moving average filter. This zone makes it incredibly easy to visualize shifts in momentum, trends, and potential entry/exit points.
### ▌ KEY FEATURES
* **Composite Formula:** Combines RSI, MACD Ratio, and Stochastic using a weighted average to measure underlying market momentum.
* **The Signal Zone:** The flagship feature. The area between the SZO line and its filter is colored **green** in a bullish context (SZO above filter) and **red** in a bearish context (SZO below filter).
* **Dynamic Coloring:** Both the main SZO line and its filter change color dynamically, providing instant feedback on direction and strength.
* **Zero-Line Reference:** A dashed zero line acts as a classic equilibrium level, helping to confirm stronger bullish or bearish momentum.
* **Fully Customizable:** Every parameter is adjustable. You can change the lengths, sources, and even the weights of the core indicators from the settings menu.
* **Built-in Alerts:** Comes with pre-configured alerts for crossovers of the filter and the zero line, allowing you to automate your monitoring.
### ▌ HOW TO USE IT
The SZO provides several clear signals for traders:
1. **Bullish Signal:**
* The SZO line crosses **above** its filter.
* The Signal Zone turns **green**.
* A cross above the zero line can be used as further confirmation of strong bullish momentum.
2. **Bearish Signal:**
* The SZO line crosses **below** its filter.
* The Signal Zone turns **red**.
* A cross below the zero line can be used as further confirmation of strong bearish momentum.
3. **Divergences:**
* Like any oscillator, look for divergences between the SZO's peaks/troughs and the price action to spot potential reversals.
This tool is designed for traders who want to cut through the noise and get a clear, actionable signal from multiple momentum sources at once. Happy trading!

AI Bot Regime Feed (v6) — stableThis indicator generates real-time, structured JSON alerts for external trading bots or automation systems.
It combines multiple technical layers to identify market regimes and high-probability buy/sell events, and sends them to any webhook endpoint (e.g., a FastAPI or Zapier listener).

Stochastic Arrows Crossover with Alerts [TED]This indicator highlights key Stochastic %K and %D crossovers, helping traders identify potential buy and sell signals with visual triangle arrows and custom alerts. It uses the Stochastic Oscillator, which is a momentum indicator that compares the closing price to the price range over a given period.
Key Features:
Visual Arrows: The indicator plots green triangle-up arrows for bullish crossovers and red triangle-down arrows for bearish crossovers on the chart.
Customizable Parameters: You can adjust the period for %K, %D, and the smoothing factor to fit your trading strategy.
Overbought/Oversold Zones: The background color fills between the 80 (Overbought) and 20 (Oversold) levels, helping you visualize potential reversal areas.
Alerts: Set up dynamic alerts based on the crossover events, including:
Bullish and Bearish Crossovers
Crossover Events from the Previous Bar
How to Use:
Bullish Signal: When the %K line crosses above the %D line, it signals a potential buying opportunity. This is visually represented with a green triangle-up arrow on the chart.
Bearish Signal: When the %K line crosses below the %D line, it signals a potential selling opportunity, indicated by a red triangle-down arrow on the chart.
Overbought/Oversold Zones: The background color fill helps identify overbought or oversold market conditions, which may indicate a potential reversal.
Custom Alerts:
You can set alerts for:
Bullish Crossover: When the %K line crosses above the %D line.
Bearish Crossover: When the %K line crosses below the %D line.
Previous Bar Crossovers: Alerts for crossovers from one bar ago (helpful for backtesting).
Instructions:
Add the Indicator: Apply this Stochastic Arrows Crossover indicator to your chart from the public library.
Customize Settings: Adjust the input parameters like K period, D period, and Smoothing to match your preferred settings.
Enable Alerts:
Once added to your chart, you can set up alerts from the Alert Panel on TradingView.
Choose from the available alert conditions (Bullish Crossover, Bearish Crossover, or Crossover from the Previous Bar).
Set your desired timeframe and alert message to receive notifications for the crossovers.
Monitor the Chart: Keep an eye on the arrows and background color fill to interpret potential trade setups based on the Stochastic Oscillator's behavior.
MAxRSI Signals [KedArc Quant]Description:
MAxRSI Indicator Marks LONG/SHORT signals from a Moving Average crossover and (optionally) confirms them with RSI. Includes repaint-safe confirmation, optional higher-timeframe (HTF) smoothing, bar coloring, and alert conditions.
Why combine MA + RSI
* The MA crossover is the primary trend signal (fast trend vs slow trend).
* RSI is a gate, not a second, separate signal. A crossover only becomes a trade signal if momentum agrees (e.g., RSI ≥ level for LONG, ≤ level for SHORT). This reduces weak crosses in ranging markets.
* The parts are integrated in one rule: *Crossover AND RSI condition (if enabled)* → plot signal/alert. No duplicated outputs or unrelated indicators.
How it works (logic)
* MA types: SMA / EMA / WMA / HMA (HMA is built via WMA of `len/2` and `len`, then WMA with `sqrt(len)`).
* Signals:
* LONG when *Fast MA crosses above Slow MA* and (if enabled) *RSI ≥ Long Min*.
* SHORT when *Fast MA crosses below Slow MA* and (if enabled) *RSI ≤ Short Max*.
* Repaint-safe (optional): confirms crosses on closed bars to avoid intrabar repaint.
* HTF (optional): computes MA/RSI on a higher timeframe to smooth noise on lower charts.
* Alerts: crossover alerts + state-flip (bull↔bear) alerts.
How to use (step-by-step)
1. Add to chart. Set MA Type, Fast and Slow (keep Fast < Slow).
2. Turn Use RSI Filter ON for confirmation (default: RSI 14 with 50/50 levels).
3. (Optional) Turn Repaint-Safe ON for close-confirmed signals.
4. (Optional) Turn HTF ON (e.g., 60 = 1h) for smoother signals on low TFs.
5. Enable alerts: pick “MAxRSI Long/Short” or “Bullish/Bearish State”.
Timeframe guidance
* Intraday (1–15m): EMA 9–20 fast vs EMA 50 slow, RSI filter at 50/50.
* Swing (1h–D): EMA 20 fast vs EMA 200 slow, RSI 50/50 (55/45 for stricter).
What makes it original
* Repaint-safe cross confirmation (previous-bar check) for reliable signals/alerts.
* HTF gating (doesn’t compute both branches) for speed and clarity.
* Warning-free MA helper (precomputes SMA/EMA/WMA/HMA each bar), HMA built from built-ins only.
* State-flip alerts and optional RSI overlay on price pane.
Built-ins used
`ta.sma`, `ta.ema`, `ta.wma`, (HMA built from these), `ta.rsi`, `ta.crossover`, `ta.crossunder`, `request.security`, `plot`, `plotshape`, `barcolor`, `alertcondition`, `input.*`, `math.*`.
Note: Indicator only (no orders). Test settings per symbol. Not financial advice.
⚠️ Disclaimer
This script is provided for educational purposes only.
Past performance does not guarantee future results.
Trading involves risk, and users should exercise caution and use proper risk management when applying this strategy.

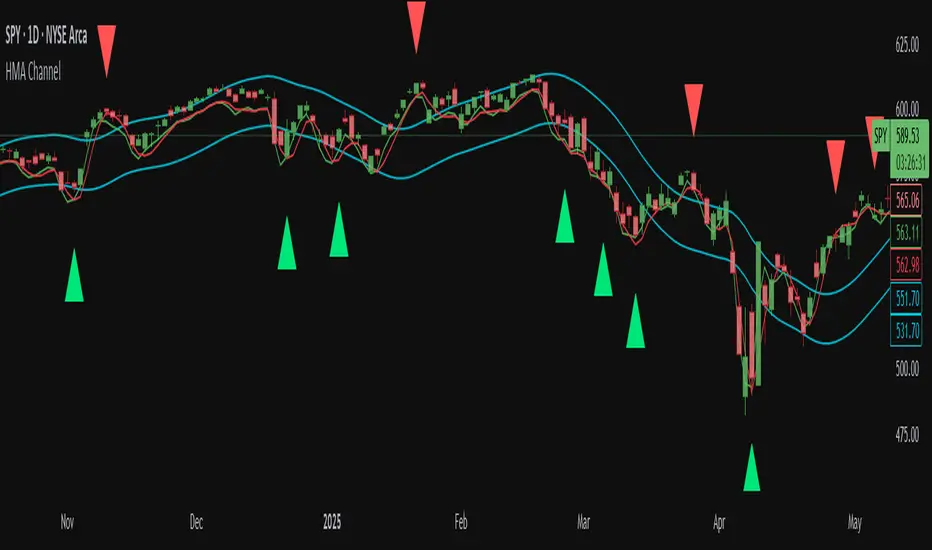
Trend ChannelThis Trend Channel is designed to simplify how traders view trends, while also keeping track of potential shifts in trends with signals. It is designed for traders that prefer less over more.
The indicator can be used for trend following, trend reversals and confirmation in combination with price or other indicators.
At the core is one EMA and a smoothed volatility based channel around it.
The purpose of the channel is to avoid false signals on trend reclaim or trend loss and instead identify trend deviations.
The indicator also incorporates long and short EMA cross-over signals to recognize possible shifts in trend without having to overlay multiple EMAs and keep the chart cleaner.
Additionally the indicator fires warnings for potential false signals on golden/death crosses with a letter "W" above/below the signal candle. Those warnings are based on the distance between price and the crossover. When the distance is above a certain threshold the indicator fires a warning that price might mean revert.
Traders can customize all inputs in the settings.

RMA Smoothed RSIRMA Smoothed RSI
Description:
An enhanced RSI built for cleaner intraday and swing reads. It applies RMA smoothing to damp noise.
How It Works
RSI (RMA-Smoothed):
Computes classic RSI from price changes and smooths the result with an additional RMA (user-controlled 3–7, where 5 is the sweet spot). This reduces whipsaw while preserving shifts in momentum.
How to Interpret
50 Midline = Bias Filter: Above 50 favors strength; below 50 favors weakness.
RSI vs RSI-MA Crosses: Cross up can precede thrust or mean-revert toward 50; cross down the opposite.
Inputs
Length: RSI period (default 14).
Source: Price source for RSI (default Close).
Smoothing: RMA smoothing length on RSI (3–7; default 3; 5 sweet spot).
Calculate Divergence: Toggle to compute pivots/divergences and enable alerts.
Moving Average Type: None, SMA, EMA, WMA, VWMA (default EMA).
MA Length: Length of the RSI-based MA (separate from RSI length).
Best For
Traders who want a cleaner RSI read without losing responsiveness.
Scalpers timing momentum shifts around the 50 line and MA crosses.
Swing traders using divergences as early reversal context.
Pro Tips
For fast intraday charts, start with Length 14, Smoothing 3–5, and EMA as the RSI-MA.
Use 50 reclaims/rejections as a simple regime filter.
Combine divergence labels with volume surges, key S/R, or volatility tools (e.g., BBW/TTM squeeze) to time entries.
Divergence alerts fire only if Calculate Divergence is enabled—keep it on if you rely on signals.

[GrandAlgo] Moving Averages Cross LevelsMoving Averages Cross Levels
Many traders watch for moving average crossovers – such as the golden cross (50 MA crossing above 200 MA) or death cross – as signals of changing trends. However, once a crossover happens, the exact price level where it occurred often fades from view, even though that level can be an important reference point. Moving Averages Cross Levels is an indicator that keeps those crossover price levels visible on your chart, helping you track where momentum shifts occurred and how price behaves relative to those key levels.
This tool plots horizontal line segments at the price where each pair of selected moving averages crossed within a recent window of bars. Each level is labeled with the moving average lengths (for example, “21×50” for a 21/50 MA cross) and is color-coded – green for bullish crossovers (short-term MA crossing above long-term MA) and red for bearish crossunders (short-term crossing below). By visualizing these crossover levels, you can quickly identify past trend change points and use them as potential support/resistance or decision levels in your trading. Importantly, this indicator is non-repainting – once a crossover level is plotted, it remains fixed at the historical price where the cross occurred, allowing you to continually monitor that level going forward. (As with any moving average-based analysis, crossover signals are lagging, so use these levels in conjunction with other tools for confirmation.)
Key Features:
✅ Multiple Moving Averages: Track up to 7 different MAs (e.g. 5, 8, 21, 50, 64, 83, 200 by default) simultaneously. You can enable/disable each MA and set its length, allowing flexible combinations of short-term and long-term averages.
✅ Selectable MA Type: Each average can be calculated as a Simple (SMA), Exponential (EMA), Volume-Weighted (VWMA), or Smoothed (RMA) moving average, giving you flexibility to match your preferred method.
✅ Auto Crossover Detection: The script automatically detects all crosses between any enabled MA pairs, so you don’t have to specify pairs manually. Whether it’s a fast cross (5×8) or a long-term cross (50×200), every crossover within the lookback period will be identified and marked.
✅ Horizontal Level Markers: For each detected crossover, a horizontal line segment is drawn at the exact price where the crossover occurred. This makes it easy to glance at your chart and see precisely where two moving averages intersected in the recent past.
✅ Labeled and Color-Coded: Each crossover line is labeled with the two MA lengths that crossed (e.g. “50×200”) for clear identification. Colors indicate crossover direction – by default green for bullish (positive) crossovers and red for bearish (negative) crossovers – so you can tell at a glance which way the trend shifted. (You can customize these colors in the settings.)
✅ Adjustable Lookback: A “Crosses with X candles” input lets you control how far back the script looks for crossovers to plot. This prevents your chart from getting cluttered with too many old levels – for example, set X = 100 to show crossovers from roughly the last 100 bars. Older crossover lines beyond this lookback window will automatically clear off the chart.
✅ Optional MA Plots: You can toggle the display of each moving average line on the chart. This means you can either view just the crossover levels alone for a clean look, or also overlay the MA curves themselves for additional context (to see how price and MAs were moving around the crossover).
✅ No Repainting or Hindsight Bias: Once a crossover level is plotted, it stays at that fixed price. The indicator doesn’t move levels around after the fact – each line is a true historical event marker. This allows you to backtest visually: see how price acted after the crossover by observing if it retested or respected that level later.
How It Works:
1️⃣ Add to Chart & Configure – Simply add the indicator to your chart. In the settings, choose which moving averages you want to include and set their lengths. For example, you might enable 21, 50, 200 to focus on medium and long-term crosses (including the golden cross), or turn on shorter MAs like 5 and 8 for quick momentum shifts. Adjust the lookback (number of bars to scan for crosses) if needed.
2️⃣ Visualization – The script continuously checks the latest X bars for any points where one MA crossed above or below another. Whenever a crossover is found, it calculates the exact price level at which the two moving averages intersected. On the last bar of your chart, it will draw a horizontal line segment extending from the crossover bar to the current bar at that price level, and place a label to the right of the line with the MA lengths. Green lines/labels signify bullish crossovers (where the first MA crossed above the second), and red lines indicate bearish crossunders.
3️⃣ On Your Chart – You will see these labeled levels aligned with the price scale. For example, if a 50 MA crossed above a 200 MA (bullish) 50 bars ago at price $100, there will be a green “50×200” line at $100 extending to the present, showing you exactly where that golden cross happened. You might notice price pulling back near that level and bouncing, or if price falls back through it, it could signal a failed crossover. The indicator updates in real-time: if a new crossover happens on the latest bar, a new line and label will instantly appear, and if any old cross moves out of the lookback range, its line is removed to keep the chart focused.
4️⃣ Customization – You can fine-tune the appearance: toggle any MA’s visibility, change line colors or label styles, and modify the lookback length to suit different timeframes. For instance, on a 1-hour chart you might use a lookback of 500 bars to see a few weeks of cross history, whereas on a daily chart 100 bars (about 4–5 months) may be sufficient. Adjust these settings based on how many crossover levels you find useful to display.
Ideal for Traders Who:
Use MA Crossovers in Strategy: If your strategy involves moving average crossovers (for trend confirmation or entry/exit signals), this indicator provides an extra layer of insight by keeping the price of those crossover events in sight. For example, trend-followers can watch if price stays above a bullish crossover level as a sign of trend strength, or falls below it as a sign of weakness.
Identify Support/Resistance from MA Events: Crossover levels often coincide with pivot points in market sentiment. A crossover can act like a regime change – the level where it happened may turn into support or resistance. This tool helps you mark those potential S/R levels automatically. Rather than manually noting where a golden cross occurred, you’ll have it highlighted, which can be useful for setting stop-losses (e.g. below the crossover price in a bullish scenario) or profit targets.
Track Multiple Averages at Once: Instead of focusing on just one pair of moving averages, you might be interested in the interaction of several (short, medium, and long-term trends). This indicator caters to that by plotting all relevant crossovers among your chosen MAs. It’s great for multi-timeframe thinkers as well – e.g. you could apply it on a higher timeframe chart to mark major cross levels, then drill down to lower timeframes knowing those key prices.
Value Clean Visualization: There are no flashing signals or arrows – just simple lines and labels that enhance your chart’s storytelling. It’s ideal if you prefer to make trading decisions based on understanding price interaction with technical levels rather than following automatic trade calls. Moving Averages Cross Levels gives you information to act on, without imposing any bias or strategy – you interpret the crossover levels in the context of your own trading system.

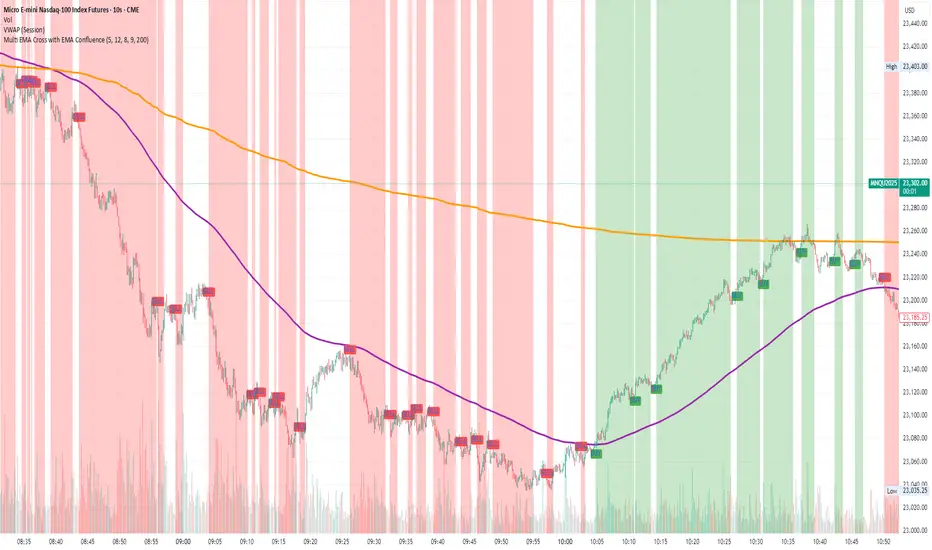
Multi EMA Cross with EMA ConfluenceMulti EMA Cross with EMA Confluence
This indicator combines the power of multiple EMA crossovers with a higher-timeframe confluence filter to help traders visualize potential bullish and bearish conditions on their charts.
Two groups of EMAs work together to establish alignment:
Group 1 (Fast / Slow Pair) – Shorter-term momentum shifts
Group 2 (Fast / Slow Pair) – Broader trend confirmation
On top of that, an optional Confluence EMA (default 200 EMA) acts as an additional filter, ensuring that signals align with the larger market trend.
Key features:
Customizable EMA lengths, colors, and confluence settings
Background highlighting when conditions align bullish or bearish
Clear buy/sell labels when new conditions trigger
Flexible enough to adapt across timeframes and trading styles
This tool is designed to enhance chart clarity and help you stay aligned with momentum and trend. It is not meant to replace your own analysis but rather to complement it.
Disclaimer: This script is for educational and informational purposes only. It is not financial advice. Trading involves risk, and you should always do your own research or consult with a licensed financial professional before making investment decisions.
Cnagda Trading ToolCnagda Trading Tools - complete set of intraday trading
1. Trendline breakout based On ATR.
2. Live RSI, volume/candle average 20 Periods, trend direction last 34 periods, and some useful dashboard features.
3. Ma Scalp Line provide trend support and resistance + Where Line More Flat Previous Time You Also Use That Range As Support And Resistance
4. RSI based POC ( Point Of Control) indicate high Volume Area like fixed Range Volume profile
5. London session breakout with buy/sell Signal and NewYork session opening half hour range breakout with Buy/sell signal
Ma Scalp Buy And Sell Signal For Short term Scalping ( 5 Min Timeframe) Based on Ema And Wma Crossover
I hope these tools will improve your trading, but you should trade only after proper research, this indicator is not responsible for any loss.

EMA 9/21 Crossover Alert (BerryRight)This indicator gives entry signals through EMA crossover and the gives the opportunity to set up alerts. I will update this indicator with exits in the future. it's written in Pinesctipt v5

Wavelet-Trend ML Integration [Alpha Extract]Alpha-Extract Volatility Quality Indicator
The Alpha-Extract Volatility Quality (AVQ) Indicator provides traders with deep insights into market volatility by measuring the directional strength of price movements. This sophisticated momentum-based tool helps identify overbought and oversold conditions, offering actionable buy and sell signals based on volatility trends and standard deviation bands.
🔶 CALCULATION
The indicator processes volatility quality data through a series of analytical steps:
Bar Range Calculation: Measures true range (TR) to capture price volatility.
Directional Weighting: Applies directional bias (positive for bullish candles, negative for bearish) to the true range.
VQI Computation: Uses an exponential moving average (EMA) of weighted volatility to derive the Volatility Quality Index (VQI).
Smoothing: Applies an additional EMA to smooth the VQI for clearer signals.
Normalization: Optionally normalizes VQI to a -100/+100 scale based on historical highs and lows.
Standard Deviation Bands: Calculates three upper and lower bands using standard deviation multipliers for volatility thresholds.
Signal Generation: Produces overbought/oversold signals when VQI reaches extreme levels (±200 in normalized mode).
Formula:
Bar Range = True Range (TR)
Weighted Volatility = Bar Range × (Close > Open ? 1 : Close < Open ? -1 : 0)
VQI Raw = EMA(Weighted Volatility, VQI Length)
VQI Smoothed = EMA(VQI Raw, Smoothing Length)
VQI Normalized = ((VQI Smoothed - Lowest VQI) / (Highest VQI - Lowest VQI) - 0.5) × 200
Upper Band N = VQI Smoothed + (StdDev(VQI Smoothed, VQI Length) × Multiplier N)
Lower Band N = VQI Smoothed - (StdDev(VQI Smoothed, VQI Length) × Multiplier N)
🔶 DETAILS
Visual Features:
VQI Plot: Displays VQI as a line or histogram (lime for positive, red for negative).
Standard Deviation Bands: Plots three upper and lower bands (teal for upper, grayscale for lower) to indicate volatility thresholds.
Reference Levels: Horizontal lines at 0 (neutral), +100, and -100 (in normalized mode) for context.
Zone Highlighting: Overbought (⋎ above bars) and oversold (⋏ below bars) signals for extreme VQI levels (±200 in normalized mode).
Candle Coloring: Optional candle overlay colored by VQI direction (lime for positive, red for negative).
Interpretation:
VQI ≥ 200 (Normalized): Overbought condition, strong sell signal.
VQI 100–200: High volatility, potential selling opportunity.
VQI 0–100: Neutral bullish momentum.
VQI 0 to -100: Neutral bearish momentum.
VQI -100 to -200: High volatility, strong bearish momentum.
VQI ≤ -200 (Normalized): Oversold condition, strong buy signal.
🔶 EXAMPLES
Overbought Signal Detection: When VQI exceeds 200 (normalized), the indicator flags potential market tops with a red ⋎ symbol.
Example: During strong uptrends, VQI reaching 200 has historically preceded corrections, allowing traders to secure profits.
Oversold Signal Detection: When VQI falls below -200 (normalized), a lime ⋏ symbol highlights potential buying opportunities.
Example: In bearish markets, VQI dropping below -200 has marked reversal points for profitable long entries.
Volatility Trend Tracking: The VQI plot and bands help traders visualize shifts in market momentum.
Example: A rising VQI crossing above zero with widening bands indicates strengthening bullish momentum, guiding traders to hold or enter long positions.
Dynamic Support/Resistance: Standard deviation bands act as dynamic volatility thresholds during price movements.
Example: Price reversals often occur near the third standard deviation bands, providing reliable entry/exit points during volatile periods.
🔶 SETTINGS
Customization Options:
VQI Length: Adjust the EMA period for VQI calculation (default: 14, range: 1–50).
Smoothing Length: Set the EMA period for smoothing (default: 5, range: 1–50).
Standard Deviation Multipliers: Customize multipliers for bands (defaults: 1.0, 2.0, 3.0).
Normalization: Toggle normalization to -100/+100 scale and adjust lookback period (default: 200, min: 50).
Display Style: Switch between line or histogram plot for VQI.
Candle Overlay: Enable/disable VQI-colored candles (lime for positive, red for negative).
The Alpha-Extract Volatility Quality Indicator empowers traders with a robust tool to navigate market volatility. By combining directional price range analysis with smoothed volatility metrics, it identifies overbought and oversold conditions, offering clear buy and sell signals. The customizable standard deviation bands and optional normalization provide precise context for market conditions, enabling traders to make informed decisions across various market cycles.

Pucci Trend EMA-SMA Crossover with TolerancePucci Trend EMA-SMA Crossover with Tolerance
This indicator helps identify market trends and generates trading signals based on the crossover between an Exponential Moving Average (EMA) and a Simple Moving Average (SMA) with an adjustable tolerance threshold. The signals work as follows:
Buy Signal (B) -> Triggers when the EMA crosses above the SMA, exceeding a user-defined tolerance (in basis points). Optionally, a price filter can require the high or low to be below the EMA for confirmation.
Sell Signal (S) -> Triggers when the SMA crosses above the EMA, exceeding the tolerance. The optional price filter may require the high or low to be above the EMA.
The tolerance helps reduce false signals by requiring a minimum distance between the moving averages before confirming a crossover. The price filter adds an extra confirmation layer by checking if price action respects the EMA level.
Important Notes:
1º No profitability guarantee: This tool is for analysis only and may generate losses.
2º "As Is" disclaimer: Provided without warranties or responsibility for trading outcomes.
3º Use Stop Loss: Users must determine their own risk management.
4º Parameter adjustment needed: Optimal MA periods and tolerance vary by timeframe.
5º Filter impact varies: Enabling/disabling the price filter may improve or worsen performance.

Hull MA Channel with Filtered CrossoversI've created an indicator that let's you create a HMA channel with 2 displaced HMA (A/B). As well as a HMA crossover set (C/D).
Here's how it works:
The HMA crossovers from C and D will not signal unless they are outside of the channel of A and B. As a matter of fact, NO buy signal whatsoever will occur above the channel and NO sell signal will occur below the channel.
The crossover HMA pair (C/D) can have their lengths adjusted to the 0.00 decimal point for VERY fine tuning of the crossovers.
(edit-it doesn't fine tune to the .00. This must not be a feature that is able to be utilized. I tried) The length adjustment still works to the nearest whole number. The .00 are mute :(
In keeping with that same logic, you can adjust the displacement of the channel independently to the 0.00 decimal, again for VERY fine tuning.
This is great for reversals while eliminating noise from false signals, keeping the chart nice and clean. Should be used in combination with other indicators for the best confirmations.
RSI-EMA-Crossing with Donchian-Stop-LossThe Donchian RSI Indicator is a visual tool that combines momentum and trend analysis to identify high-quality long opportunities based on RSI crossovers, price action, and Donchian channel dynamics.
How It Works
Momentum Signal: A bullish RSI crossover is detected when the RSI crosses above its moving average.
Trend Filter: A signal is only valid if the crossover occurs while the price is above its moving average – filtering out entries against the prevailing trend.
Signal Candle: The high of the crossover candle is stored.
Entry Trigger: A valid signal occurs when a later candle closes above that signal high.
Stop-Loss (Visual Only)
The lower band of the Donchian Channel acts as a visual reference for a dynamic stop-loss level.
Features
Customizable RSI, Donchian Channel, and moving average lengths
Selectable MA types: SMA, EMA, WMA, VWMA, HMA
Signal candle highlighted (yellow background)
Entry points labeled on the chart
Price MA and Donchian Channel plotted
Trend filter improves signal quality by confirming upward bias
Use Case
Designed for swing and position traders
Optimized for use on daily or 4H charts
