[PX] External LevelHello everyone,
today I'd like to share a script, which enables you to use external logic to plot levels on your chart.
How does it work?
The concept is based on two scripts. One script, which uses an external input as a trigger to print a new level and one script that calculates an output, which will be fetched.
Sounds complicated? It really is not! Let's take a closer look.
// This source code is subject to the terms of the Mozilla Public License 2.0 at mozilla.org
// © paaax
//@version=4
study("RSI OS/OB")
l = input(14, "RSI Length")
ob = input(70, "Overbought")
os = input(30, "Oversold")
r = rsi(close, l)
hline(ob)
hline(os)
plot(r, "RSI", color=color.orange)
// The following plot produces an output, which will be fetched the "External Level"-script.
// It evaluates to one of the following three values: 1.0, -1.0 or 0.0
plot(crossover(r, ob) ? 1.0 : crossunder(r, os) ? -1.0 : 0.0, "Output", transp=100)
The example script above uses an RSI and two threshold levels (70 and 30). The logic here is, that whenever the RSI is crossing down the lower threshold or crossing up the upper threshold we'd consider the current movement to be either oversold or overbought. Therefore, it's a point of interest, which we could visualize with a level.
The script creates an output when the crossover or crossunder of a threshold happens. A crossover would result in a value of 1.0, a crossunder in a value of -1.0. In all other cases the value would be 0.0.
The output of the RSI script would then be used as an input of the External Level script, which has a "Source"-parameter in its input-section. If the fetched input shows 1.0, then the script prints a resistance level. If it shows -1.0 a support level will be printed. And that's basically it. A very simple approach to print levels on your chart with an infinite number of use cases.
For example, you could use fetch outputs from a MACD script, MA script, outputs based on volume or price movement. Just remember the output has to evaluate to either 1.0 or -1.0 and has to be selected in the input-section.
Hope that might be useful to some of you :)
Please click the "Like"-button and follow me for future open-source script publications.
If you are looking for help with your custom PineScript development, don't hesitate to contact me directly here on Tradingview or through the link in my signature :)
Crossover

MA Crossover IndexJust 3 Moving Averages with adjustable settings, plus signals crossover between price and MA Media.
Types of MAs supported:
SMA, EMA, WMA, VWMA, SMMA, DEMA, TEMA, Hull/MA, ZEMA, TMA, SSMA
The signal is given when the price crosses the MA Average.
The random line only works on indices, it indicates that if the price exceeds it, the continuation of that movement is possible.
Option to place TP and SL recommended only on Indices.

MultiType Shifting Predictive Moving Averages (MA) CrossoverJust 2 Moving Averages with adjustable settings and shifting capability, plus signals and predicting continuations.
At the time of publish these different types of MAs are supported:
- SMA (Simple)
- EMA (Exponential)
- DEMA (Double Exponential)
- TEMA (Triple Exponential)
- RMA (Adjusted Exponential)
- WMA (Weighted)
- VWMA (Volume Weighted)
- SWMA (Symmetrically Weighted)
- HMA (Hull)
I'm looking forward to any idea about filtering the signals. Thanks.

Jackrabbit.modulus.StochasticThis is the Stochastic for the Jackrabbit suite and modulus framework.
This indicator supports differential timeframe analysis and confirmational bias. Dynamic timeframes are supported.
This is an updated view of Stochastic and supports traditional overbought/sold boundaries and cross over regions.
The main indicatior and the confirmational indicator can both be individually tuned for the %K, and %D moving averages with different and independent lengths and 30 different moving average types:
SMA, Double SMA, Triple SMA,
EMA, Double EMA, Triple EMA,
RMA, Double RMA, Triple RMA
WMA, Double WMA, Triple WMA,
VWMA, Double VWMA, Triple VWMA,
Hull, Double Hull, Triple Hull,
ZLEMA, Double ZLEMA, Triple ZLEMA,
SWMA, Double SWMA, Triple SWMA,
SSMA, Double SSMA, Triple SSMA,
SMMA,Double SMMA, Triple SMMA
The Jackrabbit modulus framework is a plug in play paradigm built to operate through TradingView's indicator on indicatior (IoI) functionality. As such, this script receives a signal line from the previous script in the IoI chain, and evaluates the buy/sell signals appropriate to the current analysis. The results are either combined with the signal line, or used as confirmation to the signal line. A new signal line is generated for the next script in the link.
This script is not designed or meant to function outside my framework and contains no alert capabilities.
By default, the signal line is visible and the charts are turned off. Signal line visibility is controlled by the Style tab, and the charts display is controlled by the indicator settings tab.
This script is by invitation only. To learn more about accessing this script, please see my signature or send me a PM. Thank you.

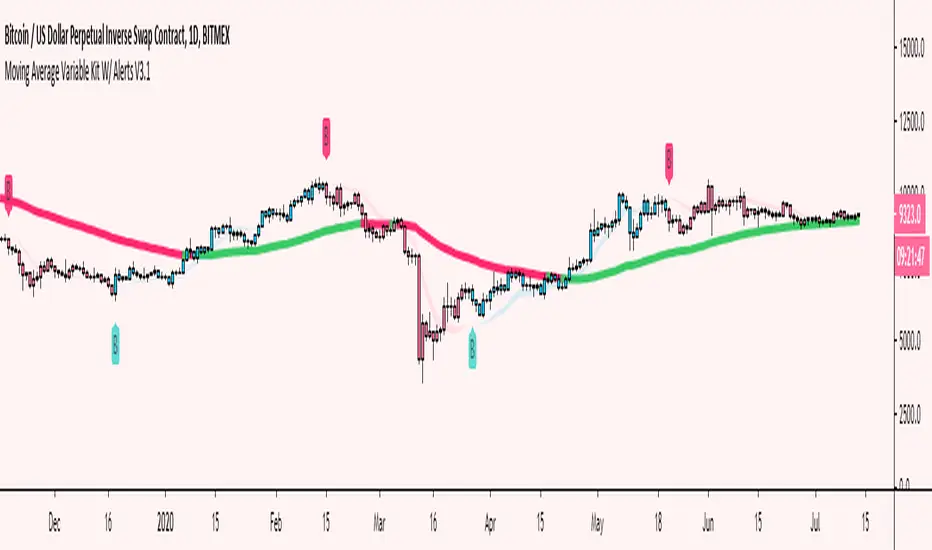
Moving Average Variable Kit W/ Alerts V3 [Moon]Create your own MA system
5 basic kinds of Moving Average types available for now
DEMA
EMA
SMA
TEMA
WMA
Mix and match moving average types and lengths.
Create your own alerts built into Tradingview.
Turn alerts or MAs off or on with 1 click.
Choose visual transparency and alert coloration - everything is customizable.
Trend candles on crossovers.
Choose your MA input source.
Create your own MA cloud or cloud ribbons.
Trend MA coloration on candle or bar interactions.
It really empowers you to experiment and create your own trading system or strategy.
Don't be afraid to use Renko or Heikin Ashi for trend spotting or reversals.
Copy built in exchange bands or indicators for an edge up on the competition or exchange users (these are heavily watched and in my opinion do affect the price action especially on smaller coins like alts).
This is Binance's default kit that you can easily make (7/25/99) SMAs.
Works well on traditional markets or Forex | Should be cross compatible on any asset or timeframe.
Turn off a majority of signals except for "buy" or "sell" alerts. Use these clusters to DCA, short, long or take profit.
Use it to monitor classic "Golden" or "Death" crosses - Set a TV alert to get a notification when it official goes off.
These are just a few of the things you can create. I encourage you to explore further.
Send me a DM if interested.
Donchian Channel CloudsFor this indicator, I got inspired by this paragraph in an article on Investopedia:
"Donchian channels also make natural partners with another moving average indicator for a crossover strategy. The Donchian moving average middle line is likely to form the short-term average in these situations, although some have used a 20-day Donchian channel in conjunction with a five- or 10-day channel to exit a position before a consolidation eats into short-term profits."
The default is a 20-period Donchian channel with the middle line from a 10-period channel superimposed on it. Red for 20, green for 10. When 10 is over 20, the cloud between them is green; the cloud is red when 20 is over 10.

EMA BREAKOUT WITH TP OR SL [NLB]Hello Everyone,
Its Indicator Base On two exponential moving average (EMA) crossover You can Also Choice any input when EMA cross we are plots High and low
Indicator Feature
➤ Long Side Signal With Alerts
➤ Short Side Signal With Alerts
➤ Long side Take profit Calculated By Open Bar You Can Also Change Calculate Bar Source and percentage input
➤ Short side Take profit Calculated By Open Bar You Can Also Change Calculate Bar Source and percentage input
➤ Long side stop loss
➤ Short side stop loss
Important: This Indicator we are using for Automation Trading if You Want This Indicator Access Please Contact me PM on Tradingview

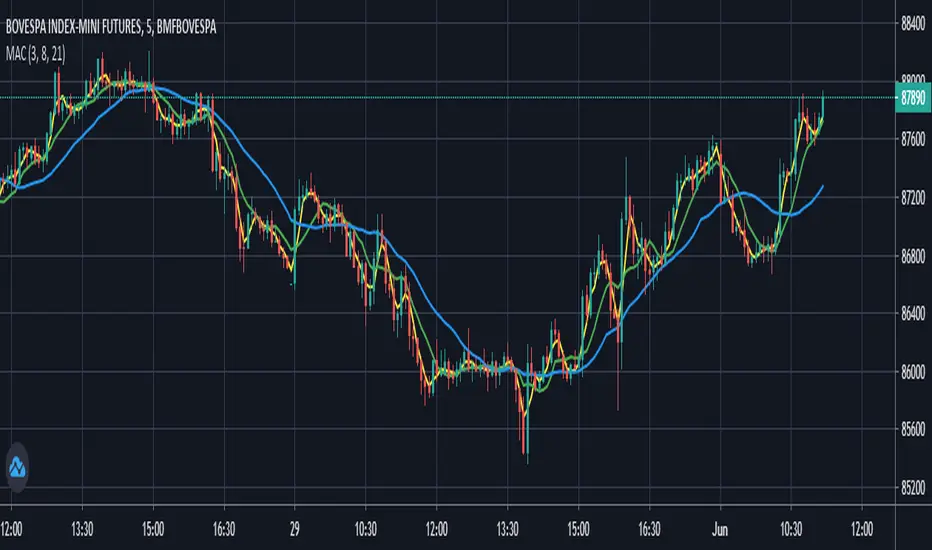
Moving Averages Convergence (Agulhada do Didi)The script is based on a strategy developed by Odir “Didi” Aguiar called “Agulhada do Didi”.
It consists in the use of 3 moving averages:
SMA 3
SMA 8
SMA 21
Strategy:
When the averages come together, preferably they pass through a candle, there is a signal. The crossing of the short average (3) with the long average (21) provides us with a confirma-tion of the entry.
Buy:
The average of 3 periods comes out on top, 8 goes in the middle and 21 goes down.
Sell:
Average of 21 periods comes out on top, 8 in the middle and 3 down.
PRIMEVAL_SERIES_0001.0 - Hyper-bullish EMA SequenceThe Primeval Series is the domain of combinations between EMAs of any specific length that apparently dictates the fabric of equity price movements. For best use, the 45-minute timeframe is ideal for short-term, explosive plays.
The series can be split into major and minor sub-series, i.e., "Epoch" and "Triassic." Epoch EMAs refer to the lengths of 618 periods and 1618 periods - these are the averages that denote major directional shifts when they cross each other on any timeframe. The Triassic EMAs are the 21, 62, and 186 lengths of any timeframe that offer incredible directional insight when they interact with the Epoch EMAs.
Triassic EMAs' seldom interact with Epoch EMAs intraday. However, their interactions with each other can be useful for quick swing trades. After discovering these oddly specific EMA lengths, my study and application of their interactions have increased my understanding of markets ten-fold. I hope they do for you as well.
Aside from the EMA lines themselves, I have created colored background lines for specific crossovers that seem to follow a bullish sequence. I have annotated the sequence in the script itself, but will also include here for ease of use. See below for more details:
Hyper-bullish EMA Sequence:
1) For best use, look for charts that are in a long-term bullish trend and have pulled back over the last 2 months.
2) Once such a stock has been identified, set the chart timeframe to 45 minutes, and apply the script.
3) The sequence begins on the nearest AQUA colored crossover. This denotes the beginning of the most-local retracement from near-term (could be all-time) highs.
4) Then, find the next ROYAL BLUE crossover background line for a potential entry. If I were tracking a stock that just displayed a ROYAL BLUE crossover, I would enter 1/4th of my planned full position.
5) Next, search for the next crossover highlighted in DARK BLUE. This is the key crossover. Enter your full position, as it is a very strong bullish confirmation signal.
6) Hold the long position until you see the penultimate GREEN crossover line. In certain cases, this is the final confirmation for the uptrend and denotes an extension upward. I would not add here, but would alternatively take 1/3rd of my profits.
7) If you take 1/3rd of your profits, you can ride the extension knowing that the trade is profitable regardless. House money trades are my favorite trades for this reason.
8) The toughest part is selling the remaining 2/3rds of your position, but there is a solution: when you see the first RED crossover line after GREEN, sell half of your remaining position. The price could come down a bit but would hold the remaining position until the next RED line appears.
**IMPORTANT: This strategy assumes that there is only ONE AQUA line at the very beginning of any given sequence. If there appears another AQUA line at any point in the sequence, SELL ALL. That is the only hard rule and is extremely unlikely to occur after a DARK BLUE cross. Keep in mind that some charts are so bullish that a GREEN LINE may never appear because the price action is so far above the Epoch_Zero EMA (yellow EMA ) that it will not be a factor for some time. Lastly, most RED crossover lines are insignificant until the GREEN line appears. Even then, they are only potential places to sell. AQUA lines are most meaningful and if you see one occur after a GREEN line, exit immediately.
Before you use this strategy, backtest it in the following way: pick any bullish stock over the past 3 months and see how the sequence pans out. I have done this over 100 times and it has worked 100 times WHEN you follow the rules listed in the "IMPORTANT" section above. Once validated, use this as a powerful weapon during bullish times.
Good luck and I hope this can make the world profitable someday.
- Perma H. Pig

Multiple Standard Moving Averages {CyberNetwork}Multiple standard moving average plots in a single script, with golden cross (GX) and death cross (DX) indicators.
Momentum filters of each MA can be applied to the GX/DX indicators -- i.e. such that the 50 SMA /200 SMA GX will only trigger if the momentum of the 200 SMA is positive, etc.
Note: User can set the triggering criterion, scaled to the % of the respective MA value.
Setting this value to negative allows the triggering of GX when MA momentum is negative (-ve), and vice versa for DX.
Each plots and indicators can be individually enabled/disabled.
This script is base on the following Multiple Moving Averages script: which allows users to set their own preferred MA candle lengths.
Multiple Moving Averages {Cybernetwork}

Volume Moving Average - evoThis script shows regular volume bars with two separate moving averages using only bullish and only bearish candles. The moving average uses the last known value of its calculation.
Using the Heikin Ashi function will smooth the colors and moving averages (good for trends):
The crossovers are a good way to see what the dominant direction of a trend is, if you test them on your time frame and instrument they might be good to trade on their own, I have not tested this and the default settings are not tuned for that.
As always, let me know if you like it or found a good way to use it :)

Ema Cross, 10 /21 / 55Ema Cross tool using Ema 10 / Ema 21 / Ema 55
I have found these settings very useful for catching breakouts on Alt coins.
Alerts Added,
Breakout = Ema 10 crossing above Ema 21
Breakdown = Ema 10 crossing under Ema 21
Ema 55 added as a useful area to catch dips when price is trending

SMA & EMA Simple CrossoverTracks and highlights trends by using a simple SMA and EMA indicator. When a shorter SMA (default set to 10 periods) and a longer EMA (default set to 20 periods) cross over, a cross is placed upon the chart at the crossover point. Defaults settings for the periods and colours can be changed the user to meet their own preferences using the settings button (i.e. without having to edit the script).

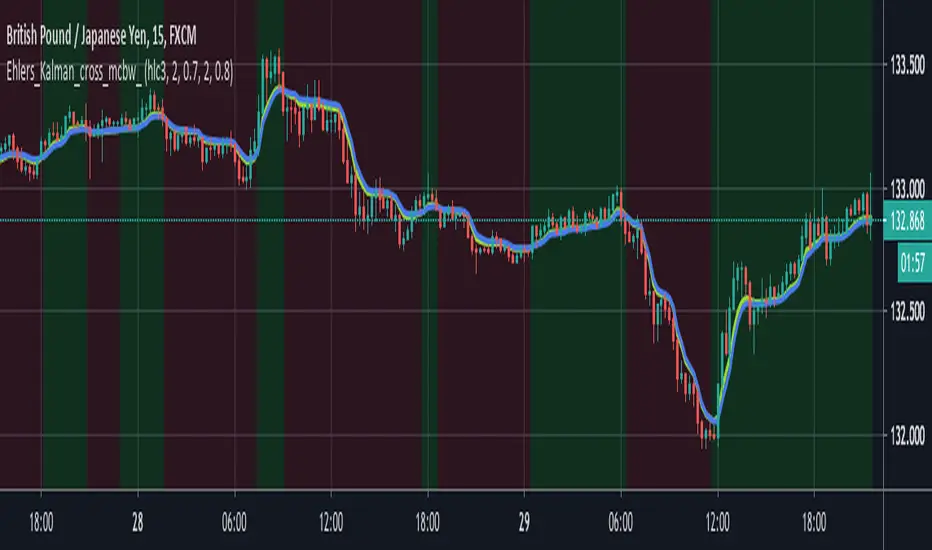
powerful moving average crossoverThis script is a simplified version of John Ehlers's adaption of Dr. Kalman's optimum estimator as applied to price action (More can be found on this here: www.dimensionetrading.com). Here I have adapted two of these optimum estimators to work together to provide crossover signals. The user can choose the input of this filter in the 'input source'. The 'Ratio of Uncertainties' controls how adaptive the moving averages are, increasing this number will increase adaptivity and vice versa for decreasing. The 'Kalman Gain' allows the user to choose how much error to let into the calculation. The smaller this number is the quicker the moving average will approach price action.
In practice this indicator is much smoother than most other moving averages and has significantly less whiplash while still getting very early entries. If anyone wants to adapt this script for their own uses please feel free. Message me what you make with it, I am very curious what this can do when in the right hands!
Happy trading!
Signal_CrossSignal_Cross
This indicator is to help traders by showing an early (buy) and exit (sell) signal as soon as possible. It can be used with other indicators that provide confirmation on trend.

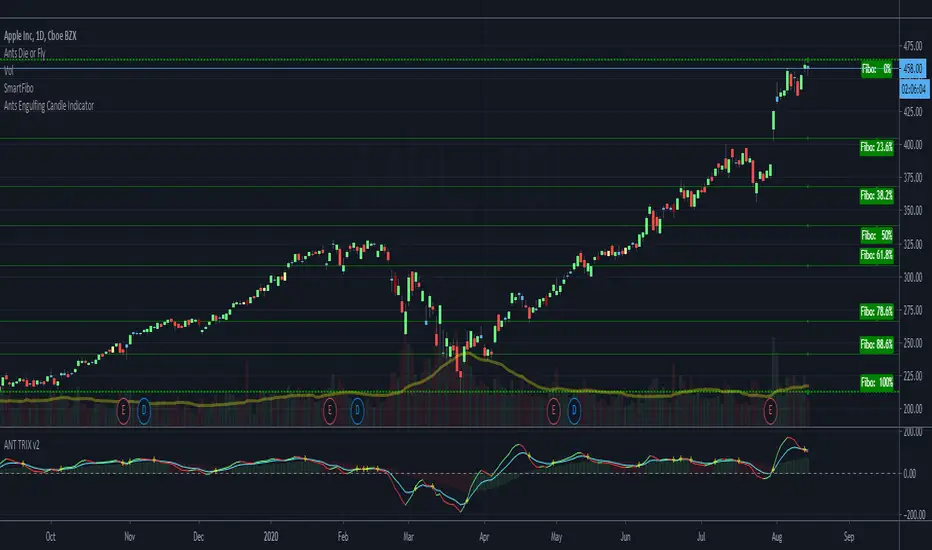
ANTS BEAST MODE TRIX+MACD TRIX CROSSThis indicator is both the TRIX + MACD all in one inidicator -- a + sign is displayed whenever the trix crosses
Fancy Triple Moving Averages [BigBitsIO]This script is for three moving averages with as many features as I can possibly fit into a single moving average.
Features:
- Three moving averages (MA1, MA2, MA3).
- Standard MA inputs.
- MA type.
- MA period.
- MA price.
- MA resolution (time frame).
- Visibility toggle.
- MA Candle Type
- Fancy MA inputs.
- Toggle to show only candles included in the MA calculation ("Highlight inclusion") or display entire MA history.
- Toggle to show a ghost trail when Highlight inclusion is toggled on. Displays a shaded version of past MA history before the inclusion period (as seen on snapshot).
- Toggle to show forecast values for the MA.
- Other inputs related to forecasting:
- Forecast bias. (Neutral forecasts MA if the current price remains the same.)
- Forecast period.
- Forecast magnitude.
*** DISCLAIMER: For educational and entertainment purposes only. Nothing in this content should be interpreted as financial advice or a recommendation to buy or sell any sort of security or investment including all types of crypto. DYOR, TYOB. ***

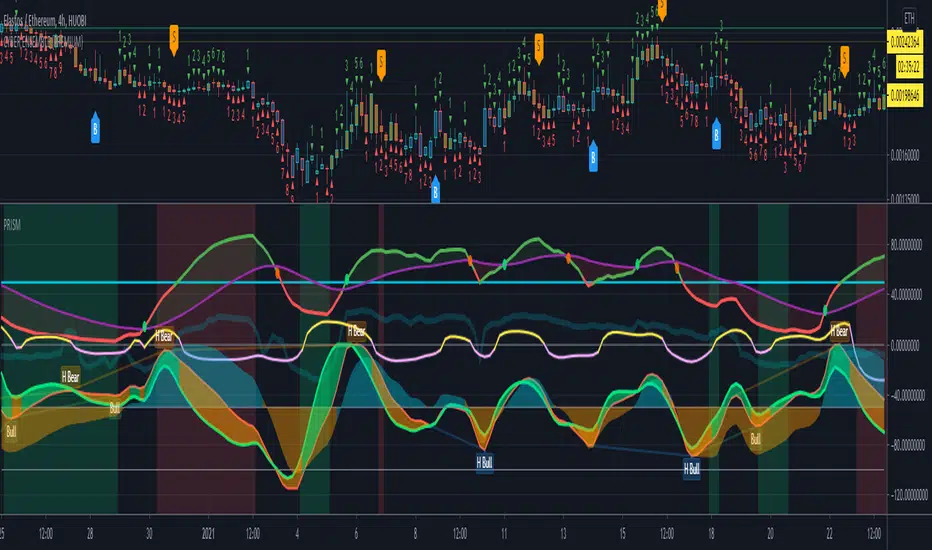
PRISM Oscillators Set {PREMIUM}The PRISM Oscillator Set consists of:
(1) A modified-pSAR derived main driving oscillator (P-Oscillator).
(2) With MAJeStic (Momentum, Acceleration, Jerk, Snap) Oscillators Set (M-, A-, J-, S-Oscillators respectively).
User can switch the main oscillator to RSI-mode (default), as well as reverting to configurable EMA/SMA MACD mode as well.
The P-Oscillator
The P-Oscillator (centered at 50 in the y-axis) indicates the instantaneous bullish/bearish cycle of the market, and the degree of which.
A MA-line is provided as well (VWMA-mode is set as the default, but user can choose to switch to SMA-mode).
The crossing of the P-Oscillator into its MA-line signals a significant turn in the P-Oscillator , similar to how the cross between MAs are being used to signal a golden/death-cross (example: P-Oscillator crossing down its MA-line indicates a probable shift into the bearish phase).
The MAJeStic-Oscillators
The MAJeStic-Oscillators are derived from the main P-Oscillator .
The M-Oscillator is the momentum oscillator, to more clearly visually indicate the current momentum phase of the main P-Oscillator -- i.e. when the oscillator is above the zeroline at -50, the P-oscillator is in an uptrend; and the magnitude of which indicates the velocity (or to be more precise, the speed) of the current momentum trend.
The AJ-Ribbon consists of the acceleration and jerk oscillators, to indicate the hidden underlying trends in the momentum. They can be thought of as the hidden force/hand that pushes and pulls the momentum oscillator upwards or downwards.
Both the M-Oscillator and the AJ-Ribbon are y-shifted down with its zeroline set at -50, simply for the purpose of clarity of presentation for this multiple-oscillator script.
The S-Oscillator is centered about the 0 as its zeroline. It is a highest-order indicator, derived from the AJ-Ribbon , and is an extremely sensitive indicator -- which is able to dig up even the more subtle market trends that may later cascade into a more macro trend. For example: when it crosses from the negative into the positive (especially with a steeply positive slope) and holds above the zeroline, it is then likely that price will see some upside movement ahead (depending on the magnitude of the oscillator as well), even if it may presently be simply moving sideways or even downwards (i.e. a divergence in the S-oscillator wrt the current price movement).
The alignment of the various indicators gives the clearest signal of the market trend, however, that naturally isn't always the case. Hence, when signals from the oscillators looks conflicted, the higher order oscillators (i.e. the AJ-Ribbon, and the S-Oscillator) will be helpful indicators of possible movement incoming; alternatively looking for divergence and hidden divergence of the P-Oscillator (set to RSI-mode) is also an effective strategy.
This oscillator set is suitable to be applied on any timeframes and on any charts.
This oscillator does not give precise price targets, but only offers a qualitative view of the present as well as the probable incoming price action.
To (attempt to) predict price targets, I personally use the PRISM Oscillator Set in conjunction a combination of various support & resistance analytical strategies: e.g. VPVR-levels, moving averages, trend-lines, Ichimoku Cloud, etc. and looking/waiting for sufficient candle closing and break-outs for confirmation, etc.
The PRISM Oscillator Set provide a momentum-focused perspective of the current market.
While my other script, Cyber Ensemble ( which generates buy/sell signals base on the scoring of a large ensemble of technical indicators + and modified by a series of filters ), provides a technical perspective of the current market; and which I frequently use conjunction with the PRISM Oscillator Set .
~ * ~ * ~ * ~ * ~ * ~ * ~ * ~ * ~ * ~ * ~ * ~ * ~ * ~ * ~ * ~ * ~ * ~ * ~ * ~ * ~
Note:
In no way is this intended as a financial/investment/trading advice. You are responsible for your own investment/trade decisions.
Please exercise your own judgement for your own trades base on your own risk-aversion level and goals as an investor or a trader. The use of OTHER indicators and analysis in conjunction (tailored to your own style of investing/trading) will help improve confidence of your analysis, for you to determine your own trade decisions.
~ * ~ * ~ * ~ * ~ * ~ * ~ * ~ * ~ * ~ * ~ * ~ * ~ * ~ * ~ * ~ * ~ * ~ * ~ * ~ * ~
Please PM me for access information.
© cybernetwork
Directional Movement OscillatorThe Directional Movement Oscillator (DMO) is an adaption to the Directional Movement Index (DMI).
The difference is that DMO is one line, whereas DMI has 3 lines: +DI,-DI, and ADX.
The DMO line calculation: DMO = (+DI) - (-DI)
I excluded the ADX in DMO because its completely useless.
Try this indicator out, good luck ;)
-racer8

ScalpyScalpy is made up of a 2 main parts.
- The cloud comprising of a 10 period SMA and a 30 period SMA.
- When the cloud is green you should be looking for long entries.
- When the cloud is red you should be looking for short entries.
- Price is most bullish above a green cloud and most bearish below a red cloud.
- Being within the cloud indicates indecision.
The blue and white lines on the indicator show the relationship between price and momentum.
They can be used to spot reversals in two ways:
- The first is a divergence between price (blue line) and RSI (white line)
- If the price makes a lower low but the RSI makes a higher low this shows the trend is weakening and may be reversing soon (as can be seen by the two yellow lines on the chart).
The second is a simple crossover:
- When the white line crosses the blue line to the upside this signals a long entry.
- When the white line crosses the blue line to the downside this signals a short entry.

HMA-Crossover AlertsThis simple script plots bullish and bearish Hull Moving Average Crossovers and fires Alerts when long or short conditions are met.

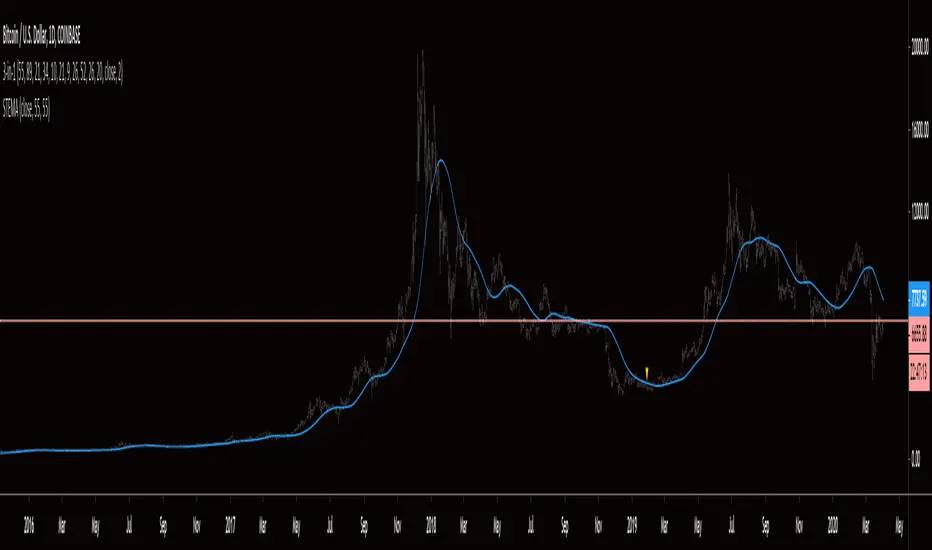
Smoothed Triple EMAThis indicator is exactly as it sounds, a smoothed triple EMA . In my personal use, it is applied to strategies to indicate direction of entries. A simple example would be if price is above the STEMA, look for long entries, if price is below the STEMA, look for short entries. Shortly, I will share a strategy that makes use of this indicator. You are welcome to message me if you have any questions. Thanks for checking it out an may the probabilities be with you!
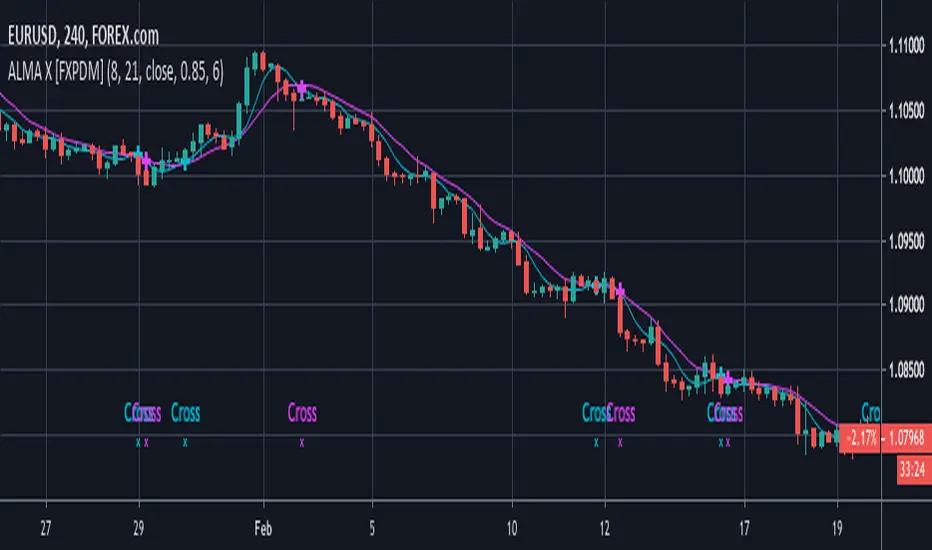
ALMA Crossover [FXPDM]
I created this new version of EMA crossing by replacing it with ALMA, Please take into consideration that the cross signal may occur during the candle. I advise waiting until the candle is close.
I used EMA crossing signals to adapt this code and turn it into an ( Arnaud Legoux Moving Average) ALMA Cross.
I expect it to bring a better signal that an EMA cross, let me know your comments and use under your own risk. this is just an experimental idea.
Long: Get into a long trade when the short moving average crosses up the long moving average.
Short: Get into a short trade when the short moving average crosses down the long moving average.
I recommend using it alongside a volume indicator to avoid sideways trends.
Exit at your own convenience or when the trend direction changes. I recommend using it in 4H and 1D charts.