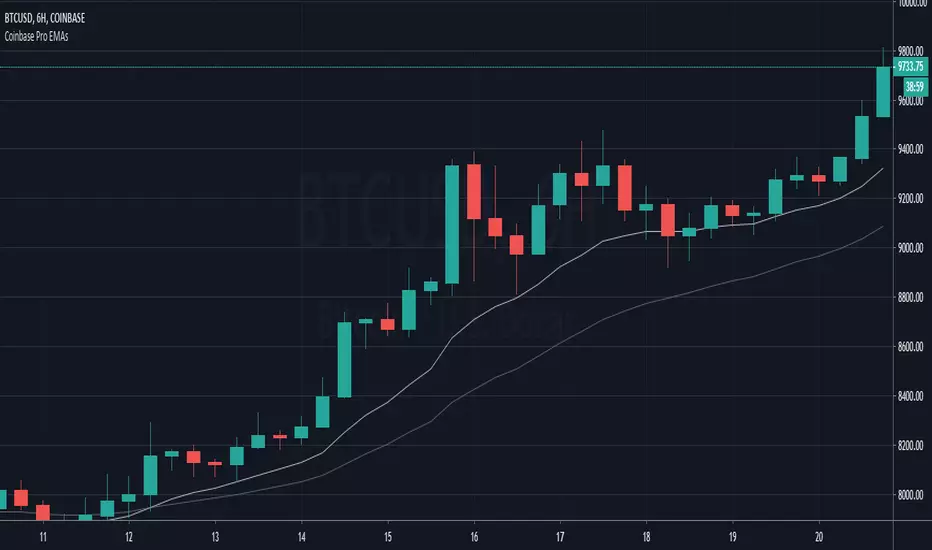
Coinbase Pro EMAsAn indicator to match the only overlays available on Coinbase Pro charts, the EMA12 and EMA26.
Crypto
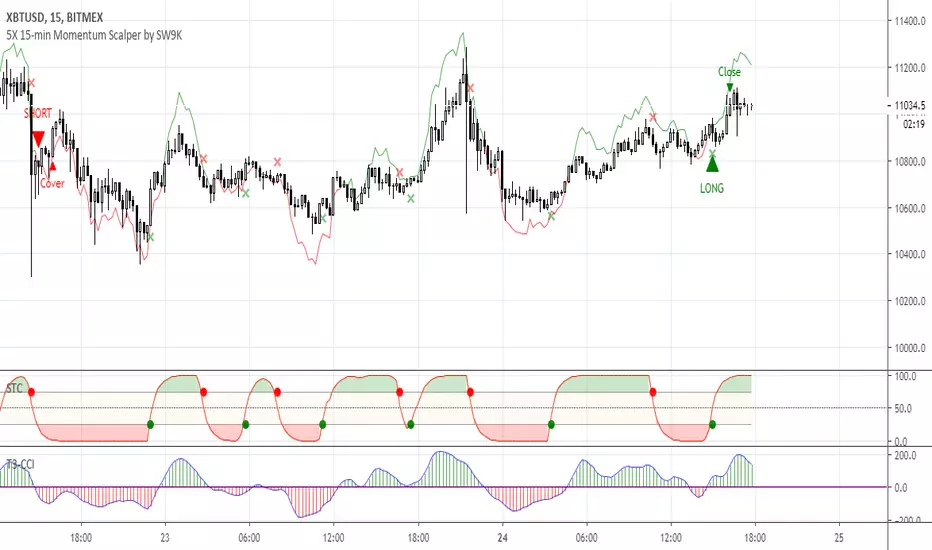
5X 15-min Momentum Scalper by SW9KThis is the alpha release-candidate study script with indicator alerts included. It is currently open for select individuals to test.
The core of this momentum scalper is primarily based on a modified Schaff Trend (which in itself is based on Stochastic elements and MACD) and a modified T3-CCI oscillator, specifically calibrated for 15-minute type movements -- do not apply to any other timeframes. Although it will take small scalps, it is designed to recognize when to ride out underwater positions so use maximum leverage or 5X or you may risk liquidation. Also, there is a stop loss setting feature, but it may reduce profits and win rate.
You can verify the highly accurate 75% win rate performance statistics with 100,000 XBTUSD contracts simulated at .
Features:
40% 3-month net profit, 74.48% win rate, 2.988 profit factor, 3.13% max drawdown, adjusted Sharpe ratio of ~3
Optimized for 15 minute timeframe scalping
Attempts to recognize when to keep position open and ride them out into profitable or breakeven
Profitable even with full Bitmex taker fees (0.075%)
Pyramiding Setting (default 3)
Aggressive Mode to increase entries and potential profits at higher risk
Easy-to-set binary Alerts
Follow SW9K at www.twitter.com
Bitcoin Golden Ratio Multiplier FibonacciA Script based on the wonderful article by Philip Swift (@PositiveCrypto) "The Golden Ratio Multiplier - Unlocking the mathematically organic nature of Bitcoin adoption"
Please read article for understanding use.
Best used on Daily

Helios - by @cryptomrdavis -
Helios is a simple to use oscillator.
It represent the state of different indicators at the moment. If you see a small green column, that means that only one or few indicators are getting into the positiv area, wait for higher bars to get into a trade. Same thing on the red bars side.
Calculation is based on few indicators like RSI , MACD , EMA , SMA and some more.
Happy trading
+++ use this tool on your own risk. i'm not responsible for your loses +++
Show some ❤
____________________________________________________________________________
BTC: 1GVRDK3HHr9CKM5SF2CGpCNXFuavB3L4j9
ETH: 0x7b825fa752b9926D3E8397cDb1d9E5473D074646
XMR: 41zL2SQS7zyZmwXKng2TeUWsMi5vMmkgSdDCjULUTvM6ichwm1E2ZDEYGt56zk9ghoM9bekhjycSwa8amtTcB2JiUet5jtg
NEO: AXja5xPDhczfm2ujHyBfpkQAAnMsXsazmb
ZEC: zcZzFkRx95cp7MtuW8wLhC5zz5RYF9QkT2uPPmhZZHc6ppXepHGgCSeAS1rtD6WFdqsM5p1gZm2gfirnrnviucsdP4aCpqU
XLM: GAXUQJSW55C7MAC4GI26NZUGIKSHFDVFRFKZCXPLMPY4HCADSDT55XK6
WAVES: 3PCMkNpMHxSraTCkwV1ENcBKa9sXbVCGjQX
BCH: qz57n04ud6mn42u00aymqkku8tfh0lk4jv9c28mjvv
____________________________________________________________________________
++++ cryptotradingresource.com ++++
____________________________________________________________________________

Gravity Swing Oscillator V1 - optimized for CryptoGravity Swing Oscillator V1 - optimized for Crypto
- Top & Bottoms
- Buy / Sell Signals on colorchanging LED Dots
- can show danger Price Dop Zones on Bars
Cyatophilum Altcoins Trader [ALERTSETUP]A generic Indicator built on Parabolic Stop And Reverse
Optimised for trading altcoins. Up to 8 automated alerts.
> > > READ HOW TO USE < < <
Get access to the Cyatophilum Indicators !

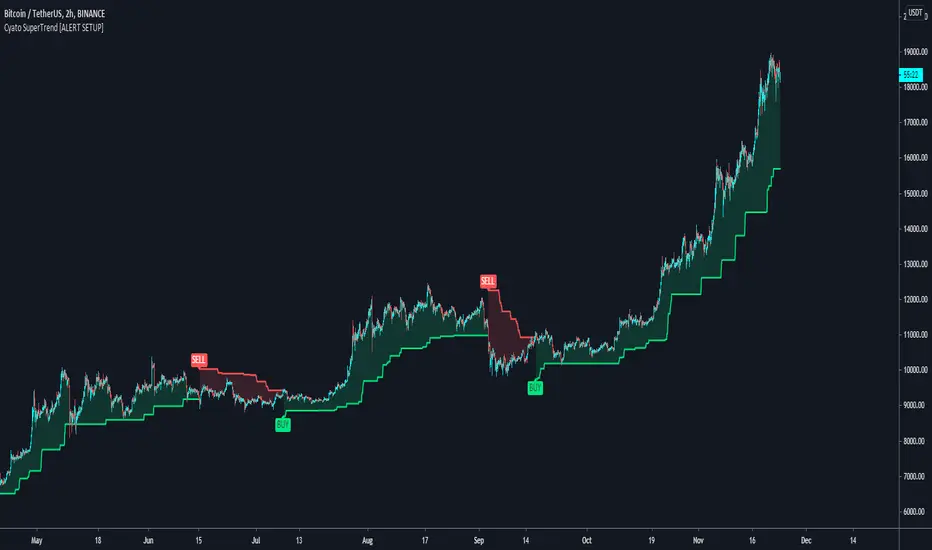
Cyatophilum SuperTrend [ALERT SETUP]Cyatophilum SuperTrend V1
A multi-timeframe indicator with Buy and Sell Alerts, built on ATR. (Averate True Range).
The SuperTrend line can be used as support when green, and resistance when red.
Reversals are strong buy/sell signals but perform badly in range markets.

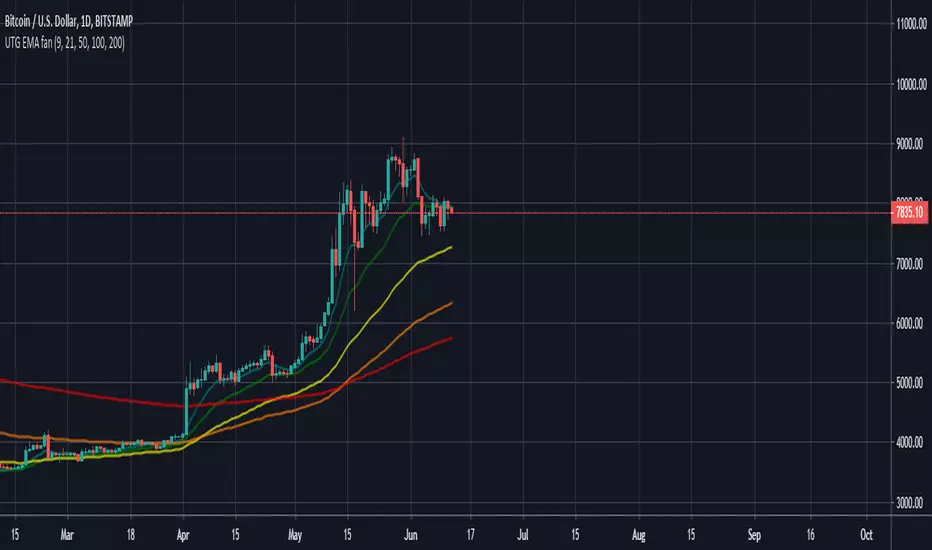
UTG EMA fanA basic EMA fan using the 9,21,50,100 and 200 period EMA.
Great for finding overall trend direction, major levels of support or resistance or early triggers to a potential trend reversal.
Values colors and sizes all customizable to suit your needs.
PpSignal Vortex Indicatorthis indicator is ideal for use in price action technique.
ii you are detect en down or up channel, support resistance, triangle, etc...you can use the vortex indicator for find a good signal.
Look the example picture.
www.mql5.com

Main Indicators @ MadnessCryptoInspired by veteran contributors of tradingview
Indicators list:
1. Main indicators: Moving average collection, Ichimoku, Bollinger Bands, fibonanci, simplize candlestick price action...
2. Price Action indicators: Candlesticks of (almost) any kinds. Harmonic Patterns: ABCD, Alt Bat, Butterfly, Crab, Wolf Wave, Head and Shoulders, Triangle...
3. Advanced indicators: top/bot finder, breakout detector, unpopular indicators
4. Signal & backtest tools: focus on two main factors: percent profitable & profit factor
Cheers,
Madness Crypto
-----------------------------------------------------------
Incase if those's scripts are useful, you can buy me a coffee
ETH & ERC20 tokens: 0xA2F57Cc46A5268F16A0224a81EDe7154218Ce890
Bitcoin: 1PTSbWK6snVSULBXhfx5TD9pJkkYCDe4PC
Binance & BEP2 tokens: bnb1tlxgpnguzq0w3w6myhd0t3d2j9wqd2pzpkudpc

Equilibrium - Strategy This is a straight forward strategy:
1. Buy at signal
2. Set stop-loss at red line
3. Sell at signal or when stop-loss triggers
Designed for 30min. crypto charts
Always backtest before use

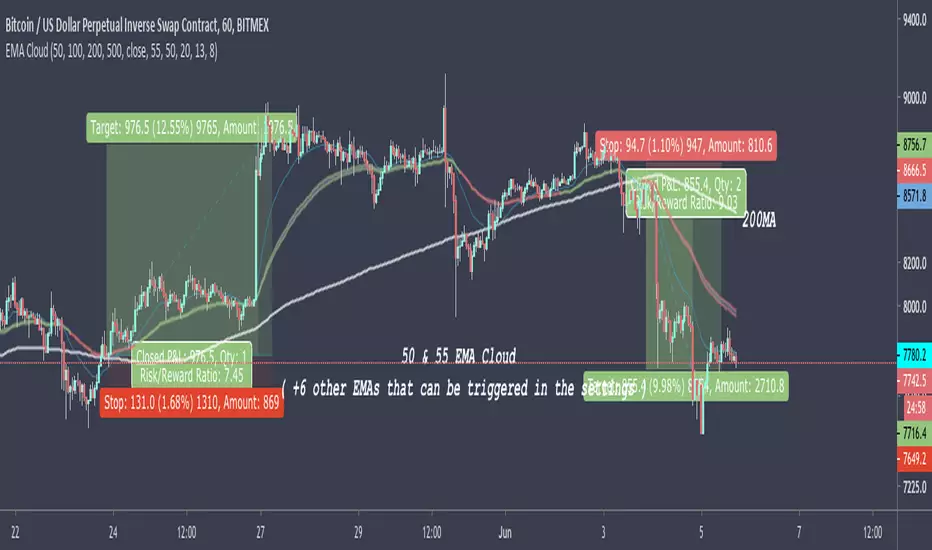
50 & 55 EMA CloudAfter testing thousands of indicators over the years, this simple EMA cloud indicator that I built is still my main weapon. It's always the first one I add to a blank charts and that is not going to change anytime soon.
I find EMAs and MAs are such underrated tools, By observing the price action surrounding these, I can see straight away if it's a good time to get into a trade or not.
As seen here, I also use the 200MA along with the 50/55EMA cloud to find extra strong support and resistances. If price starts to reject both the cloud and the 200MA at the same time/level, then it's a very good indication the price is going to make a big move in that direction as seen here in this chart.
PpSignal Stoch Jake Bernstein , Aroon, Ewo and T3 Velocityfour indicator in one, You can choice in option Stochastic Jake Bernstein Method, Aroon, Ewo or T3 Velocity

PpSignal twiggs_money_flowTwiggs Money Flow is my own derivation, based on the popular Chaikin Money Flow indicator, which is in turn derived from the Accumulation Distribution line. We are all indebted to Marc Chaikin and Larry Williams for the contribution they have made to the field of technical analysis and price-volume oscillators.
for more information visite: www.incrediblecharts.com

PpSignal Variable Move Average V 3.0VMA V 3 www.prorealcode.com
Variable Moving Average (VMA) ... Longer-term moving averages are slow to react to reversals in trend when prices move up and down over a long period of time. A Variable Moving Average regulates its sensitivity and lets it function better in any market conditions by using automatic regulation of the smoothing constant.

BOSS Bullish/Bearish Quantitative Qualitative Estimation (QQE)THE BEST FOREX, BINARY OPTIONS, AND CRYPTO INDICATORS FOR TRADINGVIEW.COM
This indicator is comprised by a smoothed Relative Strength Index and two trailing levels, based on volatility – Fast Trailing Level (Fast TL – the maroon line on the chart above) and Slow Trailing Level (Slow TL – the blue line on the chart above).
The two are determined by calculating the Average True Range (ATR) of the smoothed RSI during a specified number of periods, after which a further ATR smoothing is applied with the use of an additional n-periods Wilders smoothing function.
Ultimately, the RSI’s smoothed ATR is multiplied by the Fast and Slow ATR Multipliers in order to determine the final Fast and Slow Trailing Levels.
Trading the QQE buy and sell signals:
Buy Signal
Bullish crossover happens when Fast ATR TL crosses above Slow ATR TL. When this occurs a blue circle & blue candle will appear and a alert signal to buy is generated.
Sell Signal
Bearish crossover happens when Slow ATR TL crosses above Fast ATR TL. When this occurs a maroon circle & maroon candle will appear and a alert signal to sell is generated.
Bullish/Bearish Divergence Background
Green background indicates Bullish Divergence
Red background indicates Bearish Divergence
Overbought and Oversold Conditions
An overbought condition occurs, when the QQE is at or above its 0.10 level.
An oversold condition occurs, when the QQE is at or below its -.10 level.

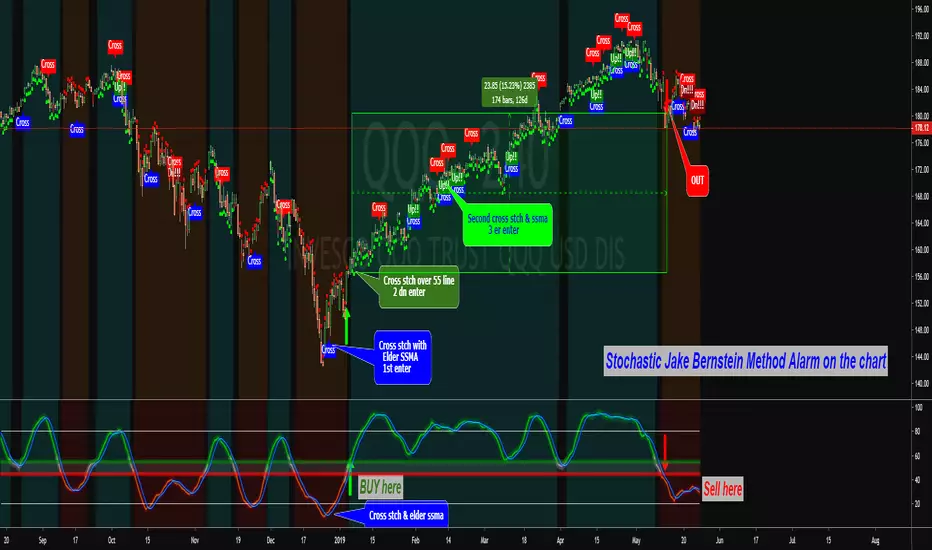
PpSignal Stochastic Jake Bernstein Method V 1.0 ALARM VERSIONAmazing Jake Bernstein Stochastic .
Buy when the price is above 55 and sell when the price is below 45.
Have MTF option.
For more information please visit stockcharts.com
BOSS Smooth Stochastic RSI Histogram Oscillator With Alerts THE BEST FOREX, BINARY OPTIONS, AND CRYPTO INDICATORS FOR TRADINGVIEW.COM
Our smooth stochastic rsi in column form with buy and sell alerts.

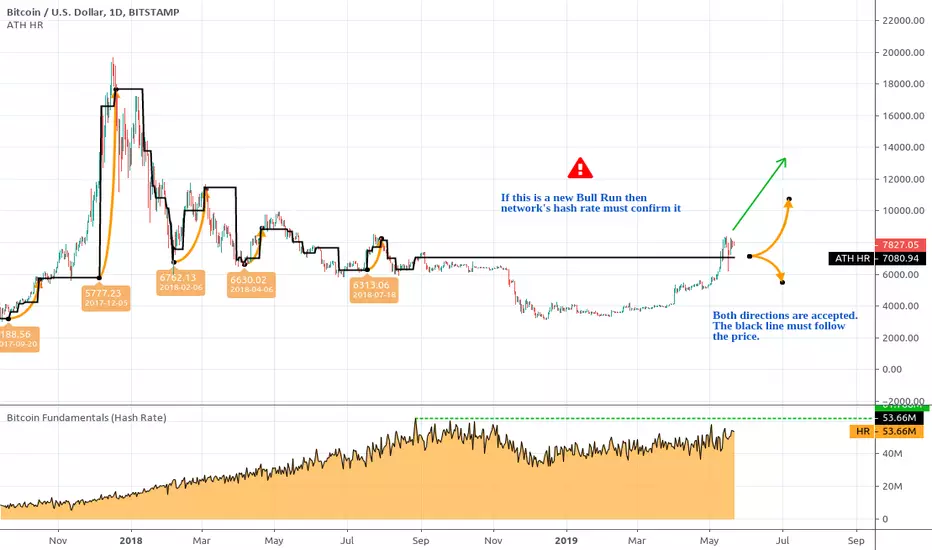
Bitcoin All-Time High (ATH) Hash Rate Level An experimental Bitcoin TotheMoon confirmation tool. Represents a mapping of Bitcoin's All-Time Hash Rate to the corresponding Bitcoin's price on the chart.
As always, you can support the author with donations via PayPal or crypto.
PpSignal Random Walk Monte Carlo MethodRandom Walk Utility
The random walk generator allows users of the Monte Carlo to further understand how the Monte Carlo projection is generated by creating a visual representation of individual random walks. Trends that occur on the random walks may correlate to the historical price action of the underlying security.
Understanding the Random Walk Simulation
This indicator randomly generates alternative price outcomes derived from the price movements of the underlying security. Monte Carlo methods rely on repeated random sampling to create a data set that has the same characteristics as the sample source, representing examples of alternate outcomes. The data set created using random sampling is called a “random walk”.
First, every bar in the time stamp is measured logarithmically and put into a population.
Then, a sample is drawn at random from the population and is used to determine the next price movement of the random walk. This process is repeated fifteen times to visualize whether the alternative outcomes lie above or beneath the current market price of the security.

Smart Target Introduction
This is the first forward-looking indicator on TradingView!
A normal moving average indicator will use two averages of differing lengths, referred to as “fast and slow” or “short and long” moving averages, to identify trends and potential trades.
The Smart Target indicator uses the average trade profitability and trade duration of a moving average strategy to determine a forward-looking target that is specific to the chart that it has been applied to.
Every historical trade is considered when the indicator determines the future price target of an asset and the accuracy will improve with time as new trade data is continually introduced.
Indicator Utility
If the fast-moving average crosses above the slow, a blue target will appear.
A red target will appear when the fast-moving average crosses below the slow.
The target will never change once it has been plotted and will not repaint in any way which means that it is fully functional for trading in real-time.
Input Values
The period length of the two moving averages will need to be determined by the user and can be changed in the indicator settings panel.
View the full documentation on this indicator at this link: www.kenzing.com

BOSS Zero-Lag Dynamic MACDTHE BEST FOREX, BINARY OPTIONS, AND CRYPTO INDICATORS FOR TRADINGVIEW.COM
Our MACD is a Zero-Lag (well near zero-lag) We make this claim because MACD utilizes Moving Averages and as you know moving averages are lagging indicators.
For our MACD we utilize The McGinley Dynamic which looks like a moving average line yet it is a smoothing mechanism for prices that turns out to track far better than any moving average.
The McGinley Dynamic minimizes price separation, price whipsaws and hugs prices much more closely.
The McGinley Dynamic does this automatically as this is a factor of the formula.
Because of the calculation, the Dynamic Line speeds up in down markets as it follows prices yet moves more slowly in up markets.
As traders we want to be quick to sell in a down market, yet ride an up market as long as possible.
Source: Investopedia.com
Chart Image shows conventional MACD on Bottom and BOSS Zero-Lag Dynamic MACD on top
Available at: bosscripts.com
