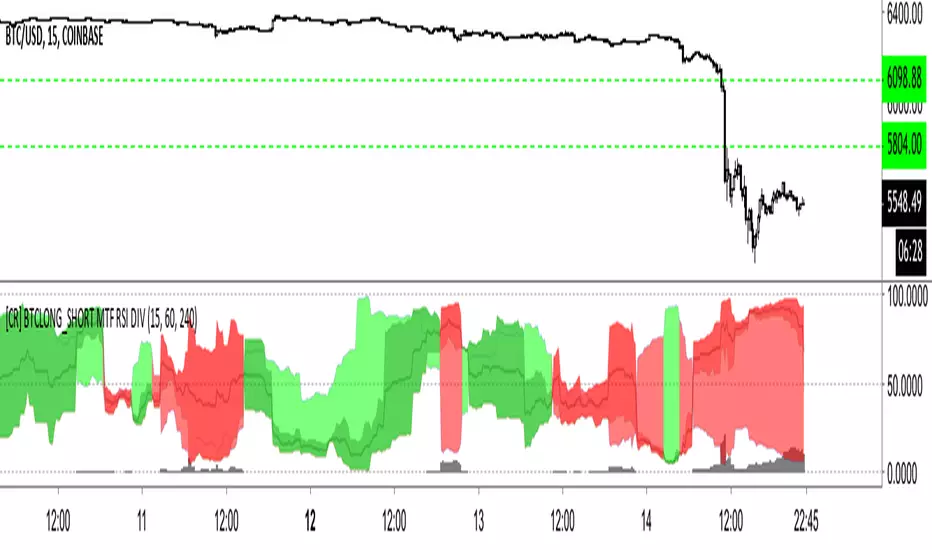
[CR] BTCLONG_SHORT MTF RSI DIV+ MTF x 3 BTCSHORT and BTCLONG on BITFINEX RSI
+ SHORT vs LONG RSI + Difference
This indicator demonstrates the difference between BTCLONG and BTCSHORT values on BITFINEX and compares their relative difference also in RSI.
Red = SHORT > LONG
Lime Over Green = LONG > SHORT difference RSI greater than LONG vs SHORT RSI.
Red Over Darker Red = SHORT > LONG difference RSI greater than SHORT vs LONG RSI.
Black trend line = Total SHORT/LONG RSI
Grey Columns = Total RSI / Difference RSI
Crypto
Bitfinex Margin ΔShows long/short position changes per chart period
Works for all Bitfinex margin pairs
Red = Short Open
Yellow = Long Close
Cyan = Short Close
Green = Long Open
Bitfinex Longs/Shorts Ratio AlertableThis script contains Bitfinex longs/short ratio and generates alarms with a given input .default value is 60 which means alerts when either shorts/longs reach 60:40 ratio

Ninja EMA Cross 5/8/13This is a short term EMA cross which is used primarily used for the 1HR chart and below perfect for highly volatile markets . Color coded for clear signals and easy to read crossovers strategy. I recommended for crypto currency trading or high volatility markets.
Green over Red= Buy Signal
Red over Green= Sell Signal
Green over White= Uptrend
Red under White= Downtrend

PpSignal Composite Fractal Behavior (CFB)CFB tells you how long the market has been in a quality trend. This value can be used to adjust the period length of other indicators, especially stochastic bands.In order to quantify the overall duration of a market's trend, we replaced classical cycle analysis methods (FFT, MEM, MESA) with a form of analysis that works even when no cycles exist. We accomplished this by examining a time series for specific fractal patterns of any size. We then gather all the patterns found and combine them into one overall index, CFB (Composite Fractal Behavior) Index.For good reason, CFB does not analyze time series data for dominant cycles. Classical cycle analysis examines data points (e.g. prices) and estimates the average presence of a cycle in the window. Now suppose a cycle with a period length of 9 days was strong for 50 days and then disappeared for the next 21 days

Crypto Correlations HeatmapHello friends,
This tool is designed for crypto traders who want a fast, visual way to understand how different coins move relative to each other. It builds a correlation heatmap between your current chart symbol and a customizable list of crypto pairs, helping you immediately see which assets tend to move together, move opposite, or behave independently.
🛠️ How It Works
You provide a comma-separated watchlist of cryptocurrency tickers (for example, a list of USDT or USD-margined pairs). The script then:
Filters this list using your chosen Display Mode - All pairs, or only BTC, ETH, USDT, or USDC-related pairs.
Splits long watchlists into pages of up to 40 tickers , so you can smoothly navigate large universes of coins using the page selector.
For each symbol on the active page, it calculates the Pearson correlation over a user-defined lookback period, based on your selected Correlation Source (close, alternative price averages, or other supported inputs via the custom source module).
The results are rendered as a color-coded heatmap: color and intensity reflect both the strength and direction of correlation with your chart symbol.
You can switch between multiple professional color palettes to fine-tune how positive, negative, and neutral correlations are visually separated on the chart.
🔥 Key Features
Custom watchlist input via a simple text area (paste long lists directly from your exchange or screener)
Pagination support - view up to 40 tickers per page for stable performance
Flexible Display Modes : All pairs, BTC pairs, ETH pairs, USDT pairs, USDC pairs
Adjustable correlation lookback length
Advanced correlation source selector via the custom source module
Multiple color palettes : Blue/Red, Blue/White/Red, Green/Pink, Green/Red, Green/Yellow/Red, Purple/Orange, Spectral, Viridis
Clear visual mapping of correlation strength and sign using color intensity and hue
👋 Good luck and happy trading!


Hades Indicator by ZekisHades Indicator is a good swing indicator based on trends
The base of Hades Indicator is calculated from crossing of two moving averages to establish the trend and another two moving averages for entries and exits or longs and shorts.
The rules are simple: go long when background turns green and exit when turns yellow and go short when backgroun turns red and exit when turns yellow
When background is yellow is not a good idea to jump in
There are 5 moving averages to choose from: DEMA, EMA, SMA, VWMA and WMA
Also you can choose to trade only for Longs, only for Shorts or both
Alerts are added
Enjoy!
@ Zekis

Quantum All in One Crypto Indicator V1Quantum All in One Crypto Indicator V1
Features
6 EMA
6 MA + Slow & Fast
Ichimoku
Bollinger
Fractals
CDC Strategy
Colored Bars
Pivot´s and more..
have fun
Version V1.5 in Progress
Trend Precognition - Mtrl_Scientist (arrow-only)Hey everybody,
Per request, I'm also adding the arrow-version to the updated base algorithm.
However, I advise everyone to also add the indicator version that I published previously.

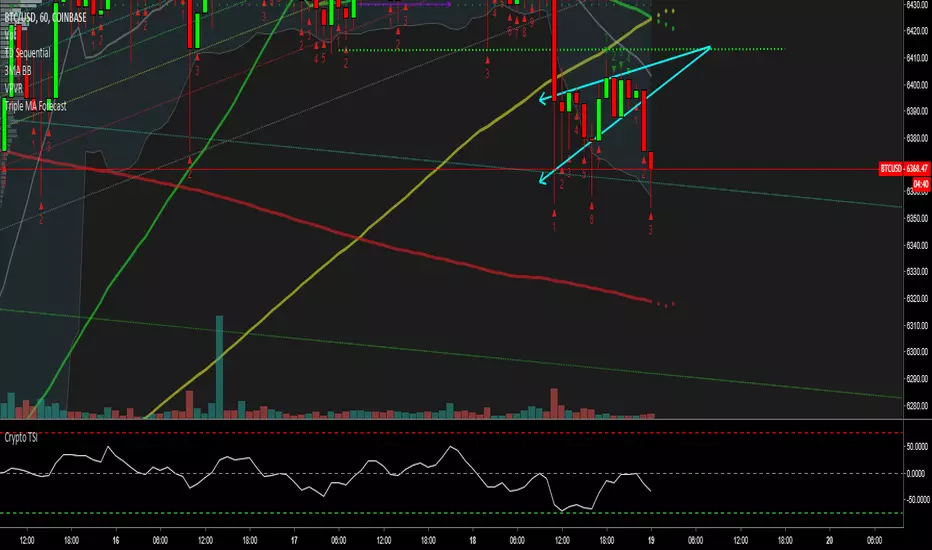
Trend Precognition - Mtrl_ScientistHi everyone,
This is an updated version of my base algorithm "BTC Precognition". I've managed to remove some lag, while at the same time smoothing the curve (blue).
All you need to know about it is on the chart's legend. The arrows just correspond to the bottoms/tops of the blue signal curve (marked with green/red circles). However, predicting turning points is difficult and I'm still working on that. So for now, the signals are offset by 1 candle into the past. This means that all of your trades will be 1 candle late, unless you trade intrabar using your own intuition. As a help, I've also included the first derivative (black curve) that will tell you the slope of the blue curve. Remember, when the curve is about to turn, the slope becomes zero. However, you can anticipate this by looking at the slope's direction and guessing when it will cross the zero line.
This is still all work in progress, so invite-only.


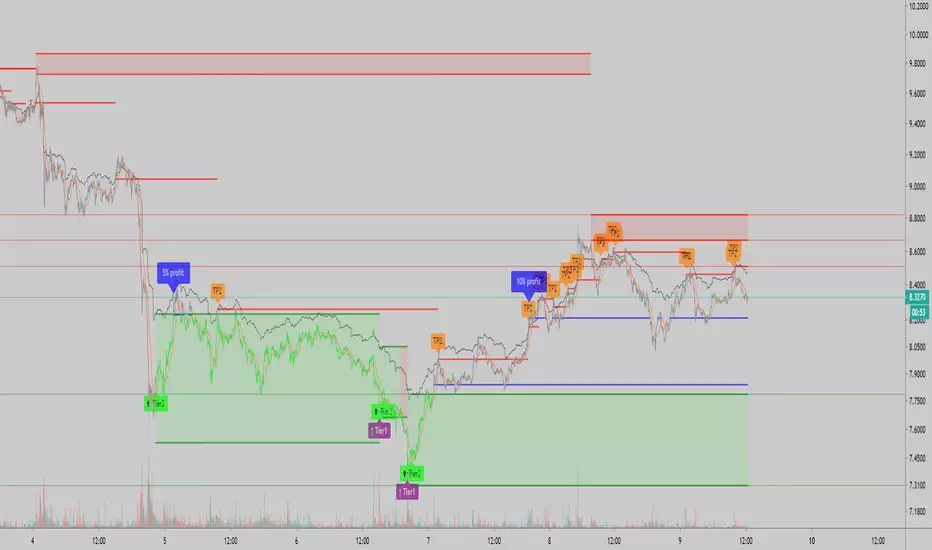
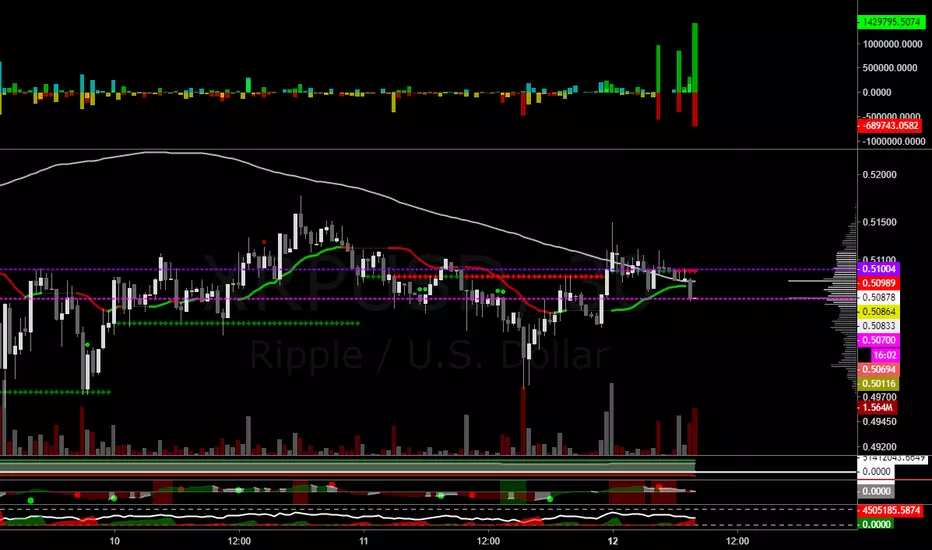
5e_ CaptainBB w/mo-Alertswith the setups of bollinger and cap bands alongside multiple oscialltor alerts we can see how the mixture of the 3 work on the 2h ethereum chart.
basic rule is if the trend breaches the bollinger and cap band and the oscialltors agree then it is a buy/sell opportunity depending on where the break is made (upper would be sell, lower would be buy).
a cross over of the mid bband (21 ema ) below the mid cap band suggests the trend is negative = short, likewise a cross above the mid cap band suggests the trend is positive = long
watch for rejection around the mid bands area and be prepared to cut long/short early if rejection is seen.
best way to enter the trade is on confirmation and waiting for the price to find support inside the bands, fibonnaci will aid this too.
last tip is to use the daily pivot ; P, R and S to gauge knife catches, targets etc.
be wary on lower time-frames as signals will paint correctly but could be short lived on the chart (and fail without SL or TP).
used with heikin ashi will produce more signals.
using bars will produce the signals shown and color code the trend the best - authors favourite.
candles have same view as bars only colours seem weird.
^^up to you.
FYI bollinger basis is 21ma (not standard 20).
adjust colors to suit and reduce noise. for example dim the vertical bars as they are more for intra-channel scalping
//credit to ChartArt, CapnOscar and Hinco01 for their coding//

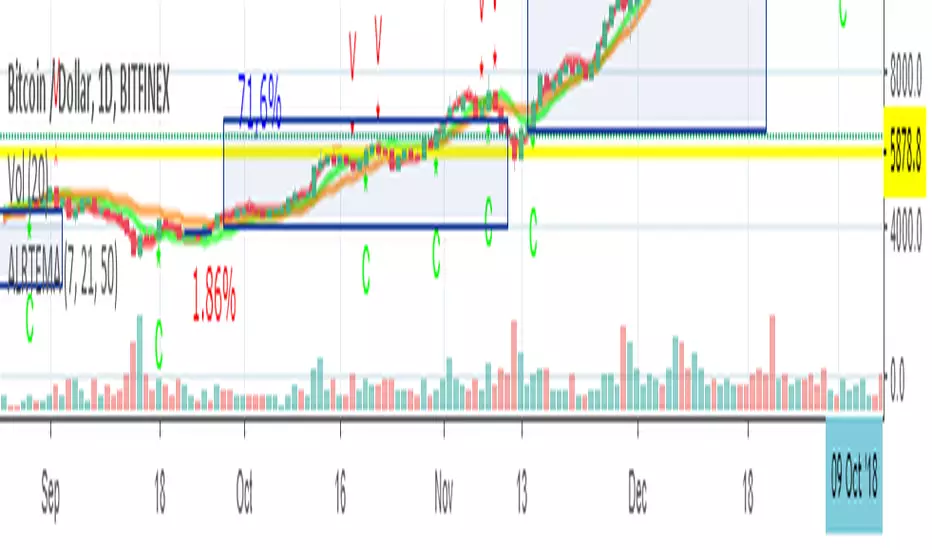
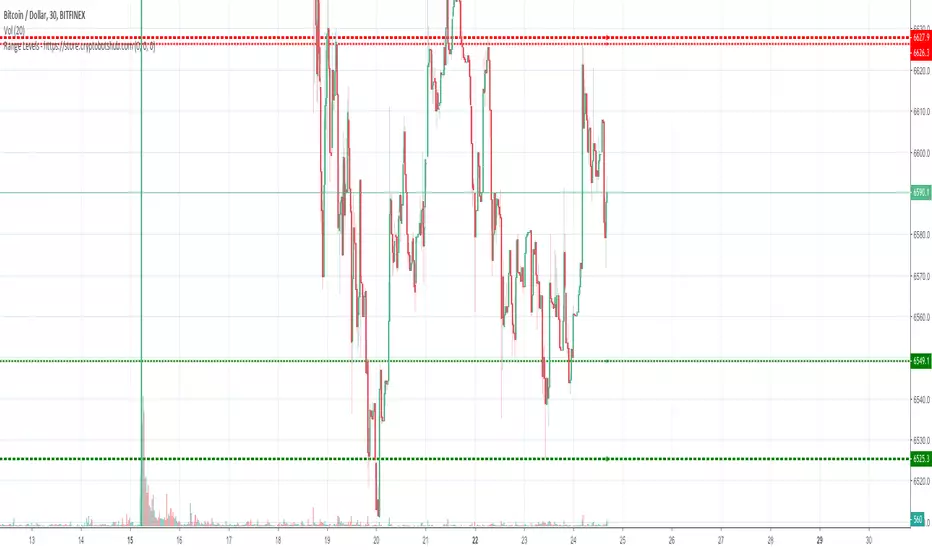
Range Levels - High and Low of Daily, Weekly, and Montly RangesThis is a great free script for the current ranging crypto markets.
You can see the daily, weekly, and monthly high and low of ranges. It also has alerts that you can enable in the settings and then setup in your TradingView alerts for when the price crosses these levels.
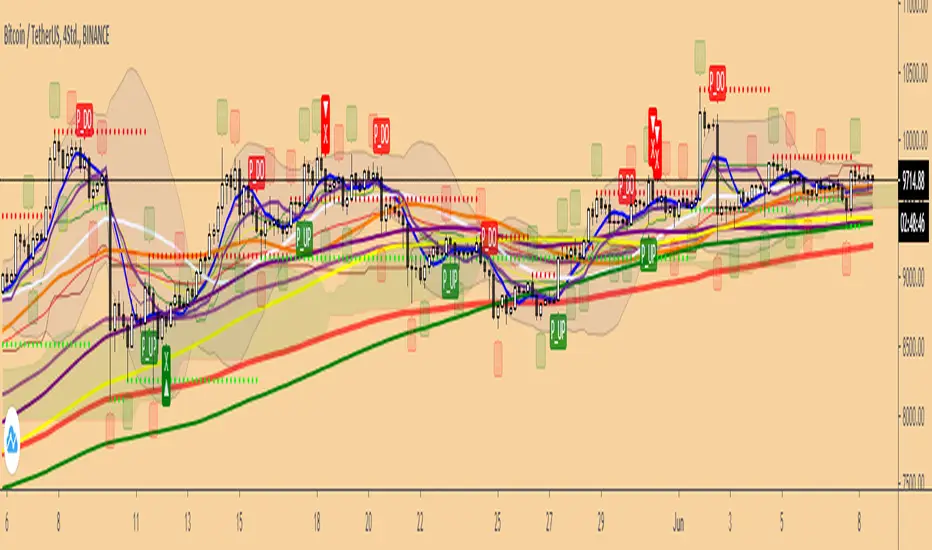
BTC Precognition - Mtrl_Scientist (Multi Time-Frame)Hi everyone,
This indicator is also based on the "BTC Precognition" algorithm, only this time, I've visualized the results on all time frames (1min, 5min, 15min,...,1W). It is supposed to give you confidence in the signals the algorithm already offers.
How it works:
The top blocks are the shorter time frames, whereas the bottom blocks are the longer time frames. As you can see, the signals gradually leak into the longer time frames when a trend is confirmed.
I'm still trying to find patterns, but the most obvious to me was that the best entry is signaled when most blocks of the same color are stacked (marked on chart).
Very good buy signals are often 7-8 green blocks (out of 10) in a row, whereas very good exit signals are 10/10 red blocks.
Note: For best results use Heikin Ashi.
This is still very much work-in-progress, so I'm only publishing it as a private build.
PM me if you want to help test and improve it.
P.S.
As it is with Trading View, accessing higher time frames can lead to repainting. After a lengthy debugging process, it looks like I fixed the repainting issue for higher time frames. However, now there's an issue with skewed calculations on the current time frame (selected time frame == block time frame), that I've only solved for the 1min chart so far (should be possible to fix on all). So please just keep that in mind. As it is now, I'd say everything is correctly displayed on the 1min chart only! You can verify this by refreshing the page and checking if any blocks changed. If they didn't, there's no repaint.