Green to Red Money RailsWhat this indicator does
Green to Red Money Rails (G2R Rails) is a price-action tool that draws dynamic “rails” from recent swing lows and highs. It tracks how support and resistance are shifting so you can see where trend pressure is building or weakening.
Core logic (high level)
Detects pivot lows and stores the last three (L1, L2, L3).
Builds green support “fans”: inner dotted rails L1→L2 and L2→L3, plus a main solid base rail L1→L3.
Detects pivot highs and, when the last high is lower than the previous one, draws a red resistance rail from H2→H3.
Optional labels mark the most recent swing low (“L”) and swing high (“H”).
How to use it
Use the green rails as dynamic support zones for trend-following, pullback entries, or stop placement.
Use the red rail as a visual ceiling in downtrends: breaks above it can signal the end of a sell-off; rejections at it confirm sellers still in control.
Works best on liquid markets and swing-trading timeframes (for example, 1h–1D). Always combine with your own risk management and higher-timeframe context.
This script does not auto-generate signals or manage risk for you; it is a visual framework for reading structure and building your own trading plans.
Cryptotrader

Coin & market cap tableThis table was built specifically for the Crypto market.
It gives you a quick overview of the markets without having to scroll through numerous charts. The information is the overall markets daily change and the charts coins movement on a daily, weekly and monthly basis.
The weeks start on a Monday morning, the months start on the 1st of the month so this is last weeks data and last calendar months data.
It also gives you Bitcoins dominance. (Total2) you can change it to Bitcoin & Ethereum dominance (Total3)

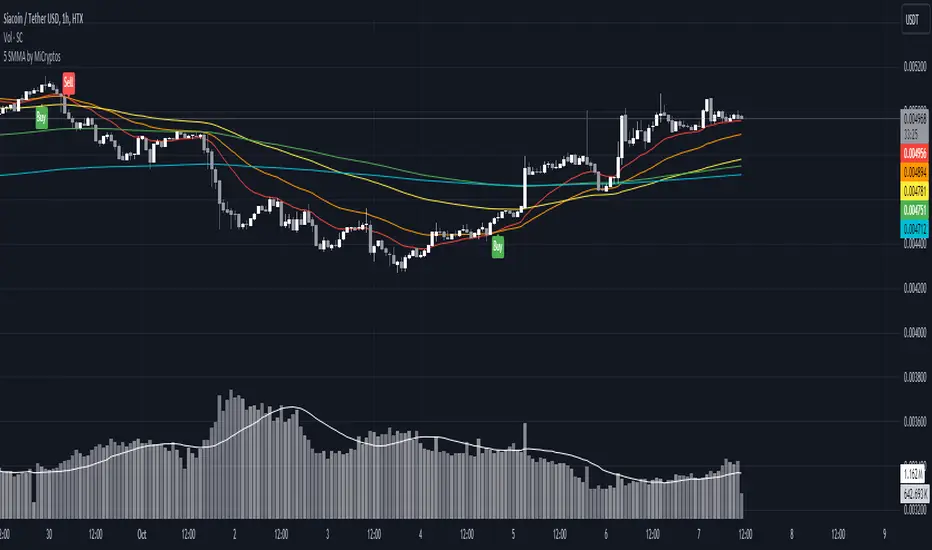
5 SMMA - by MiCryptoGives you the 5 most common SMMA for crypto in day trading:
- 10
- 21
- 50
- 100
- 200
This can be configured as you want.
Hope this can help you to get more indicators in a free plan.
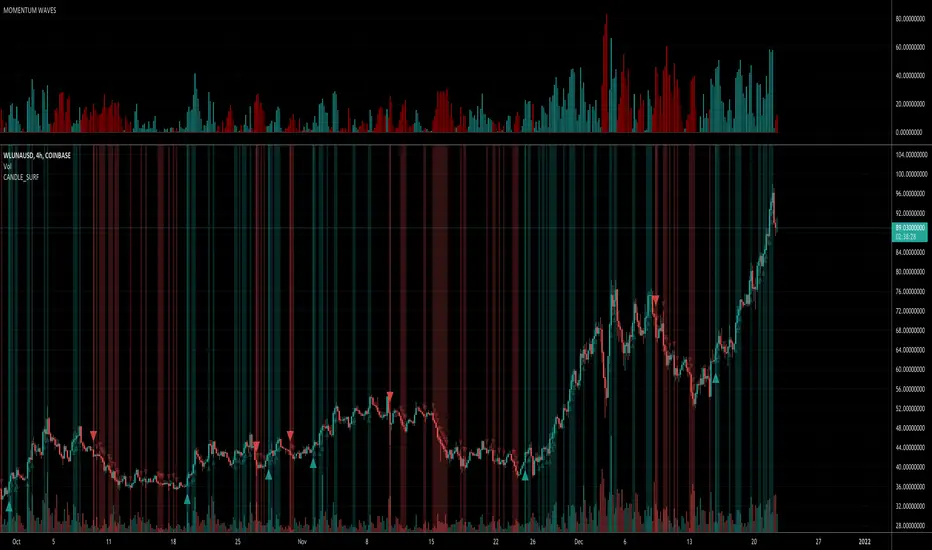
Candle Surf SignalThis script works very well for all assets across various timeframe charts. Good for use with scalping, long term swings, or in combination with multi-timeframe trading.
Surf the candles!
Zeta CryptoAre you excited about Crypto Trading?
Crypto Trading is gaining immense popularity due to the excitement and returns it gives.
However, traditional indicators based upon lagging factors which generate Buy/Sell signals very late can not be used with crypto-trading.
The need of the hour is to create an indicator from ground up which reacts instantly when the price action starts and gives you much earlier entry or exit as compared to traditional lagging indicators.
Zeta Crypto is one such indicator which is based upon price cum volume action. It is said that "volume precedes price" or 'volume must validate the price move" and it is true in most of the situations.
Zeta Crypto tracks price and volume for you and keeps comparing it with historical data and as soon as it detects spikes, it gets into action and generates Buy/Sell signals right on your chart.
How to take Entry and When to Exit?
As soon as you see a Buy/Sell Signal on a candle, mark its closing price and if next or any subsequent candle opens and starts going in the same direction and clears the closing price of signal candle (where Buy/Sell signal is printed), Enter the trade and trail it till either (1) Opposite signal does not come or (2) Your Trailing Stop Loss is hit or (3) Till price again comes back to your Entry Level and starts hurting your position.
What Time Frame to use?
Do not use less than 5 min. Time Frame for this indicator. The best results are seen at 5 min., 10 min. 15 min. & 30 min. time frames. Higher time frames will give you delayed entry and lower than 5 min. will be too volatile.
What is the purpose of Support/Resistance Lines appearing on your chart?
These lines might offer you early entry or exit when the price approaches a Resistance or Support line.

ParaEyeThis indicator compares the movement of a longer term moving average with the difference of a shorter term moving average minus a longer term moving average. The indicator uses standard deviation enabling it to focus on just change/variance overtime. This aspect will allow ParaEye the ability to survive the test of time and continue to produce reliable insights into the future. One essential takeaway you must be aware of though is the ParaEye is only able to provide insight into parabolic movements in price that occur on a log price chart. However, there is a hidden golden aspect to this indicator though that is universal and able to provide insights not only into parabolic movements but others still across many asset classes. I will be sharing that sometime in the future.

Crypto Breakout Alert DEMOThe indicator plots breakout events of user-defined assets list, providing alert setting for breakout events.
Any big trend begins with a couple of price breakouts. By watching breakout events, we overlook the panorama of the whole market.
Version: DEMO
---------- Features --------------
User-Defined Crypto / or any Asset List, Up To 30 Assets, Demo has some limit
User-Defined Breakout Threshold
Accessible for wide timeframes: 5s - 1 Month, Demo has some limit
Plot the Breakouts History of whole market
Progressive color according to the strength of the breakthrough
--------- Indicator Settings -----------
"Show Bull or Bear?": To show Bull Breakout, Bear Breakout or Both
"User-Defined Breakout Threshold": User can defined the threshold of breakout, default value 999 means using default set up, as following - "Default Breakout Threshold"
"A rate to decrease Bitcoin Threshold": Bitcoin has much lower volatility than other coins, so this rate is usded to lower the threshold for Bitcoin , defval = 0.5
"Use Green for Bull? ": Toggle color for Bull, defval: true, if your region use red for bull, toggle it.
"Exchange": Your exchange name, which is used to defined tickerid, defval="BINANCE", optional - can be empty
"Asset PostFix": postfix of your asset symbol, which is used to define tickerid, defval="USDTP", change it if necessary, this can not be empty.
"Toggle Notice Label": close or open the notice label
--------- Default Breakout Threshold For Popular Timeframes-------------
5s 0.5%
15s 0.75%
30s 0.9%
1m 1.2%
2m 1.4%
3m 1.6%
5m 1.8%
8m 2%
15m 3%
20m 3.5%
30m 4%
60m 5%
120m 6.5%
240m 8%
480m 10%
1D 12%
1W 20%
---------- Versions Description ----------
The features may change later without advance notice.
DEMO version has basic features.
---------- Access to Indicators ----------
Contact the author by Private Chat for access to Invite-Only versions and a trial.
---------- Install Invite Only Version----------
Open the chart -> Add Indicators (On the Top or press /) -> Invite-Only Scripts (last button of the left bar)
Like/Favorite the indicator
Click to install on the chart
---------- About Loading Time ----------
It may take up to 1-3 minutes for your browser to load a new setting, depending on the your computer and network speed. For convenience, you can keep related pages open continuously.
---------- FAQ -----------
1. Why can't I see older breakout labels?
Due to system limit, 500 is the maximum of labels.
In order to see older breakout events, please Select Bull or Bear, instead of Both; Or Increase to filter weak breakouts.
2. How to watch more than 30 coins?
Due to system limit, 30 assets is the maximum.
In order to watch more assets, user can open the indicator in another chart, add your 2nd assets list, save 2nd layout, set alerts for different lists respectively.
---------- Disclaimer ----------
By using or requesting access to the indicator, you acknowledge that you have read and accepted that the indicator and any related content, including but not limited to: user manual, tutorials, ideas, videos, chats, emails, blog, are for the purpose of trading strategies studying and paper trading.
If a customer or user uses the indicator or related content mentioned above for live trading or investment, she/he should take all risks and responsibility of her/his own trading and investment activities.
---------- Updates ----------
The latest updates override the previous description.
To activate a update: Close the browser, Reopen the chart and apply the indicator.
【加密货币突破预警】指标绘制一系列资产的突破事件,提供突破预警
任何大趋势都开始于一系列的价格突破。通过监控突破事件,可以俯瞰市場的運動
版本 DEMO
---------- 产品特征------------
用户自定义的加密货币品种列表,或者其他资产列表,多达30个品种, DEMO 有限品种
用户自定义的突破门槛
适用于宽泛的时间维度:5秒--1月, DEMO 有限制
绘制整个市场的突破历史
漸進顏色 根據突破的力度
------------- 指标设置说明 -------------------
"展示牛熊突破?": 展示牛突破,熊突破或者两者
“用户自定义突破门槛”: 自己定义突破门槛,999代表默认的设置,详见下方“默认的突破门槛”
"比特币突破门槛修正": 比特币的波动性远远低于其他加密货币,这个比率用来调低比特币的门槛
"切换通知标签": 用来开关通知标签
"綠色為牛?": 切換標籤顏色,默認綠色為牛
“交易所”:用来定义资产名称,可以为空
“资产后缀”: 用来定义资产名称,不可以为空
---------默認的突破門檻-------------
5s 0.5%
15s 0.75%
30s 0.9%
1m 1.2%
2m 1.4%
3m 1.6%
5m 1.8%
8m 2%
15m 3%
20m 3.5%
30m 4%
60m 5%
120m 6.5%
240m 8%
480m 10%
1D 12%
1W 20%
---------- 版本描述 ----------------
產品特徵後續可能變化,恕不事先通知
DEMO版本供試用
----------- 獲取指標使用權 ------------
通過私信聯繫作者,要求訂閱或試用
----------- 安裝指標 -----------------
加指標 -》 Invite-Only (左邊欄目)
點贊或者收藏指標
點擊安裝指標
----------- 關於載入時間 ---------------
可能需要1--3分鐘來完成載入,取決於用戶的電腦和網絡速度,方便起見可以保持相關頁面持續開啟
------- FAQ ----------
1. 如何查看更早的突破歷史
由於系統限制,500 個標籤是上限
為了查看更早的突破,請選擇牛或者熊,而不是兩者;或者提高"用戶自定義突破門檻" 來過濾掉弱突破
2. 如何監控更多資產?
由於系統限制,30個資產是上限
為了監控更多資產,可以在第二個圖表加載指標,保存圖表,分別在不同的圖表設置突破預警
---------- 免責聲明 ----------
在要求獲得本指標使用權之前以及在使用本指標之前,用戶認可已經完全了解和接受:本指標僅供學習交流目的, 它不構成任何交易建議或者投資建議。用戶如果將指標用於其他用途,應自行承擔所有風險和責任。
本指標的開發者並非專業投資顧問,因此不對用戶的任何行为負責。
最近的更新會覆蓋之前的說明。請參閱更新來查看指標的新特徵和功能。

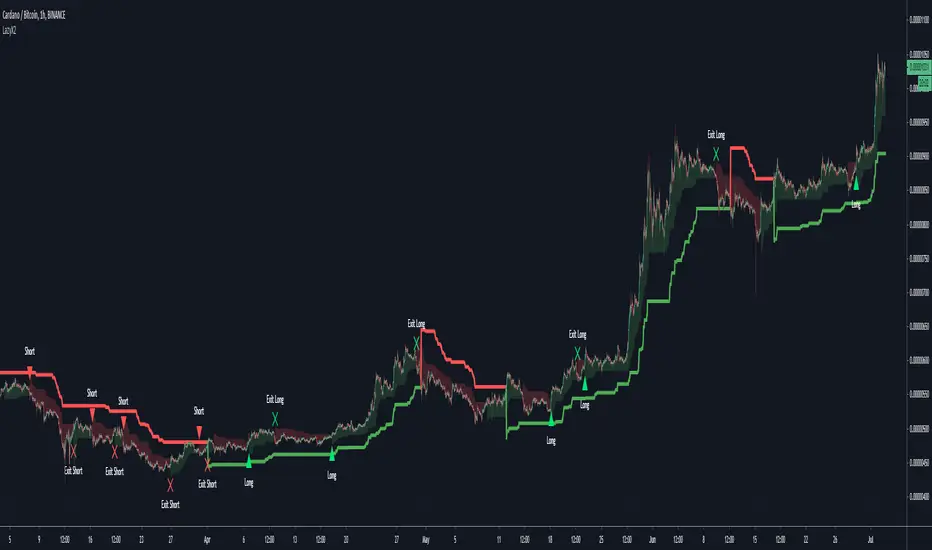
LazyX2We released LazyTrader all the way back in Aug of 2018, and it's still popular to this day among members, especially for those setting up trend trading bots.
LazyX2 uses the same algorithm, but has evolved into an alternative version with a second copy built in so that one is used as the long term trend and the other as the short term trend.
There are a couple of entry strategies to choose from, but over all LazyX2 allows you to fine tune even further than the original and reduce your strategies drawdown.
A couple of us have been testing this for a little while now so I'm happy to be able to finally release it to the world!
As always, for information on how to gain access please check the links below or on our profile page.
MaverickWelcome to the Maverick.
How to use: Apply to any chart, on any time frame. You will see BULL and BEAR signals on the chart. A BULL signal represents an entry/buy in, and a BEAR represents an exit/ sell.
You can use the Maverick to scalp on low time frames such as the 5m, 15m, 30m etc. Or use the Maverick on higher time frames such as the 1hr, 2hr, 4hr.
You can use regular candles but Heikin Ashi are recommended for better accuracy.
When using Heikin Ashi, I have included a real price line which shows the actual price of the asset/chart at the close of each candle.
Settings alerts: You can easily set buy/sell alerts by selecting Maverick in the set alerts tab and selecting Bull for buy alerts and BEAR for sell alerts.
To gain access to this INVITE ONLY script, please join the discord for a free trial: discord.gg

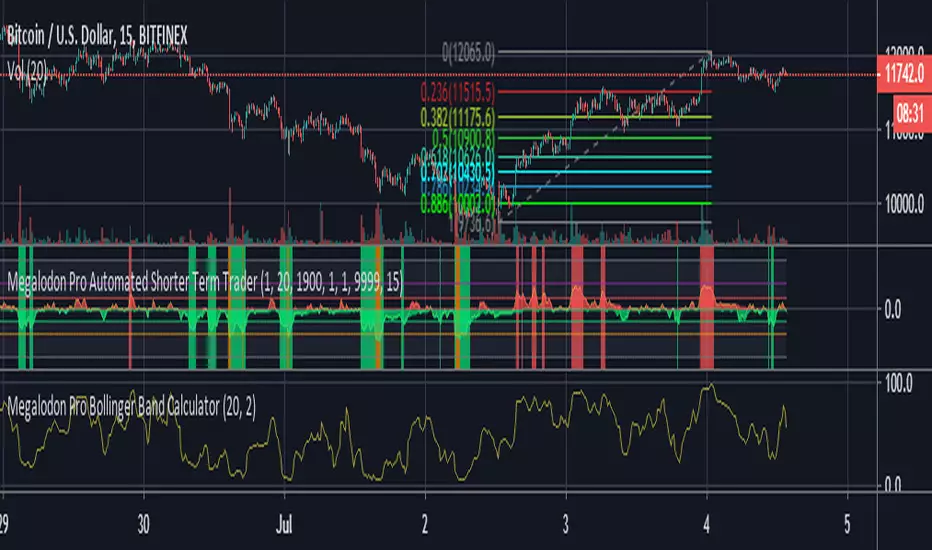
Megalodon Pro Fibonacci CalculatorHow to use?
It ranges between 0-100. 0 is oversold, 100 is overbought.
It could be a really beneficial tool for determining longer term price location.
It is designed for any time frames smaller than 1 Day time frame.

Megalodon Pro Bollinger Band CalculatorHow to use?
It ranges between 0-100. 0 is oversold, 100 is overbought.
It could be a really beneficial tool for timing your day trades in lower time frames.
It is designed for 1 minutes - 15 minutes - 30 minutes - 60 minutes - 240 minutes - 1 Day time frames.
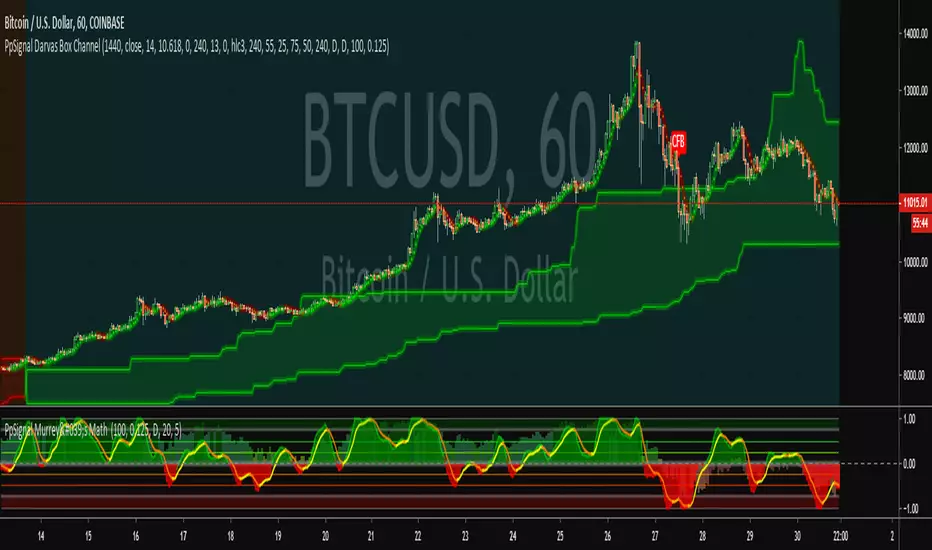
PpSignal Darvas Box ChannelDarvas Box is a great technical analysis indicator, with an interesting background and creator. Nicholas Darvas, a dancer by trade, made $2,000,000 in an 18-month period trading stocks using the Darvas Box method, while traveling the world on dance tours.
I made a darvas box dynamic, which I see more accurate than the darvas box of nicolas
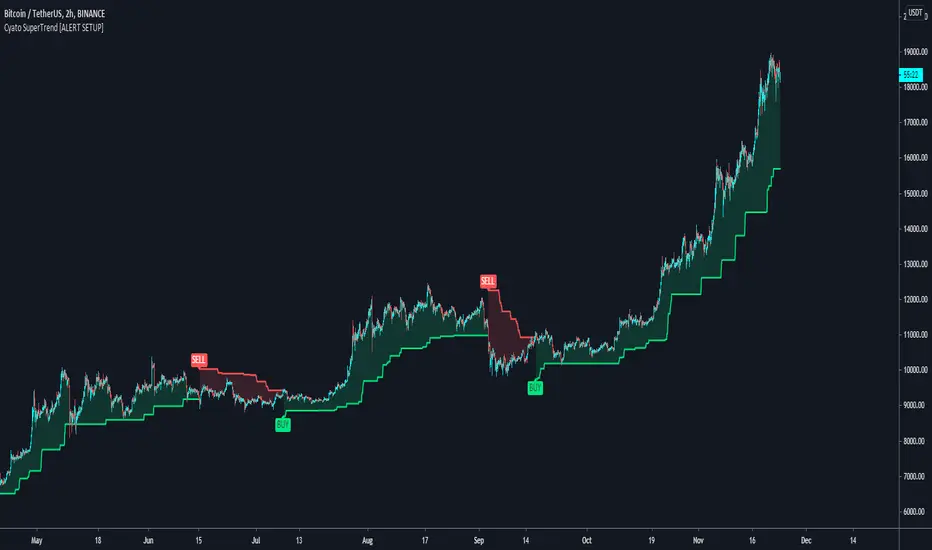
Cyatophilum SuperTrend [ALERT SETUP]Cyatophilum SuperTrend V1
A multi-timeframe indicator with Buy and Sell Alerts, built on ATR. (Averate True Range).
The SuperTrend line can be used as support when green, and resistance when red.
Reversals are strong buy/sell signals but perform badly in range markets.
BestFollowTrendBest for beggining traders.. to follow TRENDS... and Remember.. TREND IS YOURE FRIEND !!!

Market God v6Advance your trading game by applying our TA based indicator-study on your charts. Market God v6 is a tool that can be added to any chart, timeframe, or ticker on https://tradingview.com, and suggests the situation at hand as an opportunity to buy or sell you interests.
Market God v6 Product Description
Advance and Improve your understanding of price movement using the Market God v6 Trading Study (accessed via tradingview.com)
* Set alerts to be delivered via email or SMS (See TradingView.com for limitations that may apply, based on your Tradingview account type)
* Quickly identify market trends with visual buy/sell alerts on chart
* Access charts on-the-go via Tradingview mobile app
* Apply study to any symbol within the entire Tradingview library
* Use on any timeframe available to you on Tradingview
Through use of tradingview.com’s advanced Pine Script programming language, I have spent thousands of hours to find the rights combination that has resulted in the indicator study you see today. That said, it is imperative to understand that this study is not a guarantee profit & should be far from the only reason you enter a trade. It is highly recommended that you backtest, or paper trade before using this study, as it is intended to be a tool, and not the end-all-be-all.
When starting, my goal was clear: to create a study that could suggest consistent, reliable, and accurate trades, at a rate of success that was either equal to, or better than if I were doing it myself. Ideally, I figured that if I could take my own personal buy/sell criteria, standardize it, and create an system that informed me once my own criteria was met, it would allow me to succeed on a more consistent basis, and allow me to focus on other projects.
But lets pull it back to way before this indicator was even on the map – to the middle of 2018, specifically the middle of crypto-winter. Like many, I started by doing something I believe every trader or investor should do: writing down the exact criteria that I would ultimately require that I hold myself, in order to enter or exit a position. I then demanded that I abide by that criteria when making any decision in trading. This was relatively easy, and also forced me to really understand where I went wrong, each time I would losing trade.
While establishing the trade plan, I ran through every study/indicator I used personally already, and utilized online resources to understand what made those indicators give the readings they do, and the various ways price movement and volume can be used to calculate trends.
By taking the wealth of knowledge available online, we have successfully created a study that applies these methods of TA, and standardizes a system of trading that was successfully established in the bear market.

Crypto grabberSo, its my first position in crypto (and not only crypto) bots series. What we have there.. program writting on Pine script language what can analyse market data of any trading instrument and signalise to enter the deal. Its next versions will update. Trade system based on my x-volume indicator.In central part of system is analyzing volume accumulation and distribution process which decide good and bad time for investing.
So some important points:
1) In time when you change timeframe or trading symbol bot analise all bars history. The number of trading (signal) candles in the analysis history is marked in black.
2) The percent of profitable signals is marked in blue.
3) Total profit points are marked in green.
4) Total bars in history are marked in red.
For better indicator vision you can turn off non interesting plots in settings menu.
There is two kinds of alerts: Buy alert and Sell alert. Set it once per bar close or every minute ( because the best way you must open the deal at 20 sec before bar close ).
This trading system is great for creating a profitable trading portfolio. Try it yourself to find exchanges and cryptocurrencies with profitable historical views. For example, the KRAKEN exchange trades well: XBTCAD, XBTUSD in 30-45 min timeframe.
I will do better settings in new versions of this bot. Waiting your likes)

PpSignal Wyckoff Volumeoriginal script
i changed internal calculation
for more information about this oscilator see please
stockcharts.com

PpSignal Wyckoff Wave
the original script is from @modhelius.
I add color trend, alarm (up and down), and volume weighted Average convert to smooth elder.

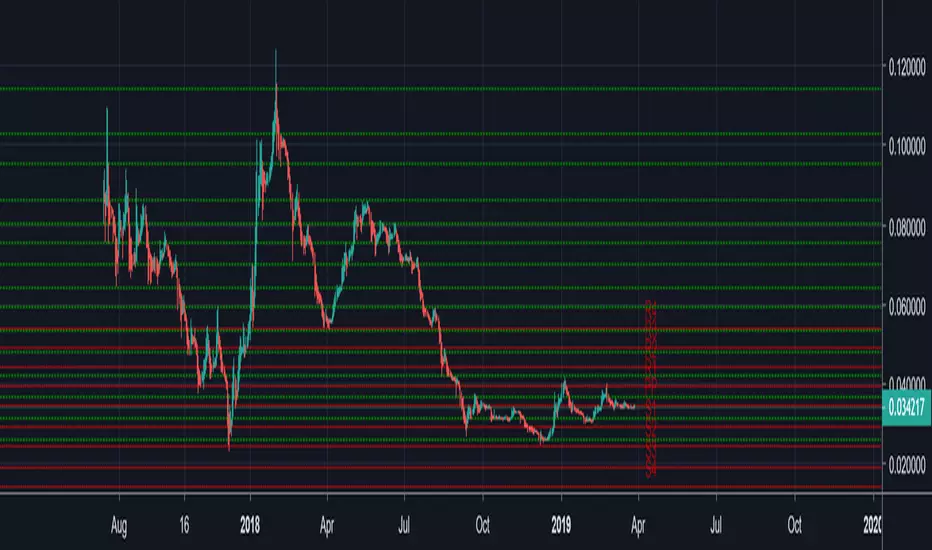
Auto FIB v1Auto FIB indicator defects automatically high and low for the coins and created Fib lines.
I would greatly appreciate if you could leave feedback on this indicator.
if you like this indicator, I would greatly appreciate if you can donate for the hard work.
BTC - 138yXLNU2CJBuTJ9tBYkKBcv1wC17VN2RV
ETH -0x435a32d7F1383626F271eE9f999d18b83453BF80
LTC - LcsfSCsRDqPWxH7vC5wMGJXh8x3bfKvvZj
ETC - 0x3f6cAfdc0544a34DdC0E0fd4908C68Ec6a803708


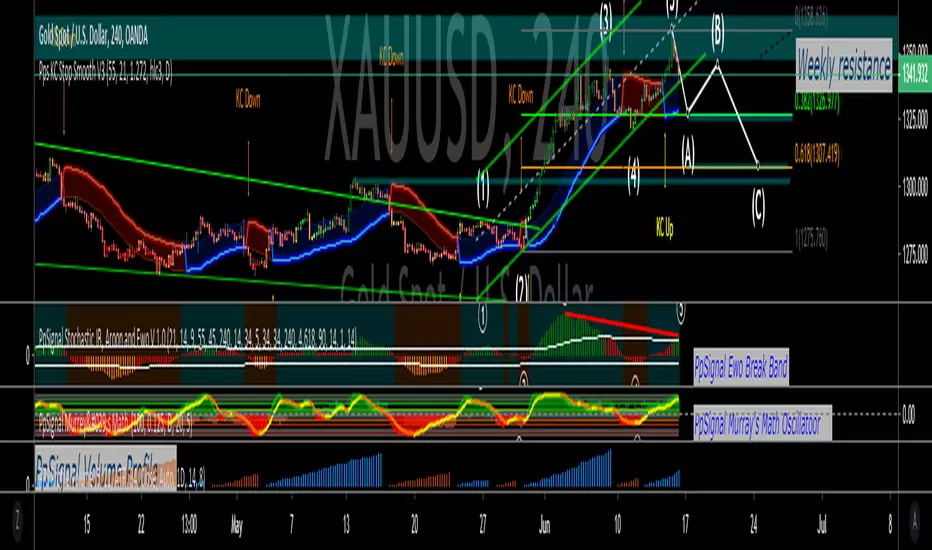
PpSignal KC Band Stop SmoothKeltner Channels 9KC) are a popular technical indicator that traders use to help assess the current trend, spot potential reversals and provide trade signals. The channels use volatility and average prices to plot upper and lower lines, as well as a middle (or average) line. All three of these lines move with the price, creating a channel-like appearance. Day traders can create multiple strategies using Keltner Channels; some of those strategies and uses are discussed below.
Please read this article which is very interesting for the use of KC
www.thebalance.com
We have soft the KC, we also added PpSignal CFB and PpSignal Nuke, to closely follow the short trend.
Another remarkable point we have added the PerPro to look for long-term trend.
enjoy