DeltaPulseDeltaPulse: Professional Cumulative Volume Delta Indicator
DeltaPulse is a free cumulative volume delta (CVD) indicator engineered for modern traders who demand precision, adaptability, and visual clarity. Unlike traditional CVD tools that often suffer from scaling issues, excessive noise, or poor responsiveness across timeframes, DeltaPulse delivers a streamlined, professional-grade solution that "just works" – providing actionable insights into buying and selling pressure with minimal setup.
This indicator accumulates the net difference between buying and selling volume (inferred from candle direction), normalizes it intelligently for consistent readability, and applies advanced smoothing to filter out market noise while preserving momentum signals. The result is a clean, momentum-colored line in a dedicated pane, enhanced by subtle visual cues that highlight key market dynamics.
Whether you're a day trader scalping intraday moves, a swing trader analyzing weekly trends, or an institutional analyst reviewing futures contracts, DeltaPulse adapts seamlessly to your workflow. It's designed to be your go-to tool for confirming trends, spotting divergences, and identifying order flow imbalances – all without the bloat of overcomplicated features.
Key Features
Intelligent Normalization for Universal Compatibility
Automatically adjusts scaling based on chart timeframe and symbol volume profile.
Intraday (1-5 min): Uses a 100-period volume average for responsive, lively signals.
Intraday (15+ min): 50-period average for balanced sensitivity.
Daily/Weekly+: 20-period average for clean, long-term perspective.
Ensures the indicator remains visually meaningful and non-flat on any asset – from low-volume penny stocks to high-liquidity indices like ES or NQ.
Advanced Smoothing Options
Six moving averages to match your trading style:
EMA - Quick reactions to recent delta shifts
SMA - Simple Moving Average - Stable, noise-resistant baseline
WMA - Weighted Moving Average - Emphasizes recent data with linear weighting
HMA - Hull Moving Average - Ultra-smooth yet lag-free – ideal for momentum trading
RMA - Running Moving Average (Wilder's) - Trend-following with minimal whipsaws
VWMA - Volume-Weighted Moving Average - Highlights high-volume delta moves
Lower values increase reactivity; higher values enhance smoothness.
Flexible Reset Mechanisms
Session Reset: Clears CVD at the first regular trading bar each day – perfect for intraday analysis.
Weekly Reset: Resets at the start of each new week – suited for swing and position trading.
No manual intervention required; the indicator handles resets reliably across all timeframes.
Background Shading:
Light green tint above zero; light red below.
Extreme highlights when smoothed CVD exceeds 90% of its 80-bar high/low – flags potential exhaustion or absorption zones.
How It Works
DeltaPulse calculates a simple yet effective volume delta on each bar:
Bullish Bar (close ≥ open): Adds full volume as positive delta.
Bearish Bar (close < open): Subtracts full volume as negative delta.
This raw delta accumulates into a running total (CVD), resetting based on your chosen mode. The total is then:
Normalized against a timeframe-adaptive volume average to ensure consistent scaling.
Smoothed using your selected MA type for noise reduction and trend clarity.
Plotted with momentum-based coloring and visual enhancements.
The output is a single, intuitive line that reveals the underlying battle between buyers and sellers – far more reliably than raw volume bars or basic oscillators.
Trading Applications
DeltaPulse shines in revealing order flow dynamics that price action alone often conceals. Here are proven ways to integrate it:
Trend Confirmation & Momentum Trading
Bullish Setup: Rising green line above zero confirms buyer control – enter longs on pullbacks to support.
Bearish Setup: Falling red line below zero signals seller dominance – short on rallies to resistance.
Zero Line Crosses as Reversal Signals
A crossover from negative to positive territory often marks a sentiment shift – use for entry triggers.
Combine with volume spikes or key levels for high-probability setups.
Enhancement: VWMA mode amplifies signals on high-volume breakouts.
Absorption & Exhaustion Zones
Watch for extreme background highlights: A spike to highs followed by reversal suggests large players absorbing supply.
Ideal for fade trades near overextended levels (e.g., after news events).
Avoid low-volume or illiquid symbols, as delta inference relies on reliable candle data.
Timeframe-Agnostic: Solves the common CVD pitfall of being "dead" on intraday charts or erratic on daily ones through smart, automatic normalization.
Lag-Free Responsiveness: The default HMA smoothing strikes a rare balance – smoother than EMA, faster than SMA – without the computational overhead of exotic filters.
Zero Clutter: No histograms, no extraneous plots, no overwhelming alerts. Just pure, distilled order flow intelligence.
Cumulativedelta

Real Cumulative Delta VolumeReal Cumulative Delta Volume (CDV) - Enhanced Volume Flow Analysis
What This Indicator Does
This indicator calculates cumulative delta volume using an enhanced approximation methodology that analyzes buying and selling pressure within each candlestick. It provides traders with insights into volume flow dynamics by tracking the cumulative difference between estimated buy and sell volumes over time.
Technical Methodology & Calculation Details
Volume Distribution Algorithm: The indicator uses a price-weighted distribution method to estimate buy and sell volumes within each bar:
Delta multiplier = (close - low) / (high - low)
Buy volume = total volume × delta multiplier
Sell volume = total volume × (1 - delta multiplier)
Net delta = buy volume - sell volume
Cumulative Delta Tracking: Unlike basic volume indicators, this approach maintains a running cumulative total of net delta values:
CDV Open = Previous CDV Close
CDV Close = Previous CDV Close + Net Delta
CDV High/Low = Previous CDV Close + estimated intrabar extremes
Enhanced Features Beyond Standard CDV:
Divergence Detection: Automatically identifies when price direction conflicts with volume flow direction
Body Size Analysis: Compares current vs previous CDV candle body sizes to detect momentum changes
Conditional Color Coding: Special visual alerts when specific price/volume relationships occur
Signal Generation: Buy/sell signals based on divergence resolution patterns
How This Differs from Basic Cumulative Delta
Standard Limitations Addressed:
Most cumulative delta indicators on TradingView use simple uptick/downtick classification. This indicator enhances the approach by:
Price-Weighted Distribution: Instead of assuming 50/50 volume splits, uses the bar's price action (close relative to high/low) to estimate volume distribution
OHLC Representation: Displays CDV as candlesticks rather than just a line, showing intrabar volume dynamics
Integrated Divergence Detection: Built-in algorithms identify price/volume conflicts automatically
Advanced Signal Logic: Multi-condition signal generation beyond simple crossovers
Visual Enhancement Features:
Dual display modes (candlestick or line)
Special color coding for divergence conditions
Moving average overlays for trend confirmation
Optional buy/sell signal markers
Signal Generation Logic
Buy Signals Generated When:
Previous bar showed bearish divergence (price down, CDV up)
Current CDV candle shows specific color condition
Current CDV body is contained within previous divergence body
Price closes above previous high
Sell Signals Generated When:
Previous bar showed bullish divergence (price up, CDV down)
Current CDV candle shows specific color condition
Current CDV body is contained within previous divergence body
Price closes below previous low
Trading Applications
Volume Flow Analysis:
Identify periods of hidden accumulation or distribution
Spot when large players are buying/selling against the price trend
Confirm trend strength through volume alignment
Divergence Trading:
Early warning system for potential reversals
Identify when price movements lack volume support
Time entries based on divergence resolution
Trend Confirmation:
Use CDV direction to confirm price trend validity
Moving averages on CDV provide additional trend context
Volume momentum changes often precede price momentum shifts
Display Options & Settings
Visual Modes:
Candlestick: Full OHLC representation of cumulative delta
Line: Simplified cumulative line display
Moving Averages:
Optional SMA overlays (default: 50, 200 periods)
Optional EMA overlays (default: 50, 200 periods)
Customizable periods and colors
Signal Controls:
Toggle buy/sell signals on/off independently
Customizable colors for all visual elements
Adjustable transparency and styling options
Usage Guidelines & Limitations
Best Practices:
Most effective on timeframes 15m and higher due to volume data quality
Works best in liquid markets with consistent volume
Should be used alongside price action analysis and support/resistance levels
Signals are more reliable during trending market conditions
Technical Limitations:
Uses approximation methods due to lack of tick-by-tick data in Pine Script
Volume distribution estimates may be less accurate during gaps or low-volume periods
Effectiveness depends on quality of volume data from your broker/exchange
Market Context Considerations:
Less reliable during market holidays or extremely low volume sessions
News events and earnings can cause volume anomalies that affect calculations
Consider market microstructure when interpreting signals on very short timeframes
Important Disclaimers
Educational Purpose: This indicator is designed for educational and analysis purposes. It does not constitute financial or investment advice.
Risk Warning: All trading involves risk of loss. Past performance of any indicator signals does not guarantee future results.
Testing Required: Users should thoroughly backtest and forward test this indicator before using it in live trading. Paper trading is recommended to understand signal behavior.
No Guarantees: The developer makes no claims about profitability or accuracy. Market conditions change and historical effectiveness may not continue.
Proper Usage: This is a technical analysis tool, not a complete trading system. Always use appropriate risk management, position sizing, and combine with other forms of analysis.
Developer: Delta Merge Professional Trading Applications
Access Instructions: Send a private message through TradingView explaining your trading experience and how you plan to use this indicator. Access is provided to traders who demonstrate understanding of volume analysis concepts and proper risk management practices.

Delta AO + Regular AO (Normalized)🔀 Delta AO + Regular AO (Normalized) – Visualizing Market moods becomes simpler 🔀
🧠 Introduction
The Delta AO + Regular AO (Normalized) is a custom oscillator that fuses the power of classic momentum analysis with volume-derived delta flow to give traders a dual-perspective edge.
This tool was born from a need to better visualize internal market thrust (via delta) while still respecting the time-tested signal power of the traditional Awesome Oscillator (AO).
🔍 What makes it unique?
✅ Volume-based Delta Calculation – Models upward/downward delta using a custom volatility-weighted volume allocation method, not simple tick-delta or raw buys/sells.
✅ Cumulative Delta Candles – Instead of just plotting bars, the indicator rebuilds the market structure using cumulative delta logic.
✅ Dual AO Display – Shows both custom delta AO and traditional price AO simultaneously.
✅ Normalized Scaling – Each AO is independently normalized by its standard deviation (volatility-adjusted), making both indicators visually comparable without distortion.
🧮 Under the Hood
Let’s break down the components:
1. Delta Logic 📊
Rather than using raw delta or tick-level data, this script simulates net effort:
Delta Up = Volume × a smart weighting when the candle is bullish
Delta Down = Volume × weighting when the candle is bearish
The weighting dynamically adjusts based on candle body-to-wick ratio. This provides a more refined delta estimate based on candle structure.
This delta is accumulated (cumulative delta) and used to form a synthetic OHLC candle structure.
2. AO Calculations ⚖️
Custom AO: Calculated from the median of synthetic delta candles
Regular AO: Classic (median price 5-period SMA - 34-period SMA)
Both are normalized using their own 34-bar standard deviation, improving comparability and visualization in one pane.
3. Color Coding 🎨
For the delta AO histogram:
Lime: Bullish + Increasing Momentum
Green: Bullish + Weakening Momentum
Red: Bearish + Increasing Momentum (to the downside)
Maroon: Bearish + Weakening Momentum
This lets you immediately spot momentum shifts and strength behind volume-based moves.
📈 How to Use – Trading Guide
🔧 Recommended Setup:
Timeframe: Works well on all intraday and higher timeframes (5m–1D)
Symbol: Especially effective on liquid instruments (futures, indices, large caps)
✅ Entry Signals
🔹 Buy Setup
Delta AO turns green or lime above zero, and Regular AO is also rising
Ideal confirmation: Lime bar (strong bullish delta momentum) and a crossover above zero
🔹 Sell Setup
Delta AO turns maroon or red below zero, and Regular AO is also falling
Ideal confirmation: Red bar (strong bearish delta momentum) and AO falling further below zero
🔄 Momentum Confirmation
Look for divergence between the Delta AO and Regular AO.
🔼 If Delta AO is rising but Regular AO is flat or falling → Volume is leading price (possible breakout ahead)
🔽 If Regular AO is strong but Delta AO fades → Price may be unsustainable (fakeout risk)
🛑 Exit / Reversal Clues
Sudden color shifts (e.g., Lime → Green → Maroon) can signal momentum exhaustion
Both AOs converging to zero suggests consolidation phase ahead
📌 Pro Tips
Use this with volume profile, support/resistance, or market structure zones for maximum confluence
Works great as a secondary confirmation tool for your existing strategy
💬 Final Thoughts
This oscillator is not just a pretty double AO — it's a strategic fusion of price and volume time-series designed to help you anticipate shifts before they’re obvious in price alone.
If you're looking for:
A modernized AO
Volume-integrated signal clarity
Normalized, noise-filtered momentum visual
Then this tool belongs in your chart arsenal.
📈 Try it. Test it. Pair it. If you find value, consider sharing or following for more next-gen indicators.
Please note this is an educational idea and past performance is not assurance of future performance.
Happy trading!
— @Pratik_4Clover

Cumulative Volume Delta Divergence [TradingFinder] Periodic EMA🔵 Introduction
The Cumulative Volume Delta (CVD) is a powerful tool in technical analysis that is derived from market volume or trading activity. The Cumulative Volume Delta Divergence Detector Indicator helps traders identify Cumulative Volume Delta Divergences (CVD Divergence), which can provide reliable trading signals.
These divergences, such as bullish and bearish CVD divergences, act as key indicators of potential trend reversals in financial markets. By analyzing CVD divergences, traders can gain insights into the strength of buying and selling pressure and make more informed predictions about price trends.
The CVD indicator is particularly effective for traders who engage in day trading and scalping, as it helps identify price reversal points by analyzing volume and price behavior.
Using the CVD indicator in combination with other technical tools such as support and resistance levels and candlestick patterns allows for a more accurate market analysis.
🔵 How to Use
Divergences are one of the most important technical analysis signals that indicate the current strength of a price move may not be sustainable.
Cumulative Volume Delta Divergence helps traders identify potential trading opportunities that may not be visible on the price chart alone.
This type of divergence examines the relationship between buying and selling volume and price, enabling traders to better understand price trends.
🟣 Bullish CVD Divergence
A bullish CVD divergence occurs when the price makes a lower low, but the CVD indicator shows a higher low. This indicates increasing buying pressure in the market, even though the price is declining. In other words, despite the price dropping, buyers are gradually gaining strength, which could signal a price reversal and the start of a bullish trend.
How to use this signal : In this scenario, traders looking to go long can use this signal as a favorable opportunity to enter the market. After a bullish divergence, the market typically tends to move upward.
To reduce risk, traders can wait for further confirmation from the price chart. For example, if the price breaks through the previous high after the divergence or breaks a resistance level, this could be a more reliable signal for entering the market.
🟣 Bearish CVD Divergence
A bearish CVD divergence is the opposite of a bullish divergence. In this type of divergence, the price makes a higher high, but the CVD indicator shows a lower high. This indicates decreasing buying pressure and weakening momentum in the current bullish trend. A bearish divergence often serves as a warning of a potential market reversal to the downside.
How to use this signal : Traders can use this divergence as an opportunity to exit long positions or enter short positions. When the CVD indicator makes a lower high compared to the price, it signals weakness in buyer strength.
If traders receive further confirmation from the price chart, such as a break of key support levels or an increase in selling volume, this can serve as a stronger signal for the beginning of a bearish trend.
🟣 How to Build a Trading Strategy with Cumulative Volume Delta Divergence
Using CVD divergence alone may not be sufficient. Traders should combine this tool with other technical analysis techniques and indicators to have more confidence in their decisions. For example, when observing a CVD divergence, traders can also analyze volume, trend lines, or candlestick patterns to get a more accurate market analysis.
Additionally, risk management should always be a priority. Using stop-loss orders and properly sizing trades can help traders minimize their losses if they make a mistake.
🔵 Setting
Divergence Fractal Period : Determines the period of swings. The minimum and default value is 2.
CVD Period : You can set the period of " Periodic " and " EMA " modes.
Cumulative Mode : It has three modes "Periodic" and "EMA". In "Periodic" mode, it accumulates the volume periodically and in "EMA" mode, it calculates the moving average of the volume.
Market Ultra Data : If you turn on this feature, 26 large brokers will be included in the calculation of the trading volume. The advantage of this capability is to have more reliable volume data. You should be careful to specify the market you are in, FOREX brokers and Crypto brokers are different.
🔵 Conclusion
The Cumulative Volume Delta (CVD) indicator is a powerful tool in technical analysis, helping traders better identify price trends and make more accurate market predictions. By identifying CVD divergences, traders can anticipate price reversals and time their market entries and exits accordingly.
Bullish and bearish CVD divergences each provide valuable signals that can help traders identify the best entry and exit points in the market. A bullish CVD divergence signals strength in buying that will likely lead to a price increase, while a bearish CVD divergence indicates weakness in the bullish trend and the potential for the beginning of a bearish trend.
Overall, combining CVD with other technical analysis tools and employing risk management strategies can help traders make better trading decisions and capitalize on available market opportunities.

Cumulative Delta [TradingFinder] Volume + Periodic + EMA🔵 Introduction
To fully grasp the concept of Cumulative Volume Delta (CVD), it's essential first to understand Volume Delta. In trading and technical analysis, the term "Delta" typically refers to the difference between two values or the rate of change between two data points.
Volume Delta represents the difference between buying and selling pressure, calculated for each candlestick on a chart. This difference can vary across different timeframes.
A positive delta indicates that buying volume exceeds selling volume, while a negative delta shows that selling volume is greater. When buying and selling volumes are equal, the volume delta equals zero.
🟣 What is Cumulative Volume Delta (CVD)?
Cumulative Volume Delta (CVD) is a powerful tool in technical analysis that aggregates delta values for each candlestick, creating a comprehensive indicator that helps traders assess market trends.
Unlike the standard Volume Delta, which compares delta on a candle-by-candle basis, CVD provides insight into the overall buying and selling pressure during key market swings. A downward-trending CVD suggests that selling pressure is dominating, which is typically a bearish signal.
Conversely, an upward-trending CVD indicates bullish sentiment. This analysis becomes even more significant when comparing CVD with price action and market structure, helping traders to predict asset price directions.
By evaluating market highs and lows, one can determine the market trend. A consistent rise in these points indicates an uptrend, while a consistent fall suggests a downtrend.
🔵 How to Use
Understanding how to detect trend changes using Cumulative Volume Delta is crucial for traders. Typically, CVD aligns with market structure, moving in the same direction as price trends.
However, divergences between CVD and price trends or signs of exhaustion in volume can be powerful indicators of potential market reversals. Recognizing these patterns can help traders make informed decisions and improve their trading strategies.
🟣 Identifying Trend Exhaustion with Cumulative Volume Delta (CVD)
The Cumulative Volume Delta (CVD) indicator is especially effective in identifying weakening trends in the market. For instance, if gold's price hits a new low, but CVD does not follow suit, this may indicate a lack of seller interest despite the new low, signaling potential seller exhaustion.
Most traders interpret this as a possible reversal from a bearish to a bullish trend. Similarly, if gold reaches a new high but CVD fails to do the same, it can suggest that buyers lack the strength to push the market higher, indicating a possible trend reversal.
🟣 Utilizing Cumulative Volume Delta (CVD) Divergence in Price Trend Analysis
Another effective use of CVD is identifying divergences in price trends. For example, if CVD breaks a previous high or low while the price remains stable, this divergence often indicates that buying or selling pressure is being absorbed.
For instance, if CVD rises sharply without a corresponding increase in gold prices, it may suggest that sellers are absorbing the buying pressure, potentially leading to a strong sell-off. Conversely, if gold prices remain stable while CVD declines, it could indicate that buyers are absorbing selling pressure, likely leading to a price increase once selling subsides.
🔵 Setting
Cumulative Mode : It has three modes "Total", "Periodic" and "EMA". In "Total" mode, it collects the volume from the beginning to the end. In "Periodic" mode, it accumulates the volume periodically and in "EMA" mode, it calculates the moving average of the volume.
Period : You can set the period of " Periodic " and " EMA " modes.
Market Ultra Data : If you turn on this feature, 26 large brokers will be included in the calculation of the trading volume.
The advantage of this capability is to have more reliable volume data. You should be careful to specify the market you are in, FOREX brokers and Crypto brokers are different.
🔵 Conclusion
Cumulative Volume Delta (CVD) is a powerful analytical tool in financial markets that helps analysts and traders assess buying and selling pressure by aggregating and combining the volume delta for each candlestick.
CVD can indicate the strength or weakness of a market trend. When CVD moves upward, it signals that buying pressure is dominant and is considered a bullish signal; conversely, a downward movement in CVD indicates that selling pressure is stronger and is viewed as a bearish signal.
This indicator is particularly effective in identifying divergences and exhaustion in market trends. For example, if CVD does not align with price movements, it may suggest a potential trend reversal.
Traders use this information to make more informed trading decisions, especially when identifying entry and exit points in the market.
Overall, CVD is a tool that enables analysts to better understand market fluctuations and more accurately predict future market trends.

Cumulative ATR Distance Oscillator// A Price/ATR oscillator with cumulative waves.
// Based on Cumulative Volume Delta, but using price movement alone.
// Public Domain
// By Jolly Wizard
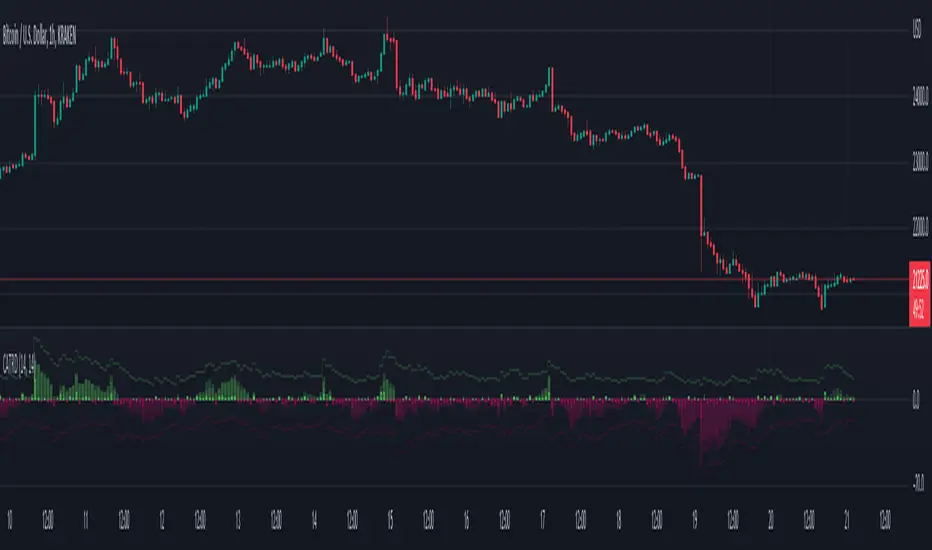
[VC] Cumulative Delta Histogram V1.0The V.C Cumulative Delta Histogram shows the market's ongoing Buying/Selling pressure. It helps to determine whether Supply or Demand is dominating and in control.
➤If the Cumulative Delta Increases, the buyers are in control.➚
➤If the Cumulative Delta Decreases, the sellers are in control.➘
The use cases for this Indicator are vast and correlated with our other Delta Indicators. The following examples will explain how to use this Indicator.
Example 1 EUR / USD
In the above example, Negative Cumulative Delta Decreased & Turned into Positive Cumulative Delta. That indicates that sellers are losing control & buyers are getting power.
As a confirmation on the ' 'Box Chart Histogram'' it is evident that Demand is also increasing.
And on ''Wave Chart Index'' as a 3rd confirmation, you can see that the Delta has also increased compared to previous waves.
Example 2
Positive Delta on Cumulative Delta Histogram is decreasing & Negative Delta started increasing.
On the Box Chart Histogram , Demand is decreasing & Supply is increasing.
Additionally, on the Wave Chart Index , the Delta of the wave is also decreasing.
(in short, besides ''Cumulative Delta Histogram," Box chart Histogram & Wave Chart Index is also adding additional confirmation)
Note: Two types of Delta sources are included in this Cumulative Delta Indicator.
Type A: Simple Delta
Type B: Delta %
Simple Delta is the difference between Net Buying - Selling pressure.
Delta % also works in the same calculation, but a Volume weighted algorithm is applied on it.
You may use any of them that suits your analysis.
VC Cumulative Delta Histogram Settings & Inputs
Source:
Allows you to choose the source, Between Simple Delta & Delta %.
Cumulative Length:
Allows you to Change the cumulative length.
Positive & Negative Color:
It allows you to change the colors.
Style Menue
Allows you to change the style & color of the histogram.
Disclaimer Note:
V.C Cumulative Delta Histogram It is purely Volume , Delta, Demand & Supply imbalance and comparative analysis-based tool. Before applying this Indicator to your study, you should know about Volume , Delta & Spread, Demand & Supply, and Aggressive & Passive behaviour of buyers/sellers.
Some basic understanding of Sir Richerd Wyckoff's Theory can also be helpful.

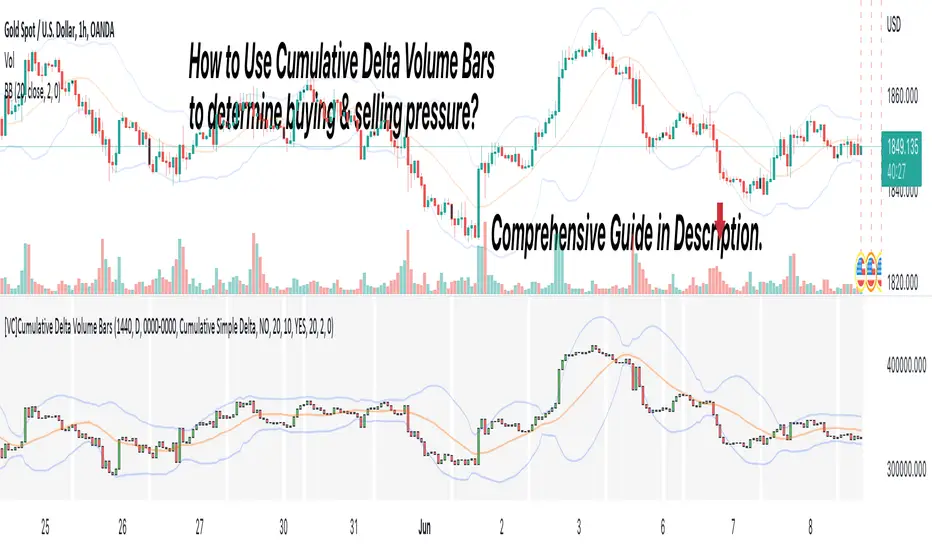
[VC] Cumulative Delta Volume BarsLet's first learn what is Delta & How to Use Cumulative Delta Volume Bars?
Cumulative Delta Volume Bars is one of the leading indicators that you can use when trading order flow. It gives you an instant snapshot of the buying and selling pressure in a market.
After reading the detailed description of "Cumulative Delta Volume Bars," you will understand how volume delta provides a critical edge by allowing you to spot significant potential reversals in the market. You will also learn to use this Cumulative Delta indicator in depth. (including rest session usability features)
What is Delta Volume?
Delta Volume is the difference between Buying and Selling Power. Delta Volume is calculated by taking the difference between the volume traded at the offer price and the volume traded at the bid price. (in simple words, the difference between buying pressure & selling pressure)
If delta volume is more than zero, you have more buying pressure than selling & vice versa, and if delta volume is less than zero, you have more selling pressure than buying.
In Order-Flow Analysis , traders used Cumulative Delta to measure the relationship between the Buying & Selling pressure Vs Price.
Cumulative delta volume takes the delta values for every bar and successively adds them together to provide a graph, as seen below visually.
Let me demonstrate by giving examples of how cumulative Delta can help measure the buying or selling pressure relative to the price move.
★ Trading Absorption & Exhaustion concepts with Delta
See the chart below & try to analyze the next possible move on the basses on the analysis mentioned on the chart.
➽➽ If you said Short, you were correct. ✅
Till Point A , both price & cumulative were aligned. (means there were no imbalances between Delta & Price).
But on Point B , the Cumulative Delta broke the previous resistance clearly and moved even further away from the resistance level, but the Price couldn't break the last resistance. It interprets that buyers applied a lot of buying pressure but no result. (Aggressive buying pressure absorbed by Passive sellers)
Due to this vast effort or failed attempt, buyers were exhausted and had no more strength to pull the Price up. That's why the Price reversed from Point B . See below image
★ Cumulative Delta Volume Bars is helpful when determining buying or selling pressure at different key price levels, such as swing highs or lows.
Let's recap on swing highs and swing lows.
➽ A swing high (S.H) is formed when the high reaches higher than the price action around it. Once the Price moves above a prior swing high and begins to retrace, a new swing high is formed.
➽ A swing low (S.L) is formed when the low reaches lower than price action around it. Once the Price moves below a prior swing low and begins to retrace, a new swing low is formed.
➽ When the Price makes higher highs and higher lows, a market is considered an uptrend.
➽ When the Price is making lower lows followed by lower highs, a market is considered a downtrend.
When evaluating Delta, it's beneficial to compare delta values at swing lows or swing highs to determine the amount of selling or buying pressure and how the market reacts.
The actual Power of Delta is revealed when we use it to determine the market's reaction to powerful buying or selling. We want to see if the market has reacted as we would expect or not.
In the above Example, you will notice that every time price breaks a swing, Delta does as well.
It makes sense as it takes selling pressure to break a swing low or buying pressure to break a swing high. In simple words, we can say that there is no anomaly between delta direction & price direction.
In simple words (No Absorption or Exhaustion)
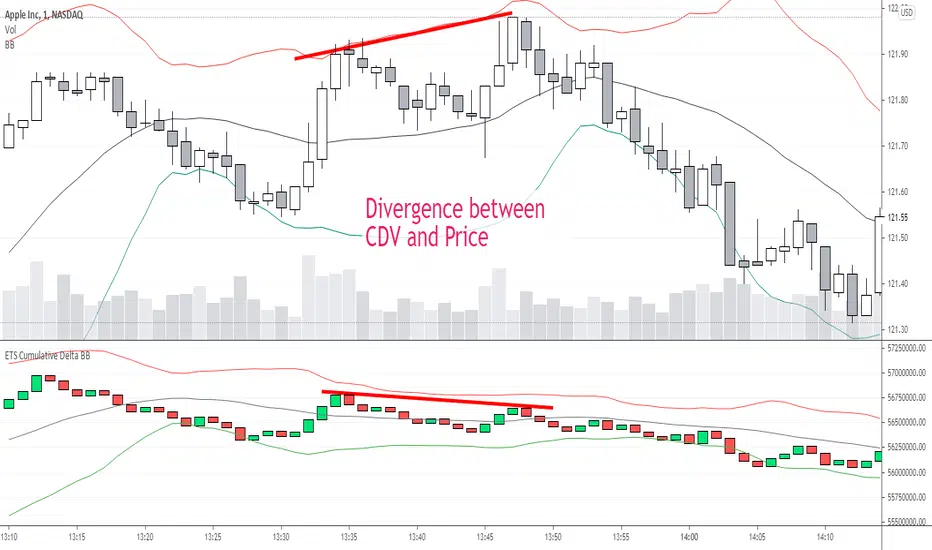
But what's occurring when this isn't the case, and we have divergence between Price and Delta? Let's analyze it with real examples.
★ Understanding Delta Divergence.
(Lack of Harmony in Buying/Selling Pressure & Price Move)
Notice how the Price breaks out of the previous resistance level on the above chart, but the Delta didn't yet reach even close to its last resistance level. It's a clear divergence between Price and Delta. Buyers may be slightly exhausted at the previous resistance level, and Price & Delta may retrace slightly. But in a broader view, it reflects a strong bullish signal.
See the above chart & see when and why the Price moved. I hope it will help you understand the underlying relation & story between Price & Delta.
Cumulative Delta & Trade Management
Delta will help you spot significant reversals, but it can also be used to help manage your open trade. You want to see a high correlation between Delta and Price when in a long or short position.
Suppose you're short while the Price is breaking a new low. You want to see Delta breaking low if sellers aren't interested in selling at the recent lows, represented by Delta not breaking lows. The probability of a short term reversal or a significant retrace increases.
When in a position, always be on the lookout for exhaustion and absorption, signalling a reversal potential.
What Includes in V.C Cumulative Delta Volume Bars Indicator
Inputs & Settings
Reset accumulation on new session:
Allows you to rest accumulation at the start of each session (you may choose your customized starting & ending time as well by enabling ''Customize Rest Session Time''
Start/End of Session & During Session:
Allows you to show/hide & choose the background color & separator of each session
''Customize Rest Session Time''
When this setting is enabled, your customized given time will be applied, which can be set from the below box. Note: set your time in minutes. For Example, if you want to reset the session after every hour, you need to put 60. If you're going to reset after every 8 hours, you need to put 480. Additionally, your chart time frame must be lower than your customized rest time.
Reset Each Minutes:
Allows you to put your desired rest time in minutes. For Example, for 1 hour 60, for 8 hours 480. (8x60)
Reset Each:
Allows you to choose rest time from the drop-down menu. Note: To apply this setting, don't enable the ''CUSTOMIZE RESET SESSION TIME''.
Select Session:
Allows you to set customized starting & ending times of the session instead of the exchange's default time. For Example, the exchange reset time is 20:00, but if you want 22:00, first, you need to set your chart time as an exchange from the right bottom of the chart, and then you need to put 22:00 22:00 in both fields. Note: Put the same starting & ending time. In simple words, it should not be greater than or less than 24 hours.
Type:
It allows you to select Delta type. (there are two delta types you can choose from, 1st Simple Delta, 2nd Delta % or Volume Weighted Delta)
Candle Colors:
Allows you to change the color of candles.
Envelope Indicator:
Allows you to apply to Envelop Indicator on the delta candle. (all default settings of the Envelop Indicator can be customized as well)
See the below chart with Envelop applied to Delta Candles & Price Candles. (can be used to measure the Delta & Price movement at the micro-level)
Bollinger Bands Indicator:
Allows you to apply to Bollinger Bands Indicator on the delta candle. (all default settings of the Bollinger Bands Indicator can be customized as well)
See the below chart with Bollinger Bands applied to Delta Candles & Price Candles. (can be used to measure the Delta & Price movement at the micro-level)
Start/End of Session on Chart
Allows you to change the first & last candle of the session.
Style Settings:
Allows you to control all the visual settings of delta candles, Envelop & Bollinger bands.
-------------------------------------------------
➽Conclusion:
Cumulative Volume Delta Bars is one of the leading indicators you can include as an order flow trader in your arsenal. It gives you an inside look at buying and selling pressure and how the market reacts.
But Keep in mind, in trading & technical analysis, nothing is 100% certain. No indicator can give you a 100% success rate. There is no holy grail in the financial market. As a trader, with the help of technical & fundamental indicators, our goal is to find an edge over the market. A simple definition of an edge is: Anything that adds a few points to the winning side of an equation builds an edge that lasts a lifetime. A trading edge defines your technical or strategic advantage in the highly competitive market environment. Traders can establish multiple edges by starting with popular strategies and customizing rules to lower the risk of getting trapped with the emotional crowd.
Disclaimer Note:
V.C Cumulative Delta Volume Bars It is purely Volume, Delta, Demand & Supply imbalance and comparative analysis based tool. Before applying this Indicator to your study, you should know about Volume, Delta & Spread, Demand & Supply, and Aggressive & Passive behaviour of buyers/sellers.
Some basic understanding of Sir Richerd Wyckoff's Theory can also be helpful.
SMART4TRADER-US STOCKSThe indicator is intended to evaluate the stock market , as it takes into account the data on the BUY and SELL of all US shares. In the indicator, you can select various methods for providing data.
Priority = (BUY - SELL) with a intraday cumulative effect.
Ratio = (BUY / SELL) with a intraday cumulative effect.
Delta = (BUY - SELL) on each candle.
Volume = (BUY + SELL) on each candle.
Cumulative = (BUY - SELL) with cumulative for all available history.
------------------------------
Индикатор предназначен для оценки фондового рынка , так как в себе учитывает данные о покупка и продажах всех акций США. В индикаторе можно выбрать различные методы предоставления данных.
PRIORITY = (BUY - SELL) с накопительным эффектом внутри дня.
RATIO= (BUY / SELL) с накопительным эффектом внутри дня.
DELTA= (BUY - SELL) на каждой свече.
VOLUME= (BUY + SELL) на каждой свече.
CUMULATIVE= (BUY - SELL) с накопительным за всю доступную историю на графике.

ETS Prox Cumulative Volume Delta BBThis script is based on the work originally done by kprsa for the Monster Cumulative Delta indicator, but adds Bollinger Bands and upgrades it to version 4 from version 1.
It is an approximation of the Cumulative Delta Volume that is usually based on volume differences between market and limit orders, but because that data is not available, this indicator allocates a portion of the volume of a candle to the "upward" and "downward force" of each candle.
The upward force of a "Buy" candle is calculated by the High-Low
The downward force is calculated by (High-Close)+(Open-Low)
"Sell" candles are calculated in the same way just opposite
Total force=up force + down force
Up volume approximation = candle volume * up force/total force
Down volume approximation = candle volume * down force/total force
The result is similar to OBV, but not exactly the same, and allows for a "candle size" which you can't get with On Balance Volume.
I had never used a Cumulative Delta Volume indicator before, but when I started using it myself, it proved very effective when there was a deviation from price. It was also very effective in my opinion when Bollinger Bands was added to assess the standard deviation of the CDV compared to the Bollinger Band of price and looking for areas where the CDV reaction to hitting or getting close to the BB was different.
I hope you find it useful! Of course, it comes with no guarantee of profits or any investing advice whatsoever.
[astropark] Cumulative Volume Delta (CVD)Dear Followers,
today another awesome Analysis Tool, that you can use in your trading journey: Cumulative Volume Delta (CVD) , also known as Cumulative Delta Volume (CDV)!
Volume says a lot about price action:
price drops with low volume? or price pumps but no volume increase?
big sellers volume but price does not drop? or big buyers volume but price does not increase?
The Cumulative Volume Delta measures the effectiveness of buyers and sellers' actions, so basically if the volume they generate with their buy and sell market orders is effective on price or not.
When it's not effective, a divergence appears and we, as traders, can profit from it.
Here some examples how you can use the indicator by spotting divergences between price and cumulative volume delta.
EURUSD, 15m
sellers trying hard to make price fall, but volume is lacking on CVD (exhaustion): bullish divergence
EURUSD, 15m
buyers trying hard to make price go up, but volume is lacking on CVD (exhaustion): many bearish divergences
SPX500, 15m
buyers exhaustion: bearish divergence
XAUUSD, 15m
sellers exhaustion: bullish divergences
XAGUSD, 15m
buyers exhaustion: bearish divergence
BTCUSD, 15m
buyers exhaustion: bearish divergence (in red)
buyers absorbed sellers' pressure: hidden bullish divergence (in green)
BTCUSD, 15m
inefficiency by buyers: higher and higher buy volume but it's not effective on price (sellers absorbed): hidden bearish divergence (in blue)
sellers exhaustion: bullish divergences (in green)
buyers exhaustion: bearish divergence (in red)
ETHBTC, 15m
buyers exhaustion: bearish divergence (in red)
inefficiency by sellers: higher and higher sell volume but it's not effective on price (buyers absorbed): hidden bullish divergence (in blue)
TSLA, 15m
inefficiency by sellers, sellers pressure absorbed by buyers: hidden bullish divergence (in blue)
buyers exhaustion: bearish divergence (in red)
sellers exhaustion: bullish divergence (in green)
inefficiency by buyers, sellers pressure absorbed by sellers: hidden bearish divergence (in fuchsia)
This indicator works on every timeframe, market and pair, by the way must be said that it works best on 15m and 5m timeframes, as you can have access to a more detailed volume information.
As I always say, all tools are great if you use them correctly: this is not the "Holy Grail", so always use proper money and risk management strategies.
This is a premium indicator , so send me a private message in order to get access to this script.

Cumulative Delta VolumeHello Traders,
This is Cumulative Delta Volume script. Delta refers to the difference between buying and selling volume at each price level. Cumulative Delta builds upon this concept by recording a cumulative tally of these differences in buying vs selling volume. The Cumulative Delta indicator plots as candlesticks or line. One of the main uses of Cumulative Delta is to confirm or deny market trends. you may need to search it for yourself ;)
You have option to see it as Candles or a Line. also there are options to show 2 SMAs and 2 EMAs with different Lengths, you can set the lengths as you wish.
By default it shows CDV as Heikin Ashi Candles, it can also show it as normal candles:
It can show CDV as a line:
Also you may need to check divergence:
Enjoy!

Market Delta [Makit0]MARKET DELTA INDICATOR v0.5 beta
Market Delta is suitable for daytrading on intraday timeframes, is a volume based indicator which allows to see the UP VOLUME vs the DOWN VOLUME, the DELTA (difference) and the CUMULATIVE DELTA (cumulative sum of difference) between them
This indicator is based on contracts volume (data avaiable), not in ask/bid volume (data not avaiable)
The up/down volume is calculated at each candle as follows:
- calculate the ticks of the range, top wick and bottom wick
- calculate the ticks up and ticks down to get the total ticks of the candle
- calculate the volume per tick as total volume divided by total ticks
- calculate the up and down volume as volume per tick multiplied by up ticks and down ticks
The delta is calculated as volume up minus volume down
The cumulative delta is a cumulative sum of delta and is resetted to 0 twice a day at the globex open and at the us cash open
By default the indicator plots the 'CANDLE MODE' which is useful for charting the cumulative volume to find out support and resistance zones where the volume is rejected or pass thru, as the volume moves so does the price, price always follows the volume, price goes away from where volume dries and price auctions comfortable where is plenty of volume, in a way PRICE FEEDS ON VOLUME
An indication about the plotting style in the volume, delta and cumulative delta modes: I can't use histogram as intended due a bug at autoresizing the scale in the candle mode, so the styles used are areabr and circles.
FEATURES
- Plot volume in one of four modes: Volume Up/Down, Delta, Cumulative Delta, Cumulative Delta as Candles
- Cumulative delta resetted twice a day (globex and cash open)
- Show a base line at 0
SETTINGS
- Mode: select one of the four volume output modes: Volume, Delta, Cumulative Delta and Candles. Candles by default
- Show zero line: show/hide the zero base line. False by default.
HOW TO SETTING UP THE INDICATOR:
BE AWARE, by default the indicator settings are configured for using the Cumulative Delta Candle Mode
- Candles Mode Settings: configured by default, mode candles and zero line off
- Volume, Delta, Cumulative Delta Mode Settings: select the mode you want and switch on/off the zero line
GOOD LUCK AND HAPPY TRADING

Cumulative Delta (Zeiierman)█ Overview
Cumulative Delta (Zeiierman) transforms raw volume and price data into a continuous buying and selling pressure narrative. Instead of treating volume as a static total, it accumulates the net delta (buying vs. selling activity) bar by bar, revealing whether real demand is supporting or contradicting price movement. This tool bridges microstructure-based order flow concepts with high-level market trend modeling, offering a refined look beneath traditional candles.
The indicator visualizes cumulative trade imbalance over time, layering it with adaptive confirmation lines, impulse recognition, and trend filtration. The result is a refined map of volume–price interaction that identifies hidden strength, fading momentum, or early accumulation before visible reversals occur.
This tool is designed for multi-context use — intraday scalping, swing confirmations, or structural bias analysis — offering a precise view of participation flow beneath price behavior.
⚪ Why This One Is Unique
Unlike conventional delta indicators, this version incorporates adaptive smoothing, multi-source delta modeling, and contextual confirmation layers that dynamically adjust based on both volume and price displacement. Its framework is powered by a volume re-normalization algorithm, combined with multi-dimensional weighted mapping between price flow, volume imbalance, and trend inertia.
█ Main feature: Cumulative Delta Candle
The Cumulative Delta Candles visualize how each bar’s internal buying vs. selling pressure builds over time. They represent volume-weighted displacement vectors of market aggression — when buyers dominate, the delta accumulates upward; when sellers dominate, the cumulative curve decays. Signal and confirmation overlays transform this raw delta motion into a structured view of market conviction, helping traders identify early inflows, exhaustion points, or continuation pressure.
█ How to Use
⚪ Trend Following
The Cumulative Delta is an effective tool for identifying who controls the market trend. When delta candles remain above the midline, buyers are in control. Conversely, when delta candles stay below the midline, sellers dominate.
Strong trends are identified when delta candles consistently cluster near the upper or lower levels, indicating sustained directional pressure in that trend’s favor.
⚪ Fading Momentum
The delta can also be used to detect waning momentum. If delta candles are above the midline but turn red with a declining slope, it signals that the current bullish move is losing strength.
If delta candles are below the midline but turn green with an upward slope, it suggests that bearish momentum is weakening.
⚪ Pullback Trading
To identify pullbacks, combine the overall trend of the Cumulative Delta candles with the Signal Line. Set the Signal Line length to 2 to create a fast-reacting delta line suitable for pullback detection.
Bullish Pullback
When the Cumulative Delta remains above the midline or near the upper level, and the Signal Line briefly dips below the midline or touches the lower level before sharply reversing upward, it signals a bullish pullback within an ongoing uptrend — a potential buy opportunity.
Bearish Pullback
When the Cumulative Delta stays below the midline or near the lower level, and the Signal Line briefly rises above the midline or touches the upper level before sharply turning downward, it indicates a bearish pullback within a downtrend — a potential sell opportunity.
⚪ Momentum Trading
Impulse Dots highlight sudden bursts of momentum in either direction.
When they appear around key breakout levels, they may signal the start of a strong move or breakout. However, if impulses appear after an extended trend, they often indicate potential exhaustion or reversal.
Always evaluate impulse signals within the broader market context to confirm their validity.
⚪ Up-Tick and Down-Tick Signals
The Up-Tick Signal confirms a possible shift or strengthening in bullish order flow. It frequently appears near local swing lows, suggesting increased buying pressure.
The Down-Tick Signal confirms potential bearish order flow. It often forms around local swing highs, signaling growing selling pressure.
⚪ Volume Signals
Volume Signals are derived from delta activity to help traders identify volume-based trend entries. They occur only in confirmed trends and serve as trend continuation triggers.
Bullish Volume Signal: When triggered, enter at candle close and use the built-in trailing stop to manage risk. Exit the trade when the Signal Line crosses below the midline again.
Bearish Volume Signal: When triggered, enter at candle close and use the trailing stop to follow the move downward. Exit the trade when the Signal Line crosses above the midline again.
█ How It Works
⚪ Delta Accumulation
Each candle’s internal buy/sell pressure is estimated using a price–volume ratio model. The resulting delta is accumulated over time to form the Cumulative Delta Curve, showing whether buyers or sellers are in sustained control. Users can select Estimated, Volume Data, or Enhanced modes to align the delta calculation with their preferred market source.
Calculation: Applies Cumulative Delta Integration — a continuous summation of signed volume over time with conditional price weighting. This produces a running measure of net buying or selling activity that evolves dynamically with market flow.
⚪ Signal & Confirmation Lines
The Signal Line reacts faster, acting as a short-term direction probe. The Confirmation Line lags slightly, validating the persistence of the delta trend. Crossovers between these lines frequently precede structural price rotations.
Calculation: Implements Multi-Phase Weighted Moving Functions, layering WMA/EMA structures to control smoothness and minimize phase lag between the fast and slow components.
⚪ Impulse & Momentum Bursts
The Impulse Engine detects statistically significant bursts in delta energy — high-magnitude expansions that often precede breakouts or reversals.
Each impulse is colored according to directional bias, helping visualize moments of strong conviction or exhaustion.
Calculation: Uses Impulse Response Functions, nonlinear filters that measure delta acceleration (Δ²δ/Δt²) to isolate momentum shifts and highlight transient bursts in order flow intensity.
⚪ Trend Layer & Filter
A built-in trend filtration algorithm ensures that bullish and bearish signals only appear when aligned with the dominant trend. The Trend Tolerance setting controls how much short-term noise the filter allows before declaring a trend change — effectively balancing agility vs. stability.
Calculation: Applies Trend Vector Regression, estimating directional slope and deviation using log-based least squares modeling to extract the dominant directional vector from noisy flow data.
⚪ VWAP–EMD Trend Core
The main trend estimation engine fuses Volume-Weighted Average Price (VWAP) logic with an Empirical Mode Decomposition (EMD) smoother, creating a non-linear, adaptive response curve. This enhances directional clarity while preserving microstructural sensitivity to shifts in flow balance.
Calculation: Constructs a VWAP–EMD Composite Curve, merging volumetric centroids with intrinsic mode decomposition for adaptive mean tracking and dynamic equilibrium modeling.
⚪ Trailing Stop & Risk Structure
Once a volume-based entry signal appears, a dynamic trailing stop is automatically drawn. It adapts to volatility and follows price movement, helping visualize optimal exit zones, stop hits, and locked profit regions.
█ Any Alert Function Call
The Any Alert Function Call system transforms the indicator into a programmable alert engine:
Combine multiple triggers (Crossover, Trend Flip, Impulse, Tick, TSL Hit, Volume Signal).
Detect slope, midline, or same-direction confirmations.
Customize messages with placeholders like {{ticker}}, {{close}}, {{volume}}, and {{time}}.
Build complex conditional alerts — such as Bull Volume Signal → TSL Hit — without editing the code.
-----------------
Disclaimer
The content provided in my scripts, indicators, ideas, algorithms, and systems is for educational and informational purposes only. It does not constitute financial advice, investment recommendations, or a solicitation to buy or sell any financial instruments. I will not accept liability for any loss or damage, including without limitation any loss of profit, which may arise directly or indirectly from the use of or reliance on such information.
All investments involve risk, and the past performance of a security, industry, sector, market, financial product, trading strategy, backtest, or individual's trading does not guarantee future results or returns. Investors are fully responsible for any investment decisions they make. Such decisions should be based solely on an evaluation of their financial circumstances, investment objectives, risk tolerance, and liquidity needs.
Paid script
