4C Daily Levels Suite + Premarket High/LowThis '4C Daily Levels Suite + Premarket High/Low' indicator is a clean way to automatically plot important daily levels including:
Prior Day High
Prior Day Low
Prior Day Close
50% level between Prior High/Low
Today's Open
Today's Premarket Low+High
This Daily Levels indicator is unique in its ability to:
-Plot all of the daily level PLUS premarket high/low levels (extended hours must be turned ON)
-Can hide past days levels, only plotting levels on the current day, to keep chart cleaner
-Can extend line levels right or fullscreen
-Plots the level price at each level on the chart
-Can show/hide price levels labels
-Can add supplemental premarket levels plot to show levels being formed during the premarket time period
-Coded with line.new vs plot so dashed lines are available as a style
-Automatically hides the indicator if the timeframe selected is Daily or greater
SEE SCREENSHOT EXAMPLES BELOW
Default mode, with extended hours showing:
With supplemental premarket plot showing:
Default mode without extended hours showing:
Showing past day’s levels
Extend lines to fullscreen
Some parts of this code were adapted from 'pd Levels' by CryptoCurl
DAY

Daily lines (UTC)This is a simple script to add highlighted lines on the daily open.
It uses UTC as timezone.

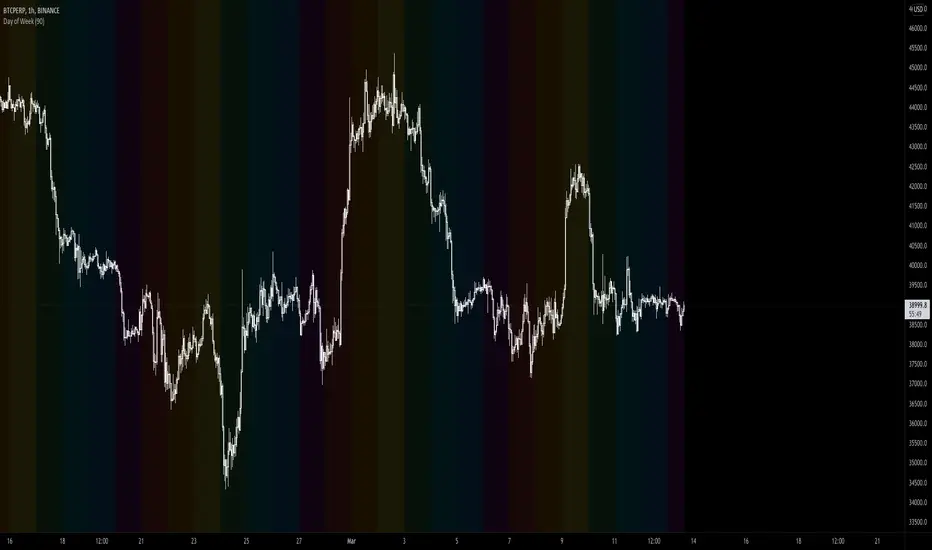
Time of Day and Day of Week Buying and Selling StrategyThis strategy allows you to back test longing or shorting or do nothing during time increments of 30 minutes for various days of the week. For example if you want to see if every Saturday if Bitcoin dropped in value from 1600-7000 UTC, this script will allow you to test that.
Make sure you are in the 30 minute time frame while viewing the performance and trade history.

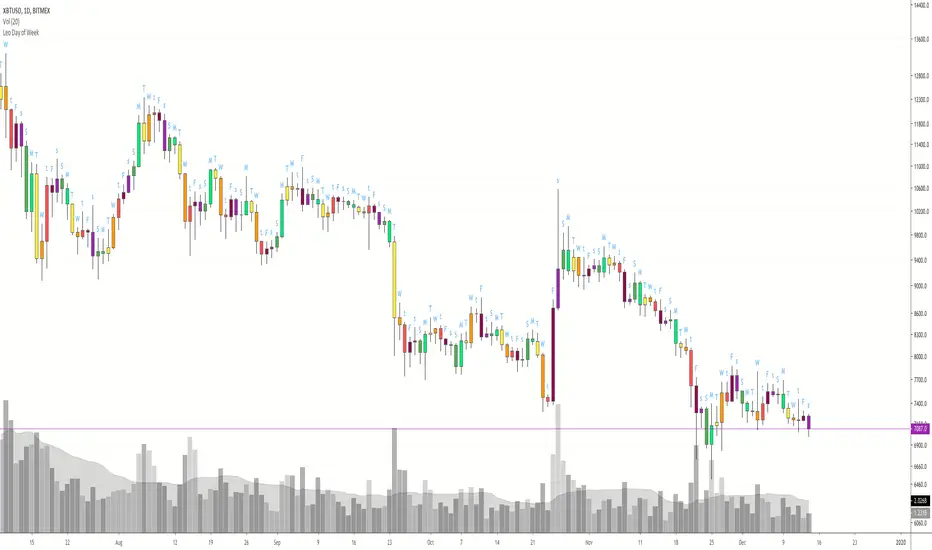
Day of Week Custom Buy/Sell StrategyThis strategy was made for bitcoin and allows you to back test longing or shorting for various days of the week. The price may tend to go in one direction or another for each week day, and this strategy allows you to test days across a range of dates to capitalize on this.
Make sure you are on the daily time frame while viewing the performance and trade history to ensure the script works as intended and you have the most historical data as possible from Trading View.

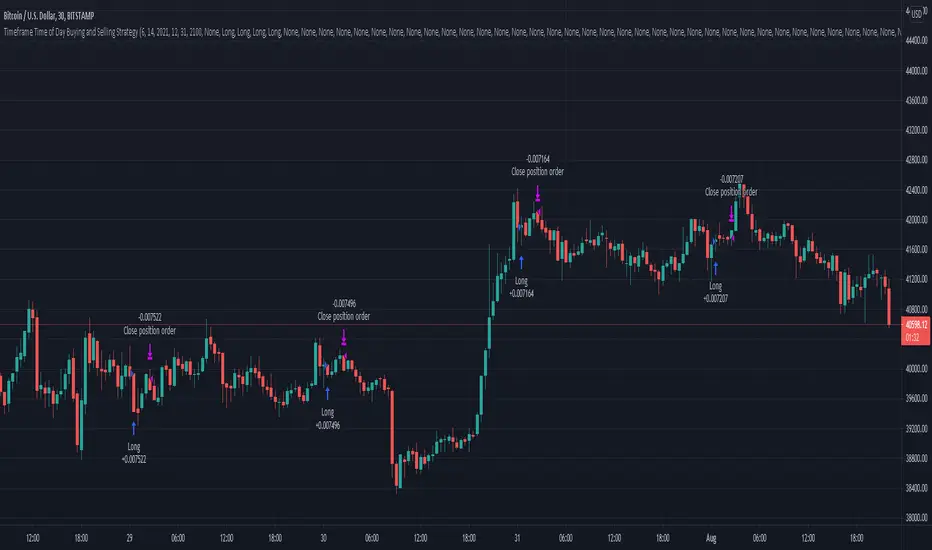
Timeframe Time of Day Buying and Selling StrategyThis strategy allows you to back test longing or shorting or do nothing during time increments of 30 minutes. The price trends in one direction every 30 minutes and this strategy allows you to test various 30 minute time frames across a range of dates to capitalize on this.
Make sure you are in the 30 minute time frame while viewing the performance and trade history.
DAYOFWEEK performance1 -Objective
"What is the ''best'' day to trade .. Monday, Tuesday...."
This script aims to determine if there are different results depending on the day of the week.
The way it works is by dividing data by day of the week (Monday, Tuesday, Wednesday ... ) and perform calculations for each day of the week.
1 - Objective
2 - Features
3 - How to use (Examples)
4 - Inputs
5 - Limitations
6 - Notes
7 - Final Tooughs
2 - Features
AVG OPEN-CLOSE
Calculate de Percentage change from day open to close
Green % (O-C)
Percentage of days green (open to close)
Average Change
Absolute day change (O-C)
AVG PrevD. Close-Close
Percentage change from the previous day close to the day of the week close
(Example: Monday (C-C) = Friday Close to Monday close
Tuesday (C-C) = Monday C. to Tuesday C.
Green % (C1-C)
Percentage of days green (open to close)
AVG Volume
Day of the week Average Volume
Notes:
*Mon(Nº) - Nº = Number days is currently calculated
Example: Monday (12) calculation based on the last 12 Mondays. Note: Discrepancies in numbers example Monday (12) - Friday (11) depend on the initial/end date or the market was closed (Holidays).
3 - How to use (Examples)
For the following example, NASDAQ:AAPL from 1 Jan 21 to 1 Jul 21 the results are following.
The highest probability of a Close being higher than the Open is Monday with 52.17 % and the Lowest Tuesday with 38.46 %. Meaning that there's a higher chance (for NASDAQ:AAPL ) of closing at a higher value on Monday while the highest chance of closing is lower is Tuesday. With an average gain on Tuesday of 0.21%
Long - The best day to buy (long) at open (on average) is Monday with a 52.2% probability of closing higher
Short - The best day to sell (short) at open (on average) is Tuesday with a 38.5% probability of closing higher (better chance of closing lower)
Since the values change from ticker to ticker, there is a substantial change in the percentages and days of the week. For example let's compare the previous example ( NASDAQ:AAPL ) to NYSE:GM (same settings)
For the same period, there is a substantial difference where there is a 62.5% probability Friday to close higher than the open, while Tuesday there is only a 28% probability.
With an average gain of 0.59% on Friday and an average loss of -0.34%
Also, the size of the table (number of days ) depends if the ticker is traded or not on that day as an example COINBASE:BTCUSD
4 - Inputs
DATE RANGE
Initial Date - Date from which the script will start the calculation.
End Date - Date to which the script will calculate.
TABLE SETTINGS
Text Color - Color of the displayed text
Cell Color - Background color of table cells
Header Color - Color of the column and row names
Table Location - Change the position where the table is located.
Table Size - Changes text size and by consequence the size of the table
5 - LIMITATIONS
The code determines average values based on the stored data, therefore, the range (Initial data) is limited to the first bar time.
As a consequence the lower the timeframe the shorter the initial date can be and fewer weeks can be calculated. To warn about this limitation there's a warning text that appears in case the initial date exceeds the bar limit.
Example with initial date 1 Jan 2021 and end date 18 Jul 2021 in 5m and 10 m timeframe:
6 - Notes and Disclosers
The script can be moved around to a new pane if need. -> Object Tree > Right Click Script > Move To > New pane
The code has not been tested in higher subscriptions tiers that allow for more bars and as a consequence more data, but as far I can tell, it should work without problems and should be in fact better at lower timeframes since it allows more weeks.
The values displayed represent previous data and at no point is guaranteed future values
7 - Final Tooughs
This script was quite fun to work on since it analysis behavioral patterns (since from an abstract point a Tuesday is no different than a Thursday), but after analyzing multiple tickers there are some days that tend to close higher than the open.
PS: If you find any mistake ex: code/misspelling please comment.

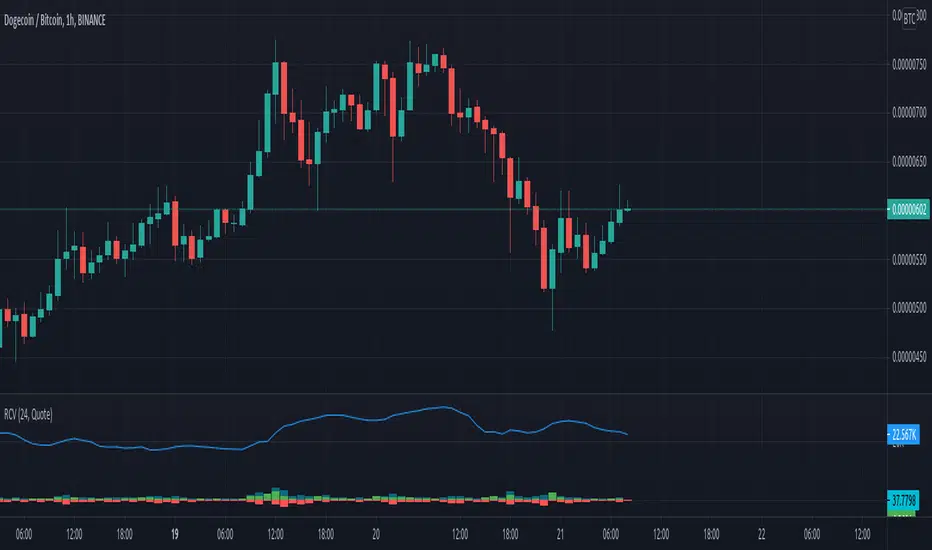
Rolling Cumulative VolumeThis indicator show a simple rolling cumulative volume. A field is specified. Then all last volume indicators are summed.
For example it could calculate last 24h Volume if you use the 1h bars and set the length for 24.
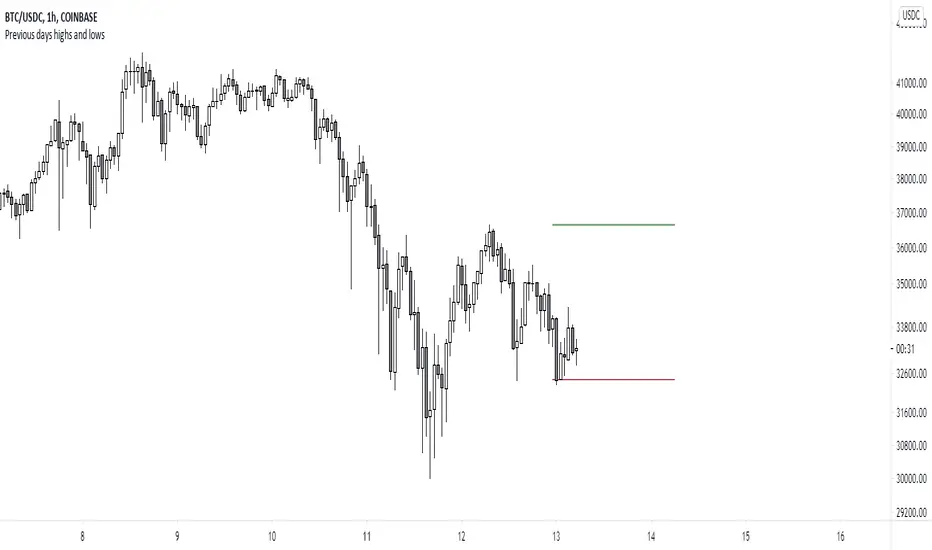
Previous days highs and lowsA script which marks a line pointing the highs and lows of the previous trading day.
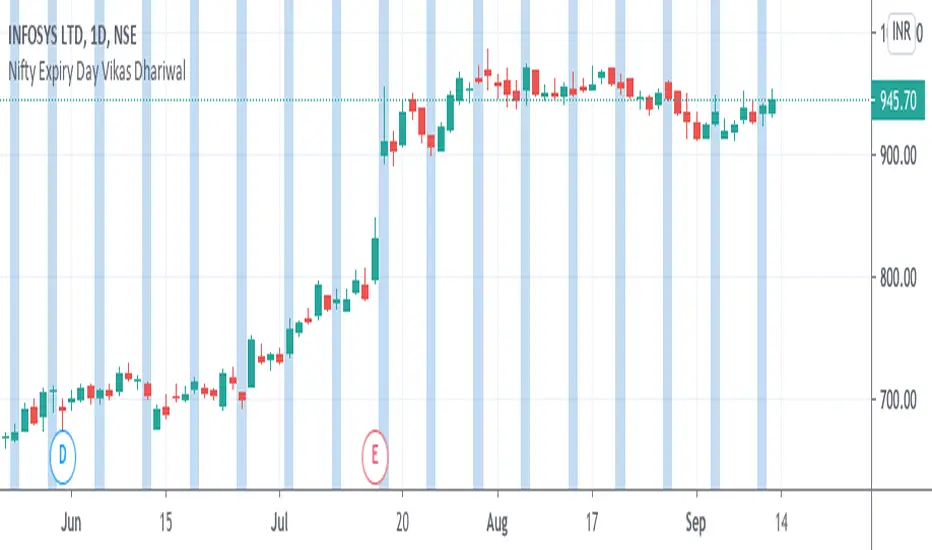
Nifty Expiry Day Vikas DhariwalStrategy for Expiry day plan
Here you can find easy expiry day of nifty and bank nifty
mark Thursday with color to find that day for test any expiry strategy plan
thanks call for more updated 8287335651
KZ SessionsThis shows killzone sessions for London NY, Asia sessions.
In addition to the opening hours of session, the pre-market and closing time periods are also marked with a grey color
Generally these are consided period of high activity and can experience more volatility in these periods
I also have enabled it to display the session times even on weekends. There is no session open at such times but heightened activity is noticed in these periods even on weekends.
If want to disable showing it on weekends, then remove ":1234567" from all the lines in code

Candle checker for long/short for scalping/day tradingHey.
This strategy is still in working.
For it I check a x amount of candles in the past if they been for example all red/green in row, and based on that I enter. For example candle 7 < candle 6 .... candle 3 < candle 2 .... candle 1 < candle current for long and viceversa for short.
After that,once the trade is initiated, I exit based on 2 possibilities : candle color is different than the color of candle when entry, or based tp/sl.
Let me know what you think of it.
I will try to make the process to calculate automatically and input the number of candles to check like 5-10-15 and so on.

Custom Time ranges. Daily price ranges.Addition to previous time range script, now containing daily ranges. You can select a day of the week, and have it show the high, low, mid, and open of that day.
For the time bands:
Monday = 2
Tuesday = 3
Wednesday = 4
Thursday = 5
Friday = 6
Saturday = 7
Sunday = 1
Example 1:
1500-1800:2
This will colour the background between 3pm and 6pm on Mondays.
Example 2:
0000-0600:247
This will colour the background between midnight and 6am on Mondays, Wednesdays, and Saturdays.
For the Daily price ranges:
Just select the tick-box forthe day, and then the price levels you'd like to see.
I want to add specific weekly levels to this, for example: week 06 of year 2020, but I've not figured out how to do it yet. If anyone knows, I'd appreciate it if you let me know. I'll then update this script.
As always, any questions you may have, please leave in comments below and I'll respond when I have time.
If you notice anything good with this indicator, let me know. We are all in this to make money after all! ;)

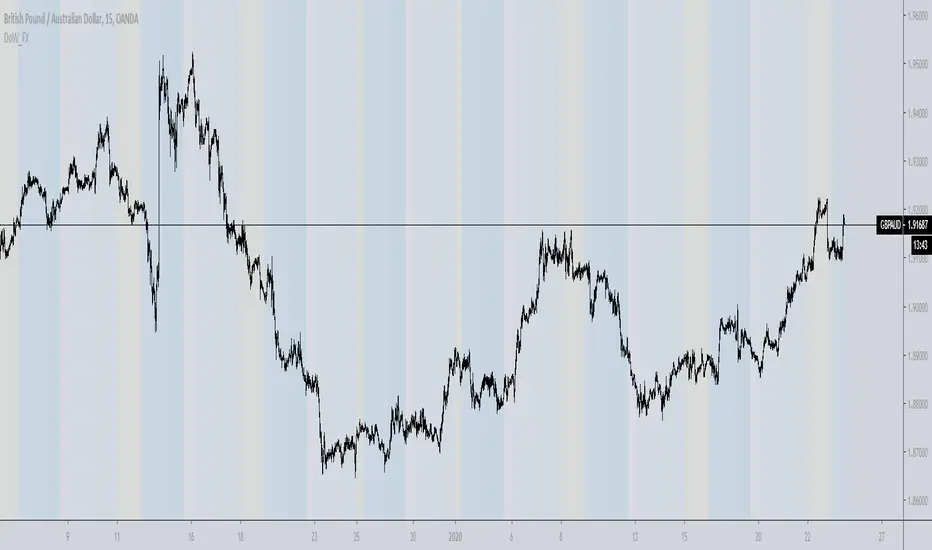
Day of week, Forex FixCalendar to work on instruments that trade a 24 hour day like crypto and forex, also does not display if you are above an intraday time. Main tweak was to end the trading day at 0000 (midnight) instead of 1700 (5pm) NYC time.
This update is geared towards Forex traders, which is why I chose to highlight Wednesday in yellow since that is commonly thought of as a midweek reversal point.
@airscape built a good calendar indicator based on the work of @ChrisMoody, this is really an update to their work and directed towards FX and Crypto
airscape:
ChrisMoody:
Future development:
Toggle for light and dark themes
Adjustment/offset for DLST and local vs/ server time
Additional color bands to denote Asian/London/NYC sessions?
Text label for days instead of color option?
Clean up the code and simplify

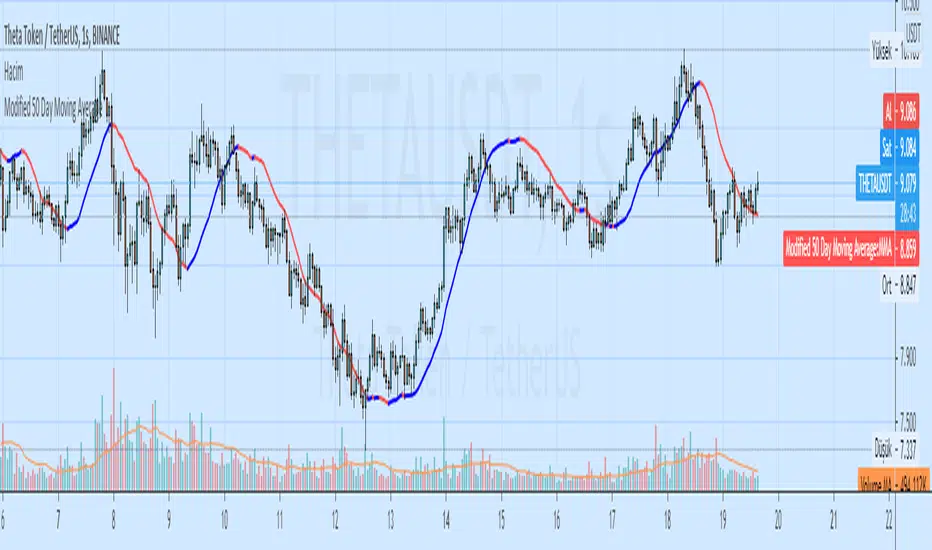

Higher Timeframe EMAThis script plots a higher timeframe EMA to your chart.
You can specify the timeframe and the length of the EMA in the settings.
This chart demonstrates the 5-minute 50EMA (black) combined with the 1-hour 50EMA (colored) on the 1 minute timeframe.


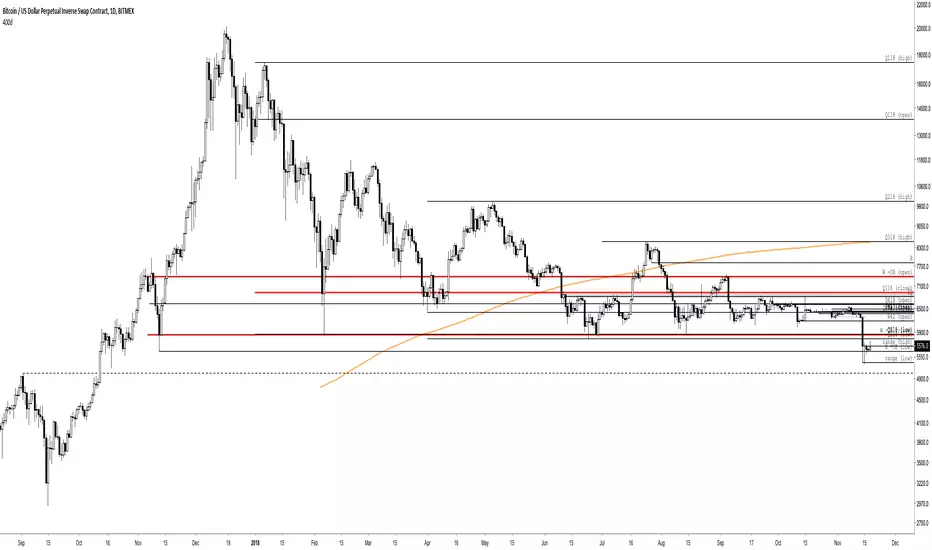
400 Day Simple Moving AverageAlways shows the 400d simple moving average, regardless of currently-shown timeframe.

Session RangeSimple script for showing the high/low/midrange of a session. By default configured to do the Daily range using the "regular" session. But it's configurable. For example on this chart I am showing the Weekly range.
