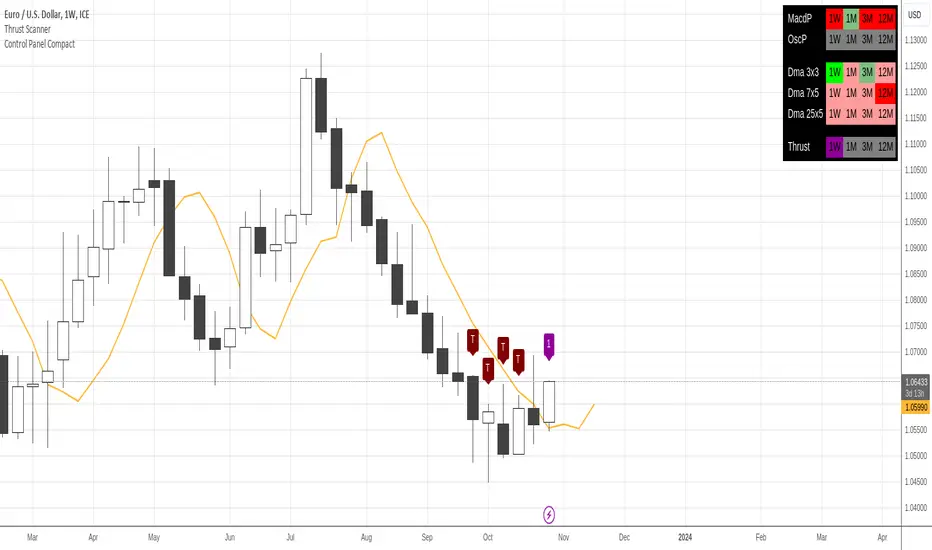
Dinapoli Thrust Scanner Multi MarketThis is the Multi-Market version of the Dinapoli Thrust Scanner. This indicator is able to scan up to 12 markets in 3 time frames simultaneously.
This tool is an aid to the trader and shouldn't be used in automated trading. As any Dinapoli trader would know, the Thrust pattern recognition requires visual approval from the trader.
The Thrust Scanner can display the following information onscreen:
A Multi-Timeframe Table that colors to indicate Recent/Current Thrusts. Green color signals a potential Up Thrusts, whilst red color signals a potential Down Thrust.
The DMA crosses get signaled with custom colors.
The Thrust Scanner has a Sensitivity Control which allows the trader to customize the accuracy of the scanner:
The stricter the setting, the lesser the number of potential Thrust that qualify, and therefore the more accurate the Thrust detection.
The looser the setting, the more number of potential Thrust being detected, but also the more Look Alikes (LaL) or false positives there will be.
Note: The scanner is resource hungry, and sometimes it might need some seconds to fully display the data.
Dinapoli

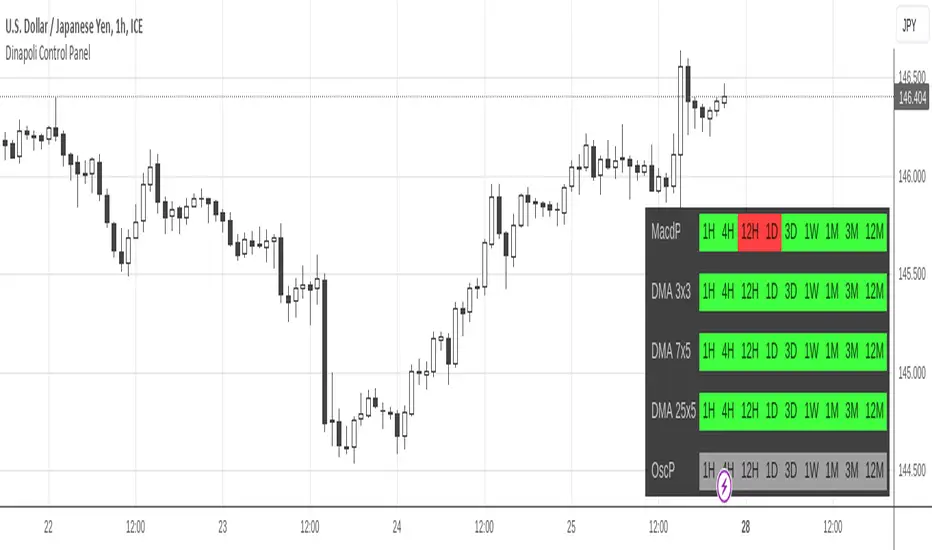
DiNapoli Control Panel CompactThis is a compact more customizable control panel to display the overall state of Dinapoli related indicators.
This indicator displays a matrix containing a customized set of Dinapoli indicator states from Higher Timeframes. It works as a Control Panel to properly monitor multiple layers of the market at an eye glance.
It can print the multi time frame state of the following indicators:
Macd Predictor
Oscillator Predictor
Stochastic Predictor
Trusht: Its presence and state of maturity
DMAs: 3x3, 7x5 and 25x5
In order to aid a custom display, it's designed to only supply color states in multiple time frames. This one doesn't provide the value reading of the indicators.
Only Higher Timeframes states do appear in the table. Lower Timeframes are hidden due to inability to get reliable results for such behaviour in current Tradingview environment.
By default only 5 timeframes get activated: 1H, 4H, 1D, 1W and 1M. But many more are available to be displayed throught the Input Tab.
The sorting of the rows and the position of the table can be customized through the input panel.
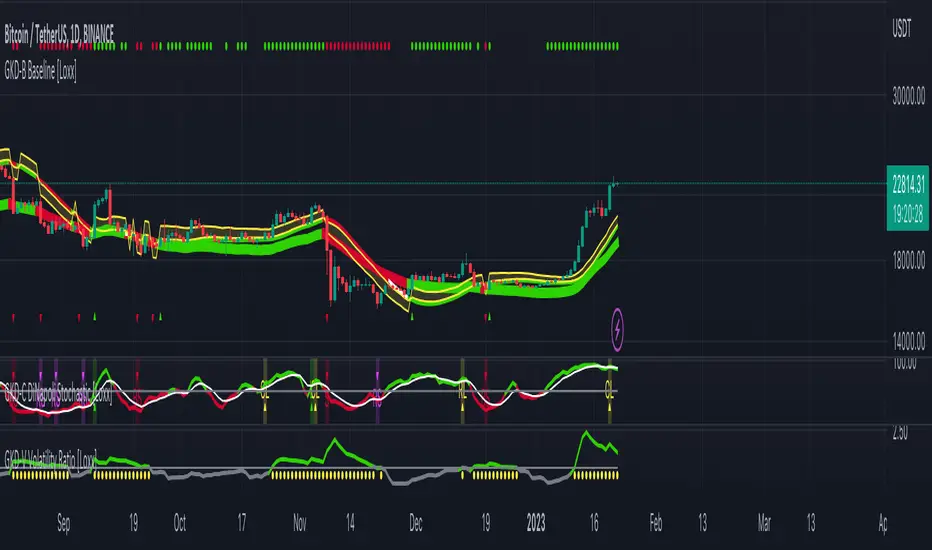
GKD-C DiNapoli Stochastic [Loxx]Giga Kaleidoscope DiNapoli Stochastic Confirmation is a Confirmation module included in Loxx's "Giga Kaleidoscope Modularized Trading System".
What is Loxx's "Giga Kaleidoscope Modularized Trading System"?
The Giga Kaleidoscope Modularized Trading System is a trading system built on the philosophy of the NNFX (No Nonsense Forex) algorithmic trading.
What is an NNFX algorithmic trading strategy?
The NNFX algorithm is built on the principles of trend, momentum, and volatility. There are six core components in the NNFX trading algorithm:
1. Volatility - price volatility; e.g., Average True Range, True Range Double, Close-to-Close, etc.
2. Baseline - a moving average to identify price trend (such as "Baseline" shown on the chart above)
3. Confirmation 1 - a technical indicator used to identify trends. This should agree with the "Baseline"
4. Confirmation 2 - a technical indicator used to identify trends. This filters/verifies the trend identified by "Baseline" and "Confirmation 1"
5. Volatility/Volume - a technical indicator used to identify volatility/volume breakouts/breakdown.
6. Exit - a technical indicator used to determine when a trend is exhausted.
How does Loxx's GKD (Giga Kaleidoscope Modularized Trading System) implement the NNFX algorithm outlined above?
Loxx's GKD v1.0 system has five types of modules (indicators/strategies). These modules are:
1. GKD-BT - Backtesting module (Volatility, Number 1 in the NNFX algorithm)
2. GKD-B - Baseline module (Baseline and Volatility/Volume, Numbers 1 and 2 in the NNFX algorithm)
3. GKD-C - Confirmation 1/2 module (Confirmation 1/2, Numbers 3 and 4 in the NNFX algorithm)
4. GKD-V - Volatility/Volume module (Confirmation 1/2, Number 5 in the NNFX algorithm)
5. GKD-E - Exit module (Exit, Number 6 in the NNFX algorithm)
(additional module types will added in future releases)
Each module interacts with every module by passing data between modules. Data is passed between each module as described below:
GKD-B => GKD-V => GKD-C(1) => GKD-C(2) => GKD-E => GKD-BT
That is, the Baseline indicator passes its data to Volatility/Volume. The Volatility/Volume indicator passes its values to the Confirmation 1 indicator. The Confirmation 1 indicator passes its values to the Confirmation 2 indicator. The Confirmation 2 indicator passes its values to the Exit indicator, and finally, the Exit indicator passes its values to the Backtest strategy.
This chaining of indicators requires that each module conform to Loxx's GKD protocol, therefore allowing for the testing of every possible combination of technical indicators that make up the six components of the NNFX algorithm.
What does the application of the GKD trading system look like?
Example trading system:
Backtest: Strategy with 1-3 take profits, trailing stop loss, multiple types of PnL volatility, and 2 backtesting styles
Baseline: Leader Exponential Moving Average as shown on chart
Volatility/Volume: Volatility Ratio as shown on chart
Confirmation 1: DiNapoli Stochastic as shown on the chart above
Confirmation 2: Jurik Turning Point Oscillator
Exit: Rex Oscillator
Each GKD indicator is denoted with a module identifier of either: GKD-BT, GKD-B, GKD-C, GKD-V, or GKD-E. This allows traders to understand to which module each indicator belongs and where each indicator fits into the GKD protocol chain.
Now that you have a general understanding of the NNFX algorithm and the GKD trading system. Let's go over what's inside the GKD-E DiNapoli Stochastic itself.
What is DiNapoli Stochastic?
The DiNapoli Stochastic demonstrates smoother indicators and therefore gives fewer false signals in comparison with the traditional oscillator.
The indicator is written in accordance with the description given in the book by Joe Dinapoli "Trading With DiNapoli Levels". This oscillator smoothing method leads to a filtering of the most "noise" component of the price movement.
The DiNapoli Stochastic indicator can be used in the strategies oriented to a standard stochastic. However, the stronger smoothing can lead to the loss of an array of signals. It is recommended to apply any trend indicator for more efficient use of the indicator and its signals filtering.
Signals
A GKD-C Confirmation indicator can be used as either a Confirmation 1, Confirmation 2, or Solo Confirmation indicator. See step 3 & 4 of the NNFX algorithm above to understand how this indicator fits into the GKD trading system. The Solo Confirmation setting allows you to test this indicator by itself without an additional GKD-C indicator present in the GKD protocol chain.
On the chart shown above, this indicator is shown as GKD-C DiNapoli Stochastic and is set to Solo Confirmation. The GKD-B Baseline, GKD-V Volatility Ratio, and this indicator satisfy the first three steps in the GKD trading system chain: GKD-B => GKD-V => GKD-C(solo).
The signals from each of these settings are as follows:
Confirmation 1 Signal
Initial Long (L): DiNapoli Stochastic crosses-up over middle-line*
Initial Short (S): DiNapoli Stochastic crosses-down under middle-line*
Continuation Long (CL): DiNapoli Stochastic is over middle-line, then crosses-up over the signal**
Continuation Short (CS): DiNapoli Stochastic is under middle-line, then crosses-down under the signal**
Post Baseline Cross Long (BL): DiNapoli Stochastic crossed-up over middle-line but Baseline is still in downtrend, then Baseline turns to uptrend within XX bars***
Post Baseline Cross Short (BS): DiNapoli Stochastic crossed-down under middle-line but Baseline is still in uptrend, then Baseline turns to downtrend within XX bars***
BL Recovery Continuation Long (RL): DiNapoli Stochastic is above middle-line. Baseline already crossed down into downtrend, then baseline crosses back up to uptrend; then, DiNapoli Stochastic crosses-up over the signal****
BL Recovery Continuation Short (RS): DiNapoli Stochastic is below middle-line. Baseline already crossed up into uptrend, then baseline crosses back down to downtrend; then, DiNapoli Stochastic crosses-down under the signal****
*All signals are shown regardless of Baseline and Volatility/Volume qualification
**All signals are shown regardless of Baseline qualification; however, when Baseline filter is active, only true continuations are shown. When the Baseline filter is not active, then all continuations are shown. True continuations are when the Baseline is active and maintains its uptrend/downtrend after the initial cross-up/cross-down over the middle-line respectively. This means that if the Baseline trend then moves against the DiNapoli Stochastic then any continuation signals are voided until another initial Long/Short. All continuations are will either show as regular continuations or be converted into recovery continuations
***All signals are shown regardless of Volatility/Volume qualification
****When the Baseline filter is active, some regular continuations are converted to recovery continuations and are shown. When the Baseline filter is not active, then these signals are not shown.
Confirmation 2 Signal
Initial Long (L): DiNapoli Stochastic crosses-up over middle-line*
Initial Short (S): DiNapoli Stochastic crosses-down under middle-line*
Continuation Long (CL): DiNapoli Stochastic is over middle-line, then crosses-up over the signal**
Continuation Short (CS): DiNapoli Stochastic is under middle-line, then crosses-down under the signal**
Post Baseline Cross Long (BL): DiNapoli Stochastic crossed-up over middle-line but Baseline is still in downtrend, then Baseline turns to uptrend within XX bars***
Post Baseline Cross Short (BS): DiNapoli Stochastic crossed-down under middle-line but Baseline is still in uptrend, then Baseline turns to downtrend within XX bars***
BL Recovery Continuation Long (RL): DiNapoli Stochastic is above middle-line. Baseline already crossed down into downtrend, then baseline crosses back up to uptrend while DiNapoli Stochastic is still above middle-line; then, DiNapoli Stochastic crosses-up over the signal****
BL Recovery Continuation Short (RS): DiNapoli Stochastic is below middle-line. Baseline already crossed up into uptrend, then baseline crosses back down to downtrend while DiNapoli Stochastic is still below middle-line; then, DiNapoli Stochastic crosses-down under the signal****
*All signals are shown regardless of Baseline and Volatility/Volume qualification
**All signals are shown regardless of Baseline qualification; however, when Baseline filter is active, only true continuations are shown. When the Baseline filter is not active, then all continuations are shown. True continuations are when the Baseline is active and maintains its uptrend/downtrend after the initial cross-up/cross-down over the middle-line respectively. This means that if the Baseline trend then moves against the DiNapoli Stochastic then any continuation signals are voided until another initial Long/Short. All continuations are will either show as regular continuations or be converted into recovery continuations
***All signals are shown regardless of Volatility/Volume qualification
****When the Baseline filter is active, some regular continuations are converted to recovery continuations and are shown. When the Baseline filter is not active, then these signals are not shown.
Confirmation 2 Confluence Background Color Signals; Confirmation Order: Regular; Confirmation Type: Confirmation 1
Initial Long (L): The imported GKD-C Confirmation 1 indicator crosses-up over middle-line, then DiNapoli Stochastic crosses-up over the middle-line on the same bar or "Number of Bars Confirmation" bars in the future (see X-bar rule below)
Initial Short (S): The imported GKD-C Confirmation 1 indicator crosses-down under middle-line, then DiNapoli Stochastic crosses-down under the middle-line on the same bar or "Number of Bars Confirmation" bars in the future (see X-bar rule below)
Continuation Long Confirmation 1 (CL): The imported GKD-C Confirmation 1 indicator is over middle-line, then crosses-up over the signal
Continuation Short Confirmation 1 (CS): The imported GKD-C Confirmation 1 indicator is under middle-line, then crosses-down under the signal
Post Baseline Cross Long (BL): The imported GKD-C Confirmation 1 crossed-up over middle-line but Baseline is still in downtrend; and DiNapoli Stochastic crossed-up over middle-line on the same bar or XX bars in the future but Baseline is still in downtrend; then Baseline turns to uptrend within "Maximum Allowable PSBC Bars Back" bars (see X-bar rule below)
Post Baseline Cross Short (BS): The imported GKD-C Confirmation 1 crossed-down under middle-line but Baseline is still in uptrend; and, DiNapoli Stochastic crossed-down under middle-line on the same bar or XX bars in the future but Baseline is still in uptrend; then Baseline turns to downtrend within "Maximum Allowable PSBC Bars Back" bars (see X-bar rule below)
BL Recovery Continuation Long (RL): The imported GKD-C Confirmation 1 indicator is above middle-line. Baseline already crossed down into downtrend, then baseline crosses back up to uptrend while DiNapoli Stochastic is still above middle-line; then, The imported GKD-C Confirmation 1 crosses-up over the signal
BL Recovery Continuation Short (RS): The imported GKD-C Confirmation 1 indicator is below middle-line. Baseline already crossed up into uptrend, then baseline crosses back down to downtrend while DiNapoli Stochastic is still below middle-line; then, The imported GKD-C Confirmation 1 crosses-down under the signal
Confirmation 2 Confluence Background Color Signals; Confirmation Order: Regular; Confirmation Type: Confirmation 2
Initial Long (L): same as Confirmation 2 Confluence Background Color Signals; Confirmation Order: Regular; Confirmation Type: Confirmation 1
Initial Short (S): same as Confirmation 2 Confluence Background Color Signals; Confirmation Order: Regular; Confirmation Type: Confirmation 1
Continuation Long Confirmation 2 (CL): DiNapoli Stochastic is over middle-line, then crosses-up over the signal
Continuation Short Confirmation 2 (CS): DiNapoli Stochastic is under middle-line, then crosses-down under the signal
Post Baseline Cross Long (BL): same as Confirmation 2 Confluence Background Color Signals; Confirmation Order: Regular; Confirmation Type: Confirmation 1
Post Baseline Cross Short (BS): same as Confirmation 2 Confluence Background Color Signals; Confirmation Order: Regular; Confirmation Type: Confirmation 1
BL Recovery Continuation Long (RL): DiNapoli Stochastic is above middle-line. Baseline already crossed down into downtrend, then baseline crosses back up to uptrend; then, DiNapoli Stochastic crosses-up over the signal
BL Recovery Continuation Short (RS): DiNapoli Stochastic is below middle-line. Baseline already crossed up into uptrend, then baseline crosses back down to downtrend; then, DiNapoli Stochastic crosses-down under the signal
Confirmation 2 Confluence Background Color Signals; Confirmation Order: Regular; Confirmation Type: Both
Initial Long (L): same as Confirmation 2 Confluence Background Color Signals; Confirmation Order: Regular; Confirmation Type: Confirmation 1
Initial Short (S): same as Confirmation 2 Confluence Background Color Signals; Confirmation Order: Regular; Confirmation Type: Confirmation 1
Continuation Long Confirmation 2 (CL): The imported GKD-C Confirmation 1 indicator is over middle-line, then crosses-up over the signal; DiNapoli Stochastic is over middle-line, then crosses-up over the signal within "Number of Bars Confirmation" bars in the future
Continuation Short Confirmation 2 (CS): The imported GKD-C Confirmation 1 indicator is under middle-line, then crosses-down under the signal; DiNapoli Stochastic is under middle-line, then crosses-down under the signal within "Number of Bars Confirmation" bars in the future
Post Baseline Cross Long (BL): same as Confirmation 2 Confluence Background Color Signals; Confirmation Order: Regular; Confirmation Type: Confirmation 1
Post Baseline Cross Short (BS): same as Confirmation 2 Confluence Background Color Signals; Confirmation Order: Regular; Confirmation Type: Confirmation 1
BL Recovery Continuation Long (RL): The imported GKD-C Confirmation 1 indicator is above middle-line and DiNapoli Stochastic is above middle-line. Baseline already crossed down into downtrend, then baseline crosses back up to uptrend; then, the imported GKD-C Confirmation 1 crosses-up over its signal, and DiNapoli Stochastic crosses-up over its signal within "Number of Bars Confirmation" bars in the future
BL Recovery Continuation Short (RS): The imported GKD-C Confirmation 1 indicator is below middle-line and DiNapoli Stochastic is below middle-line. Baseline already crossed up into uptrend, then baseline crosses back down to downtrend; then, the imported GKD-C Confirmation 1 crosses-down under its signal, and DiNapoli Stochastic crosses-down under its signal within "Number of Bars Confirmation" bars in the future
Confirmation 2 Confluence Background Color Signals; Confirmation Order: Both; Confirmation Type: (continuations don't change from the variations above)
Initial Long (L): The imported GKD-C Confirmation 1 indicator crosses-up over middle-line, then DiNapoli Stochastic crosses-up over the middle-line on the same bar or "Number of Bars Confirmation" bars in the future (see X-bar rule below); OR, DiNapoli Stochastic crosses-up over middle-line, then the imported GKD-C Confirmation 1 indicator crosses-up over the middle-line on the same bar or "Number of Bars Confirmation" bars in the future (see X-bar rule below)
Initial Short (S): The imported GKD-C Confirmation 1 indicator crosses-down under middle-line, then DiNapoli Stochastic crosses-down under the middle-line on the same bar or "Number of Bars Confirmation" bars in the future (see X-bar rule below); OR, DiNapoli Stochastic crosses-down under middle-line, then the imported GKD-C Confirmation 1 indicator crosses-down under the middle-line on the same bar or "Number of Bars Confirmation" bars in the future (see X-bar rule below)
Post Baseline Cross Long (BL): The imported GKD-C Confirmation 1 crossed-down under middle-line but Baseline is still in uptrend; and, DiNapoli Stochastic crossed-down under middle-line on the same bar or XX bars in the future but Baseline is still in uptrend; then Baseline turns to downtrend within "Maximum Allowable PSBC Bars Back" bars (see X-bar rule below); OR, DiNapoli Stochastic crossed-down under middle-line but Baseline is still in uptrend; and, the imported GKD-C Confirmation 1 crossed-down under middle-line on the same bar or XX bars in the future but Baseline is still in uptrend; then Baseline turns to downtrend within "Maximum Allowable PSBC Bars Back" bars (see X-bar rule below)
Post Baseline Cross Short (BS): The imported GKD-C Confirmation 1 crossed-down under middle-line but Baseline is still in uptrend; and, DiNapoli Stochastic crossed-down under middle-line on the same bar or XX bars in the future but Baseline is still in uptrend; then Baseline turns to downtrend within "Maximum Allowable PSBC Bars Back" bars (see X-bar rule below); OR, DiNapoli Stochastic crossed-down under middle-line but Baseline is still in uptrend; and, the imported GKD-C Confirmation 1 crossed-down under middle-line on the same bar or XX bars in the future but Baseline is still in uptrend; then Baseline turns to downtrend within "Maximum Allowable PSBC Bars Back" bars (see X-bar rule below)
Solo Confirmation Signals
Initial Long (L): DiNapoli Stochastic crosses-up over middle-line
Initial Short (S): DiNapoli Stochastic crosses-down under middle-line
Continuation Long (CL): DiNapoli Stochastic is over middle-line, then crosses-up over the signal
Continuation Short (CS): DiNapoli Stochastic is under middle-line, then crosses-down under the signal
Post Baseline Cross Long (BL): DiNapoli Stochastic crossed-up over middle-line but Baseline is still in downtrend, then Baseline turns to uptrend within XX bars
Post Baseline Cross Short (BS): DiNapoli Stochastic crossed-down under middle-line but Baseline is still in uptrend, then Baseline turns to downtrend within XX bars
BL Recovery Continuation Long (RL): DiNapoli Stochastic above middle-line. Baseline already crossed down into downtrend, then baseline crosses back up to uptrend while DiNapoli Stochastic is still above middle-line
BL Recovery Continuation Short (RS): DiNapoli Stochastic below middle-line. Baseline already crossed up into uptrend, then baseline crosses back down to downtrend while DiNapoli Stochastic is still below middle-line
X-bar Rule settings
This rule only applies when this indicator "Confirmation Type" set to "Confirmation 2"
Requirements
Inputs: Confirmation 1 and Solo Confirmation: GKD-V Volatility/Volume indicator; Confiration 2: GKD-C Confirmation indicator
Output: Confirmation 2 and Solo Confirmation: GKD-E Exit indicator; Confiration 1: GKD-C Confirmation indicator
Additional features will be added in future releases.
This indicator is only available to ALGX Trading VIP group members . You can see the Author's Instructions below to get more information on how to get access.
Better DiNapoli Stoch oscillator with buy/sell signals and alertThis version of Joe DiNapoli stochastic oscillator uses only one line for a better overview. Signals are displayed as soon as the line exceeds or falls below the center line. Also the candle color changes with this signal.
Alarms can also be set for these signals.
As long as the current candle is not closed, the line is displayed in yellow.
The following settings can be made:
- Lockback periode for highest high and lowest low
- Smoothing
- Candle Color
- Stochastic line color
This indicator works well with indicators such as EMA or others.
Have fun using it.

Dinapoli Thrust ScannerThis is a Multi-Timeframe Dinapoli Thrust Scanner that works on the market displayed on screen and searches for Thrusts within this market along Higher Timeframes.
This tool is an aid to the trader and shouldn't be used in automated trading. As any Dinapoli trader would know, the Thrust pattern recognition requires visual approval from the trader.
The Thrust Scanner can display the following information onscreen:
A Multi-Timeframe Table that colors to indicate Recent/Current Thrusts. Green color signals a potential Up Thrusts, whilst red color signals a potential Down Thrust.
The DMA line that helps you trade the Thrusts according to Bread'n Butter or Double Repo patterns.
Candle Labels that point the Thrusts being detected directly on the chart.
The Thrust Scanner has a Sensitivity Control which allows the trader to customize the accuracy of the scanner://
The stricter the setting, the lesser the number of potential Thrust that qualify, and therefore the more accurate the Thrust detection.
The looser the setting, the more number of potential Thrust being detected, but also the more Look Alikes (LaL) or false positives there will be.
Note: The scanner is resource hungry, and sometimes it might need some seconds to fully display the data.

DiNapoli Control PanelThis indicator displays a matrix containing a customized set of Dinapoli indicator readings from Higher Timeframes. It works as a Control Panel to properly monitor multiple layers of the market at an eye glance.
It's capable of displaying any combination of data, from a brief light panel to a full data table summarizing all relevant Dinapoli Indicators.
Only Higher Timeframes states do appear in the table. Lower Timeframes are hidden due to inability to get reliable results for such behaviour in current Tradingview environment.
By default only 5 timeframes get activated: 1H, 4H, 1D, 1W and 1M. But many more are available to be displayed throught the Input Tab.
The position of the table can be customized through the input panel.
Note: The indicator is resource hungry, and sometimes it might need some seconds to fully populate the table.
DiNapoli Candles TableThis indicator displays a matrix containing the color states of Dinapoli candles from Higher Timeframes.
Only Higher Timeframes states do appear in the table. Lower Timeframes are hidden due to inability to get reliable results for such behaviour in current Tradingview environment.
By default only 5 timeframes get activated: 1H, 4H, 1D, 1W and 1M. But many more are available to be displayed throught the Input Tab.
The position of the table can be customized through the input panel.
Note: The indicator is resource hungry, and sometimes it might need some seconds to fully populate the table.
DiNapoli DMA TableThis indicator displays a table containing the Displaced Moving Averages (DMA) from Current and Higher Timeframes: a green background denotes a Bullish Market in relation to that particular DMA, and a red one denotes a Bearish Market.
Only Higher Timeframes states do appear in the table. Lower Timeframes are grayed out, due to inability to get reliable results for such behaviour in current Tradingview environment.
The position of the table can be customized through the input panel.
Note: This indicator is demanding in terms of resources, and it might take some seconds to fully populate the table.

DiNapoli Oscillator Predictor TableThis indicator displays a table containing the Oscillator Predictor Overbought (OB) and Oversold Levels (OS) from Higher Timeframes: a green background denotes a market above OB in that particular timeframe, and a red one denotes an OS market.
It allows displaying current and future Predictor values.
Only Higher Timeframes states do appear in the table. Lower Timeframes are grayed out, due to inability to get reliable results for such behaviour in current Tradingview environment.
The position of the table can be customized through the input panel.
Note: This indicator is quite demanding in terms of resources, and it might take some seconds to fully populate the table.

DiNapoli Stochastic Predictor TableThis indicator displays a table containing the Stochastic Predictor states from Higher Timeframes: a green background denotes a bullish predictor in that particular timeframe, and a red one denotes a bearish predictor.
It allows displaying current and future Predictor values.
And it also has the option to display the Stochastic Level Predictor Bull/Bear state and values.
Only Higher Timeframes states do appear in the table. Lower Timeframes are grayed out, due to inability to get reliable results for such behaviour in current Tradingview environment.
The position of the table can be customized through the input panel.
Note: The indicator is resource hungry, and sometimes it might need some seconds to fully populate the table.

DiNapoli MACD Predictor TableThis indicator displays a table containing the MACD Predictor states from Higher Timeframes: a green background denotes a bullish predictor in that particular timeframe, and a red one denotes a bearish predictor.
Only Higher Timeframes states do appear in the table. Lower Timeframes are grayed out, due to inability to get reliable results for such behaviour in current Tradingview environment.
The position of the table can be customized through the input panel.
Note: The indicator is resource hungry, and sometimes it might need some seconds to fully populate the table.

Dinapoli LevelsThis indicator displays Fibonacci levels in a clearer way. That helps to identify Confluence and Agreement zones.
Once the indicator is added to a chart, you must select the A-B focus points:
In an Up Swing, the A-point would be the Low Pivot and the B-point would be the High Pivot.
In a Down Swing, the A-point would be the High Pivot and the B-point would be the Low Pivot.
Due to Tradingview limitations, the indicator needs to be deleted and re-added to the chart every time you need to draw new levels.
The indicator can be added as many times as D-Levels you indend to display.
Here are its main features:
Select which levels to display for each instance of the indicator (F3, F4, F5).
Customize the color for each level.
Display the price tag.
Customize the distance to the right at which the levels are displayed.
Customize the width of the levels.
Customize the thickness of the lines.

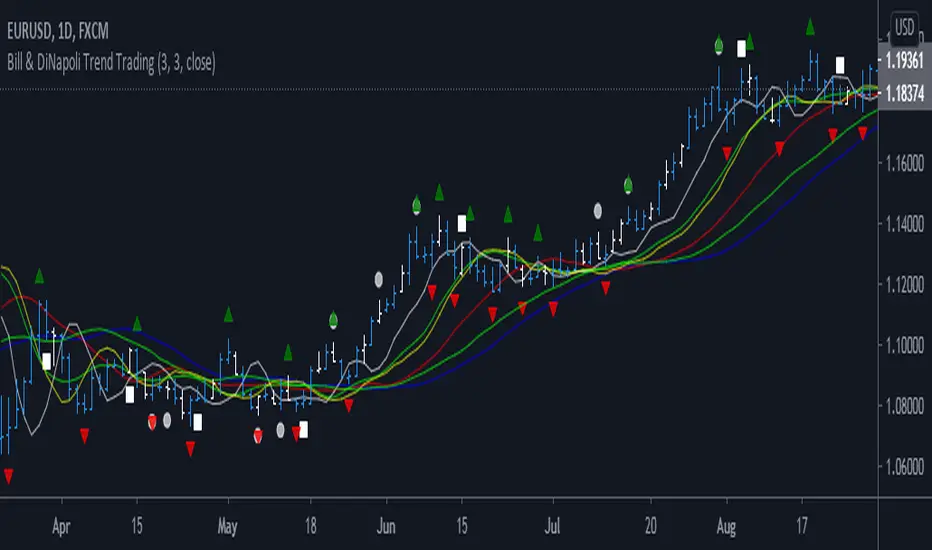
Bill & DiNapoli TradingThis Indicator is a pack of set of Indicators. I am a Bill Williams Chaos and DiNapoli system trader. It includes following indicators,
1. Wiseman 1 - Divergent Bar indicated by Circle. Angulation to be manually observed
2. Wiseman 2 - The Super AO signal, indicated by a square
3. Wiseman 3 - Bill William's Fractal indicated as Triangle
4. DiNapoli DMA1 - 3 Bar SMA, Shifted 3 Periods forward
5. DiNapoli DMA2 - 7 Bar SMA, Shifted 5 Periods forward
6. DiNapoli DMA3 - 25 Bar SMA, Shifted 5 Periods forward
7. Squat Bar - Bill William's Trading System
You can check out Bill Willam's Trading Chaos 2nd Edition and DiNapoli Level Book
DiNapoli MACD MTFSimple oscillator, based on formula from Joe Dinapoli for MACD oscillator. Simply it's analysing current timeframe (bottom row) and 2 higher timeframes.

Combo Strategy 123 Reversal & DiNapoli Detrended Oscillator This is combo strategies for get a cumulative signal.
First strategy
This System was created from the Book "How I Tripled My Money In The
Futures Market" by Ulf Jensen, Page 183. This is reverse type of strategies.
The strategy buys at market, if close price is higher than the previous close
during 2 days and the meaning of 9-days Stochastic Slow Oscillator is lower than 50.
The strategy sells at market, if close price is lower than the previous close price
during 2 days and the meaning of 9-days Stochastic Fast Oscillator is higher than 50.
Second strategy
DiNapoli Detrended Oscillator Strategy
WARNING:
- For purpose educate only
- This script to change bars colors.

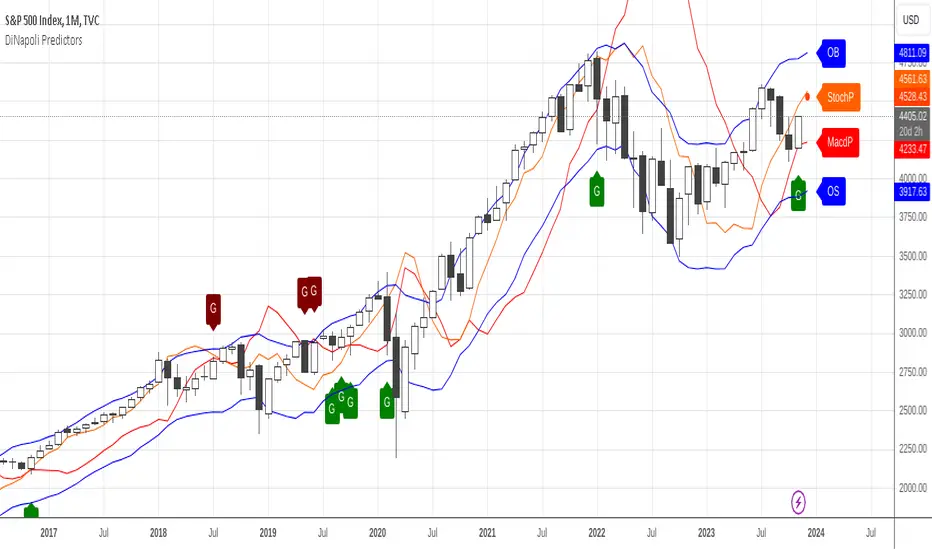
DiNapoli Bundle PredictorsThis Premium Indicator allows to plot the following DiNapoli Predictors Tools into the price chart:
Momentum Predictors based on:
MACD Predictor
Stochastic Predictor
OB/OS Predictors based on:
Oscillator Predictor
Stochastic Predictor
If you would like to subscribe , please send me a private message.
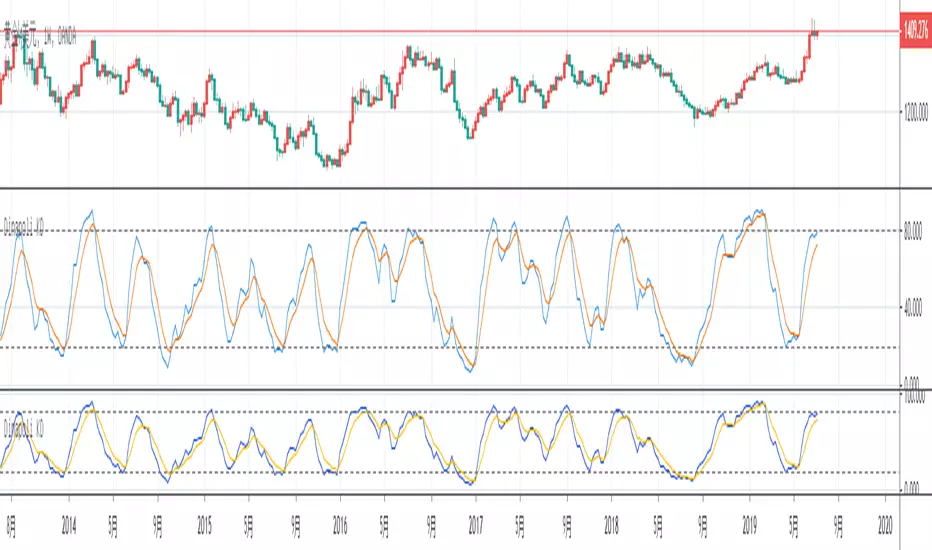
DiNapoli Stochastic PredictorStochastic Predictor is a brand new development to the toolkit of DiNapoli traders.
This indicator allows us to identify the price points at which the Stochastic might shift. These points often operate as Support and Resistance.
If you'd like to subscribe to this one or other DiNapoli indicators, please drop me a private message.

Displaced Moving Averages(@Solidus999)This is proposal indicater in Joe Dinapoli.
He is use in order to trade.
I made because I was not in the trading view :)

Synchronicity 3 Displaced SMAsA simple, clean script that displays three simple moving averages and allows you to displace them forward by a number of bars. I have set the defaults to
Period, 3 Shift, 3
Period, 7 Shift, 5
Period, 25 Shift, 25
These are the defaults for use with Joe DiNapoli strategies.
Further changes to make them fore flexible, like switching each one on or off may come if required.
No donations sought, just a wee like if you like it.

DiNapoli Displaced Moving AveragesDisplaced Moving Averages as described in the book Trading the DiNapoli Levels
using displaced SMA:
3x3
7x5
25x5
