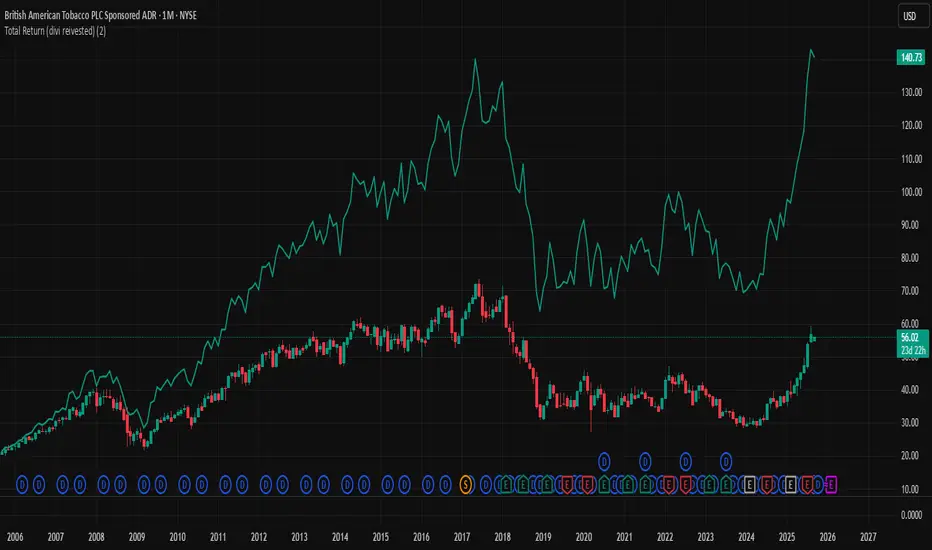
Total Return (divi reivested)Total Return (Dividends Reinvested) — Price Scale
This indicator overlays a Total Return price line on the chart. It shows how the stock would have performed if all dividends had been reinvested back into the stock (buying fractional shares) rather than taken as cash.
The line starts exactly at the price level of the first visible bar on your chart and moves in the same price units as the chart (not indexed to 100).
Until the first dividend inside the visible window, the Total Return line is identical to the price. From the first dividend onward, it gradually diverges upwards, reflecting the effect of reinvested payouts.
Settings:
Reinvest at Open / Close — Choose whether reinvestment uses the bar’s open or close price.
Apply effect on the next bar — If enabled, reinvestment shows up from the bar after the dividend date (common in practice).
Show dividend markers — Optionally plots labels where dividend events occur.
Line width — Adjusts the thickness of the plotted Total Return line.
Use case:
This tool is useful if you want to compare plain price performance with true shareholder returns including dividends. It helps evaluate dividend stocks (like BTI, T, XOM, etc.) more realistically.
Dividend
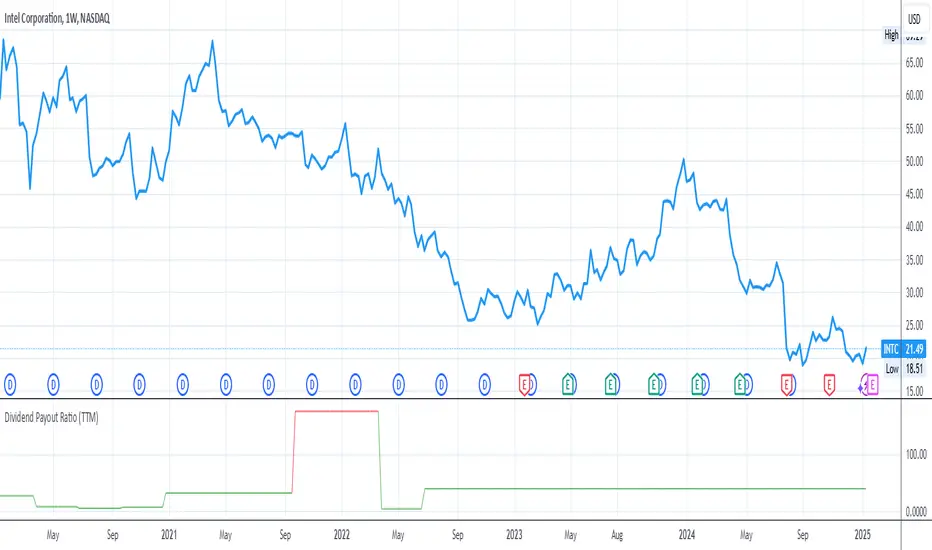
Dividend Payout RatioShows the dividend payout ratio for the specific stock.
The dividend payout ratio indicates if the dividend payout is sustainable in the long run. Therefore,
1. A dividend payout under 50% is considered sustainable. The line will be green
2. A dividend payout over 50% and under 100%, the line will be yellow, is considered a stock to investigate since the dividend payout may have to be cut in the future which will cause the stock price to crash.
3. A dividend payout over 100%, the line will be red, is considered unsustainable and the dividend payout will most likely be cut in the near future. It can take up to a few years for the dividend cut to happen if the financials do not improve.
If the dividend payout ratio is over 100%, this means that the company is paying a dividend amount over $1 for every $1 earned. Therefore, the company must borrow money or find another source to pay the dividend amount that the company cannot afford to pay with the current earnings.
Calculating the dividend payout ratio:
Divide dividend paid by earnings after tax and multiplying the result by 100%.
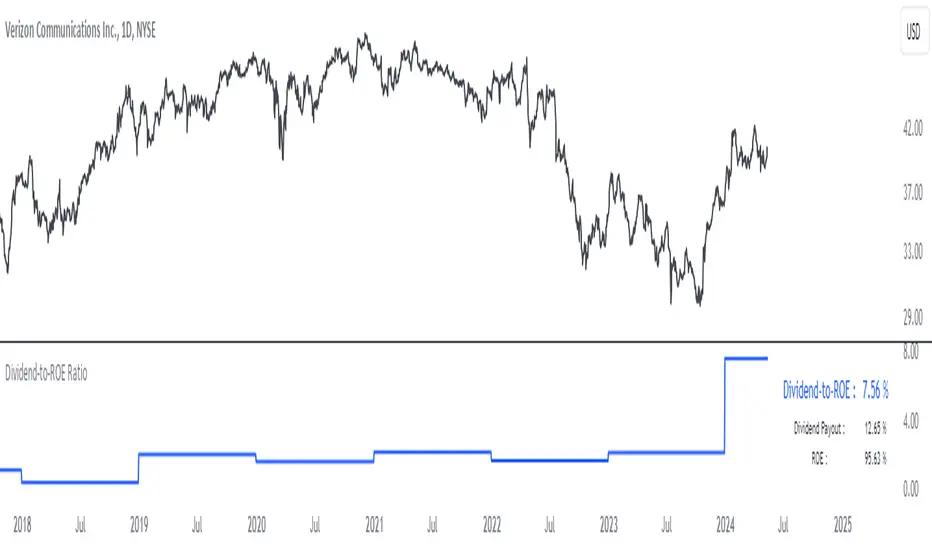
Dividend-to-ROE RatioDividend-to-ROE Ratio Indicator
The Dividend-to-ROE Ratio indicator offers valuable insights into a company's dividend distribution relative to its profitability, specifically comparing the Dividend Payout Ratio (proportion of earnings as dividends) to the Return on Equity (ROE), a measure of profitability from shareholder equity.
Interpretation:
1. Higher Ratio: A higher Dividend-to-ROE Ratio suggests a stable dividend policy, where a significant portion of earnings is returned to shareholders. This can indicate consistent dividend payments, often appealing to income-seeking investors.
2. Lower Ratio: Conversely, a lower ratio implies that the company retains more earnings for growth, potentially signaling a focus on reinvestment for future expansion rather than immediate dividend payouts.
3. Excessively High Ratio: An exceptionally high ratio may raise concerns. While it could reflect a generous dividend policy, excessively high ratios might indicate that a company is distributing more earnings than it can sustainably afford. This could potentially hinder the company's ability to reinvest in its operations, research, or navigate economic downturns effectively.
Utility and Applications:
The Dividend-to-ROE Ratio can be particularly useful in the following scenarios:
1. Income-Oriented Investors: For investors seeking consistent dividend income, a higher ratio signifies a company's commitment to distributing profits to shareholders, potentially aligning with income-oriented investment strategies.
2. Financial Health Assessment: Analysts and stakeholders can use this ratio to gauge a company's financial health and dividend sustainability. It provides insights into management's capital allocation decisions and strategic focus.
3. Comparative Analysis: When comparing companies within the same industry, this ratio helps in benchmarking dividend policies and identifying outliers with unusually high or low ratios.
Considerations:
1. Contextual Analysis: Interpretation should be contextualized within industry standards and the company's financial history. Comparing the ratio with peers in the same sector can provide meaningful insights.
2. Financial Health: It's crucial to evaluate this indicator alongside other financial metrics (like cash flow, debt levels, and profit margins) to grasp the company's overall financial health and sustainability of its dividend policy.
Disclaimer: This indicator is for informational purposes only and does not constitute financial advice. Investors should conduct thorough research and consult with financial professionals before making investment decisions based on this ratio.
Dividend Calendar (Zeiierman)█ Overview
The Dividend Calendar is a financial tool designed for investors and analysts in the stock market. Its primary function is to provide a schedule of expected dividend payouts from various companies.
Dividends, which are portions of a company's earnings distributed to shareholders, represent a return on their investment. This calendar is particularly crucial for investors who prioritize dividend income, as it enables them to plan and manage their investment strategies with greater effectiveness. By offering a comprehensive overview of when dividends are due, the Dividend Calendar aids in informed decision-making, allowing investors to time their purchases and sales of stocks to optimize their dividend income. Additionally, it can be a valuable tool for forecasting cash flow and assessing the financial health and dividend-paying consistency of different companies.
█ How to Use
Dividend Yield Analysis:
By tracking dividend growth and payouts, traders can identify stocks with attractive dividend yields. This is particularly useful for income-focused investors who prioritize steady cash flow from their investments.
Income Planning:
For those relying on dividends as a source of income, the calendar helps in forecasting income.
Trend Identification:
Analyzing the growth rates of dividends helps in identifying long-term trends in a company's financial health. Consistently increasing dividends can be a sign of a company's strong financial position, while decreasing dividends might signal potential issues.
Portfolio Diversification:
The tool can assist in diversifying a portfolio by identifying a range of dividend-paying stocks across different sectors. This can help mitigate risk as different sectors may react differently to market conditions.
Timing Investments:
For those who follow a dividend capture strategy, this indicator can be invaluable. It can help in timing the buying and selling of stocks around their ex-dividend dates to maximize dividend income.
█ How it Works
This script is a comprehensive tool for tracking and analyzing stock dividend data. It calculates growth rates, monthly and yearly totals, and allows for custom date handling. Structured to be visually informative, it provides tables and alerts for the easy monitoring of dividend-paying stocks.
Data Retrieval and Estimation: It fetches dividend payout times and amounts for a list of stocks. The script also estimates future values based on historical data.
Growth Analysis: It calculates the average growth rate of dividend payments for each stock, providing insights into dividend consistency and growth over time.
Summation and Aggregation: The script sums up dividends on a monthly and yearly basis, allowing for a clear view of total payouts.
Customization and Alerts: Users can input custom months for dividend tracking. The script also generates alerts for upcoming or current dividend payouts.
Visualization: It produces various tables and visual representations, including full calendar views and income tables, to display the dividend data in an easily understandable format.
█ Settings
Overview:
Currency:
Description: This setting allows the user to specify the currency in which dividend values are displayed. By default, it's set to USD, but users can change it to their local currency.
Impact: Changing this value alters the currency denomination for all dividend values displayed by the script.
Ex-Date or Pay-Date:
Description: Users can select whether to show the Ex-dividend day or the Actual Payout day.
Impact: This changes the reference date for dividend data, affecting the timing of when dividends are shown as due or paid.
Estimate Forward:
Description: Enables traders to predict future dividends based on historical data.
Impact: When enabled, the script estimates future dividend payments, providing a forward-looking view of potential income.
Dividend Table Design:
Description: Choose between viewing the full dividend calendar, just the cumulative monthly dividend, or a summary view.
Impact: This alters the format and extent of the dividend data displayed, catering to different levels of detail a user might require.
Show Dividend Growth:
Description: Users can enable dividend growth tracking over a specified number of years.
Impact: When enabled, the script displays the growth rate of dividends over the selected number of years, providing insight into dividend trends.
Customize Stocks & User Inputs:
This setting allows users to customize the stocks they track, the number of shares they hold, the dividend payout amount, and the payout months.
Impact: Users can tailor the script to their specific portfolio, making the dividend data more relevant and personalized to their investments.
-----------------
Disclaimer
The information contained in my Scripts/Indicators/Ideas/Algos/Systems does not constitute financial advice or a solicitation to buy or sell any securities of any type. I will not accept liability for any loss or damage, including without limitation any loss of profit, which may arise directly or indirectly from the use of or reliance on such information.
All investments involve risk, and the past performance of a security, industry, sector, market, financial product, trading strategy, backtest, or individual's trading does not guarantee future results or returns. Investors are fully responsible for any investment decisions they make. Such decisions should be based solely on an evaluation of their financial circumstances, investment objectives, risk tolerance, and liquidity needs.
My Scripts/Indicators/Ideas/Algos/Systems are only for educational purposes!

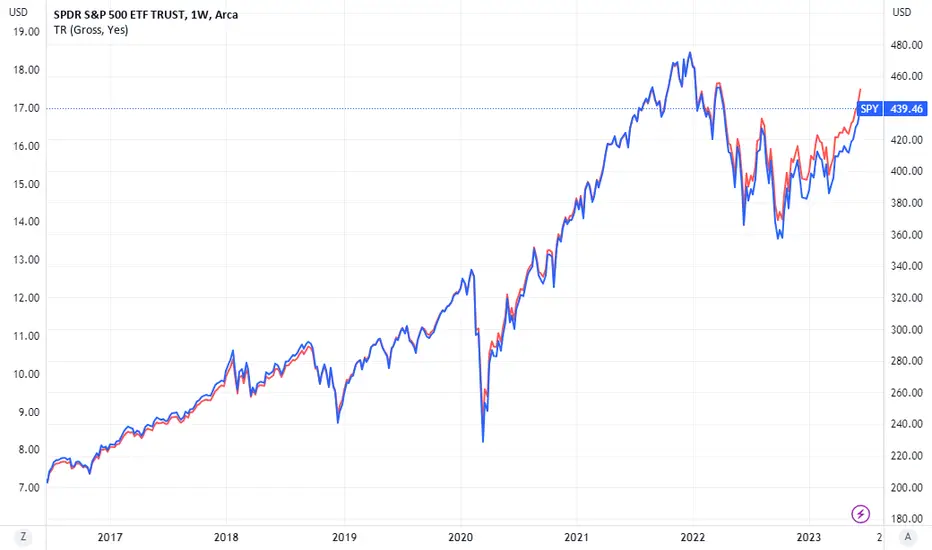
Total ReturnThis script calculates a Total Return index for stocks that shows the total performance of a stock, incorporating returns from both the share price and dividends.
To understand this, consider the situation where you invest in a 5% div stock and hold the position for 10 years. Assume at the end of 10 years, the price has gone up by 50%. A price chart will then show a 50% return, but in reality the investor has also received 50% of the initial investment in dividends, making his total return substantially more. Exactly how much more depends on whether the investor reinvested the dividends in the stock, or just held them as cash. If the former, his total return will be well over 100%; in the latter, his total return will be 100% exactly.
There are 2 input options:
- Dividend type: allows the user to choose "gross" or "net". Note that most stocks will have a "gross" data series whereas many will not have a "net" series.
- Reinvestment: allows the user to choose whether dividends should be reinvested in the stock ("Yes") or held in cash ("No").
Total return formula:
- With reinvestment: log((today's closing price + dividends paid today) / (yesterday's closing price))
- Without reinvestment: log(today's closing price / yesterday's closing price) + log (dividends paid thus far / first closing price)
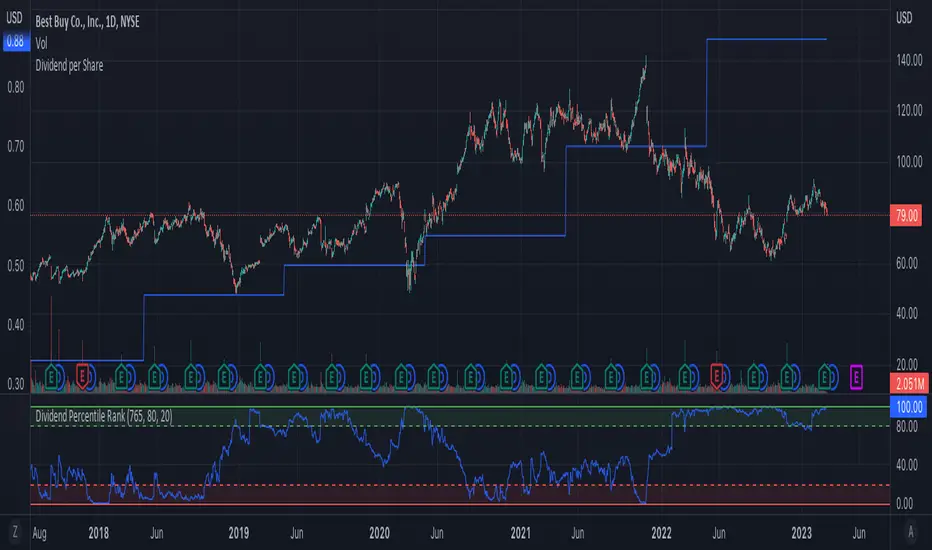
Dividend Percentile RankWhat it does
The Indicator plots the percentile rank of the current dividend yield within the configured lookback timeframe. A percentile rank of 80 means that in 80% of the time within the lookback period the dividend yield was below the current yield. And in the remaining 20% of the time it was above the current yield. While a percentile rank of 0 means that the current dividend yield is below all historical dividend yields within the lookback timeframe.
You can configure three values:
1. Lookback Trading Days: This is the timeframe of past trading days that are used to calculate the percentile rank. The default value is 765 days (~3years) while one trading year is about 252 days.
2. Buy threshold in %: Configures the green zone of the Dividend Percentile Chart
3. Buy threshold in %: Configures the red zone of the Dividend Percentile Chart
How it works
First, the Dividend Yield is calculated. After that, the dividend Yield is used to calculate the percentage rank within the configured lookback period. The result is plotted depending on the configured threshold zones.
What you can use it for
The Dividend Percentile Rank is plotted as an oscillator that oscillates between 0 and 100.
High values, e.g. above 80, can be considered as a buy signal as the current dividend yield is high in comparison to past dividend yields.
Low values, e.g. below 20, can be considered as a sell signal as the current dividend yield is lower in comparison to past dividend yields.
(PS: Always take into consideration to evaluate the companies ability to continue paying dividends in the future. The yield alone is no guarantee for high returns)
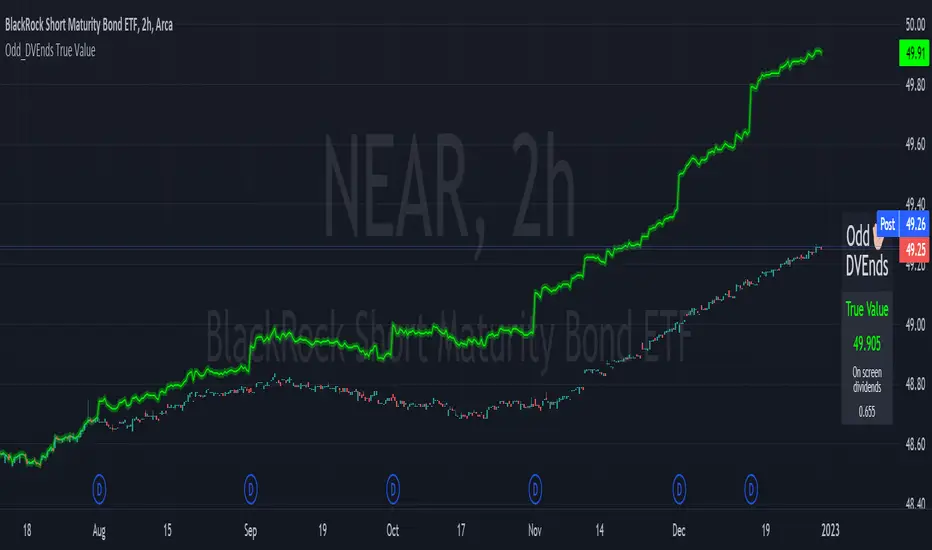
Odd_DVEnds Dividend True Value💸 True Value = Close Price + Accumulated Dividends
◆ Using only the time displayed on screen of the chart, the script will calculate the True Value of the symbol. (Calculations start from first bar you can see to the last bar you can see.)
Why do you need the true value?
Anytime an asset pays a dividend the current market price doesn't reflect the actual value you would have received over time from holding said asset. Without this price information fairly comparing assets is difficult.
🗻 Selectable themed legend
🎨 Highly Customizable
⚠️ As of the first release moving multiple charts on the same layout using sync will not always update all charts. Its recommended to use the bottom toolbar to move times if using indicator on multiple charts. Check for updates to see if this has been resolved.
Dividend Pension TableHello, you all know about dividend retirement.
It was very difficult to calculate the retirement with dividends by making regular purchases in shares. Thanks to this tool, it is now very easy.
You can start the strategy by choosing the history of the dividend investment, choosing how many units you will receive in a regular amount each month, or the value for money.
In the table on the side, you will see the amount of your regular purchases, dividend income and the amount of your purchases.
Your total investment and savings will also be visible at the top of the chart.
With this table, you will be able to see the analysis of all dividend-paying stocks. Excel era is over :)

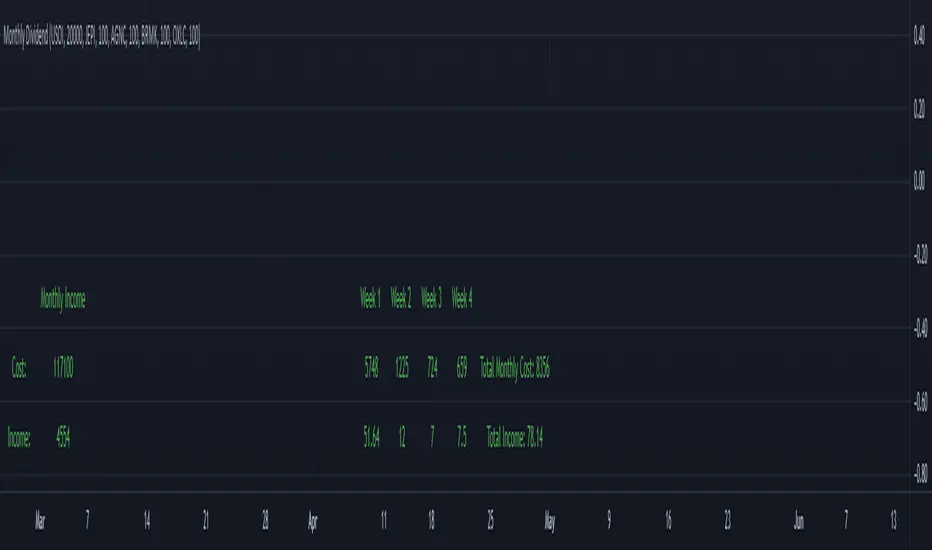
Monthly DividendThis script allows you to quickly estimate your monthly income based on the dividend payout and the number of share.
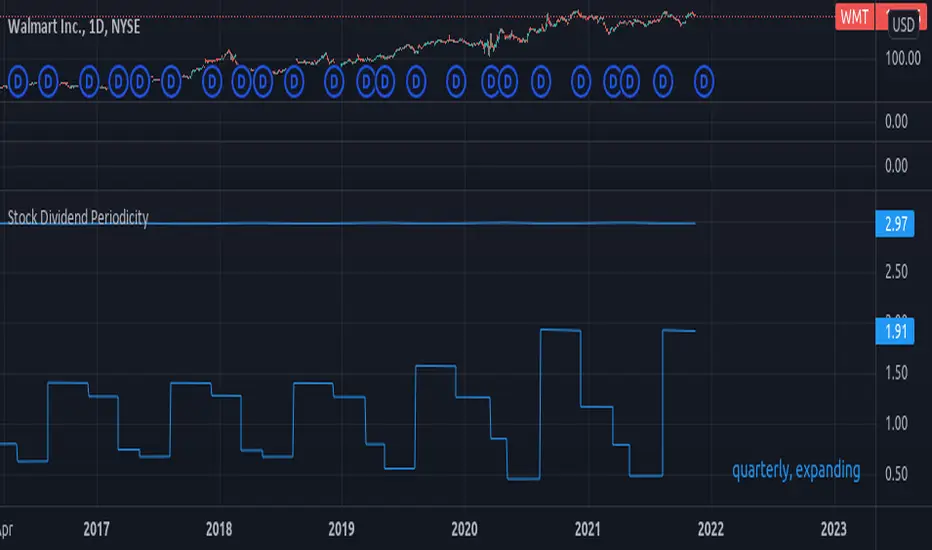
Stock Dividend Periodicityexperimental:
a basic method to evaluate stock dividend periodicity.
known issues:
* it does not adapt well to changes in periodicity, if there is a big enough change on the dividend period plan.
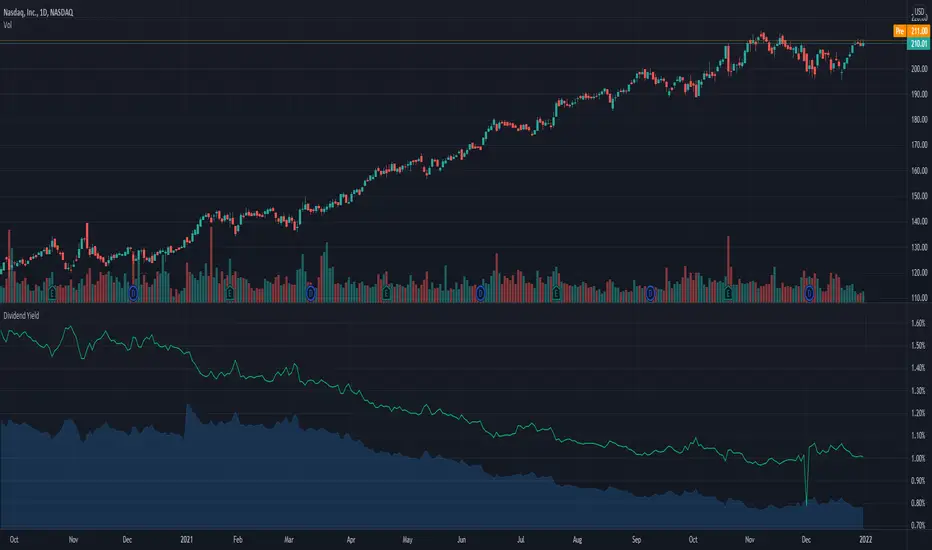
Dividend YieldA simple indicator that shows the current dividend yield over time. The indicator uses the last quarter's dividend and extrapolates it to the full year.

Dividend Yield & Dividend Growth Rate (Most Accurate)In this indicator it shows the dividend yield in green line and dividend growth rate in blue area.
Currently our dividend yield calculation is the most accurate in TradingView.
Dividend growth rate is the annualized percentage growth rate experienced by dividends of a given stock over 5 years period of time.
Many established companies have sought to regularly increase dividends paid to investors.
Dividend Valuation [DDM] display liked Support/Resistance Zone
This Indicator will show you a horizontal line of the stock valuation with the DDM method.
The DDM method is so much simple which has a formula:
Price = EPS * DividendPayout / %Yield
In this case,
-I set the default for Dividend Payout = 40.
This number I refer to from my Research that a lot of stock with have some potential of growth usually has payout around 40% from EPS.
And so far the Payout ratio can use to the term of "Margin of Safety" too, You can set this value to what safety you want.
-The EPS, This value I get from a script that already has in Trading View. And I set it for the TTM version.
-The %Yield, I have 3 lines that you can adapt form the yield that you want.
From this horizontal lines of dividend yield, I hope it can use to be like the Resistance and Support line that guides you to buy or sell a stock you want. And can adapt to your Hybrid Style.
Hope this indicator will help you, May good health to be you :)
------------------------------------------------------------------------------------------------------------------------------------------------------------
สวัสดีมิตรสหายเทรดเดอร์ชาวไทยทุกท่าน
วันนี้ผมได้ลองเขียนอินดิเคเตอร์ตัวหนึ่ง ที่จะแสดงค่าออกมาเป็นเส้นแนวนอน ที่สะท้อนค่า Valuation แบบ DDM ออกมานะครับ
การประเมิน Valuation แบบ DDM นั้น เป็น 1 ในวิธีประเมินค่าหุ้นที่แอบง่ายอยู่ระดับหนึ่งเลย โดยใช้ตัวชี้วัดเพียงอย่างเดียว นั่นคือ "เงินปันผล" ที่ท่านจะได้
ผมเชื่อว่ามีมิตรสหายหลายท่านที่เข้ามาในตลาด ย่อมหวังผลตอบแทนในรูปแบบเงินปันผล ซึ่งจะเปรียบเสมือน Passive Income ที่ส่งเงินให้ท่านทุกปีๆ ไม่ต้องมานั่งเครียดที่หน้าจอ ดูกราฟทุกวี่วัน ลงทุนกับบริษัท ลงทุนกับระบบ ให้เขาทำงานให้กับเราเป็นต้น
ทั้งหลายนี้จึงเป็นที่มาในการเขียนอินดิเคเตอร์นี้ขึ้นมาครับ
อินดิเคเตอร์นี้เรียบง่ายมาก เพียงแค่ท่านใส่ตัวแปรไปแค่ 3-4 ตัวแปรเท่านั้น
ตัวแปรแรกคือ ใส่อัตราการจ่ายปันผล หรือ Dividend Payout
ค่านี้เแสดงถึงว่า หุ้น 1 ตัว เมื่อได้กำไรสุทธิรายปีแล้ว ( EPS ) เขาจะจ่ายอออกมาในสัดส่วนเท่าไรจากกำไรสุทธิพวกนั้น โดยมีระดับตั้งแต่ 1-100 %
โดยมากแล้ว จากที่ผมได้ทำการวิจัยส่วนตัว พบว่าหุ้นส่วนมากใน SET100 และอื่นๆ มักจ่ายปันผลออกมาในระดับ 40% อันเป็นค่าที่ผมตั้งไว้เป็น Default
นอกจากนี้แล้วการตั้ง Dividend Payout ไว้ในระดับที่ต่ำ อาจเป็นการตั้ง Margin of Safe ty ที่ไม่เลวด้วยนั่นเองครับ
ตัวแปรอีก 3 ตัวที่เหลือ จะเป็นตัวเลือกของ % เงินปันผล
ซึ่งท่านสามารถเลือกเงินปันผลที่ท่านด้วยการได้เลยครับ โดยค่าที่ผมตั้งไว้นั้นจะอยู่ระหว่าง 2-4% ท่านสามารถปรับเปลี่ยนได้
ซึ่งเป็นค่าที่อยู่ในระดับกลางๆ สำหรับการลงทุนแบบ Value Investing เลยครับ (แต่ทั้งนี้ทั้งนั้น ท่านสามารถศึกษาศาสตร์นี้ได้จากหนังสือหลายเล่มเลยครับ)
หลังจากใส่ค่าตัวแปรทั้งหมดแล้ว ค่าที่แสดงในกราฟ ก็จะเป็นเส้นตรงแนวตั้ง 3 เส้น ที่เปรียบเสมือนแนวรับแนวต้านให้ท่านได้ทำกลยุทธ์ ไม่ว่าจะวาง Risk Reward Ratio หรือจะเก็บสะสมหุ้นก็แล้วแต่ท่านเลย
ทั้งนี้ทั้งนั้นแล้ว ผมหวังว่าอินดิเคเตอร์นี้ จะทำให้ท่านที่เป็นนักลงทุนสาย Hybrid มีความสุขในการปรับใช้นะครับ
หวังว่าท่านจะชอบอินดิเคเตอร์นี้ ไม่มาก ก็น้อย และเป็นสะพานเชื่อมให้กับเทรดเดอร์สายกราฟเทคนิคสามารถคุยกับเทรดเดอร์สายพื้นฐานจ๋าๆ ผ่าน Assumption ของวิธีการประเมินมูลค่าหุ้นโดยใช้เงินปันผล หรือ DDM กันนะครับ
ขอให้มิตรสหายเทรดเดอร์ทุกท่าน
รักษาสุขภาพให้แข็งแรงปลอดภัย
มีสุขภาพแข็งแรงครับ :)


Dividend Yield with 2 Moving Average for see SpreadI "applied" the dividend yield on the original library script which I adding 2 Exponential Moving Average.
That is average the Long term of Dividend Yield and Short Term of Dividend Yield.
To estimate the Trend that "Is it worth to invest this stock right now?"
If the dividend yield right now is higher than both maybe it worth it on the past
(You can used your price pattern skill to make an entry with backed by adjusted yield------> I think it will help you for estimate pre-total return for Hybrid with Fundamental and Technical )
Hope it will help you ><
PS. it has a problem when using with "Split" stock ( for example 1 Year on "Day" Timeframe )
if somebody can help me .pls help me pls TT
Ps2. Be warry of the stock that don't has consistency pay dividend out and some "special dividend" that don't come form the real operating income.
--------------------------------------------------------------------------------------------------------------------------------------------------------------
สวัสดีมิตรสหายเทรดเดอร์หุ้นไทยทุกท่าน ผมสร้างอินดิเคเตอร์ สำหรับดูผลตอบแทนจากเงินปันผล พร้อมกับเส้นค่าเฉลี่ย เคลื่อนที่ 2 เส้น
เพื่อเป็นการดูแนวโน้มของราคาหุ้น และเพื่อจับจังหวะการซื้อหุ้นนะครับ
ผมขอยกความดีความชอบของ ท่าน Library Script นะครับ ที่มี Format ของการคำนวณเงินปันผลมาให้ ผมทำเพียงแค่ปัดฝุ่น และ Mod เส้นค่าเฉลี่ยขึ้นมาครับ
ไม่มีอะไรจะดีไปกว่าการซื้อหุ้นแล้วมีปันผลรองรับ ซับแรงกระแทกตอนที่กดเข้าซื้อหุ้นไปอีกแล้ว
สำหรับมิตรสหายท่านใดที่ศึกษาศาสตร์ด้าน "พื้นฐาน" และ "เทคนิค" อินดิเคเตอร์นี้อาจช่วยท่านหาจุดเข้าซื้อ ที่คุ้มค่าด้านเงินปันผล และเป็นจุดซื้อที่แม่น ขลัง มากขึ้นนะครับ
ผมว่าหากใช้ควบคู่กับเรื่อง Price Pattern คงเป็นประโยชน์ไม่น้อยเลย
ขอให้อินดิเคเตอร์นี้มิประโยชน์แก่ทุกท่านนะครับ
Ps. บางที เจ้าอินดิเคเตอร์นี้อาจมีปัญหา เมื่อใช้กับหุ้นที่เคยมีการแตกพาร์มาก่อนนะครับ ท่านอาจต้องใช้ Timeframe อื่นที่ไม่ครอบครุมช่วงเวลาที่แตกพาร์ครับ
ซึ่งตรงนี้ ผมยังหาวิธีแก้ไม่พบครับ มิตรสหายท่านใดช่วยมาก ผมจะยินดีอย่างยิ่ง
Ps2. ระมัดระวังหุ้นที่จ่ายปันผลไม่สม่ำเสมอ และหุ้นที่จ่ายปันผลจากกำไรพิเศษ หรือจ่ายจากเงินที่ไม่ได้มาจากการดำเนินงานตามปกตินะครับ เช่นการขาย Asset เข้า กอง Reit ขายหุ้นในบริษัทลูกและอื่นๆ

Dividends per Share (DPS, Yearly)This tool sums DPS for each year starting from current and up to 20 year ago.

Dividend Growth & Payout Ratio - on stocks on 3 MONTH SCALEThis indicator shows the Dividend Growth of a stock and the Dividend Payout Ratio (dividend / close) to show, whether a stock is paying raising dividends in consecutive years and whether price to pay for the stock is above or beyond a personal percentage line.
The green / red crosses show the dividends of the last years. The blue / green line shows the percentage payed out by the the stock yearly.
important Hint: Use this indicator on a MONTHLY, 3 MONTH TIMELINE or 12 MONTH TIMELINE, if the stock is paying 12, 4 or 1 dividends per year.
most US stocks pay 4 times a year, so 3 MONTH scale should be standard to browse stocks
