Cup & Handle Finder by Mashrab🚀 New Tool Alert: The "Perfect Cup" Finder
Hey everyone! I’ve built a custom indicator to help us find high-quality Cup & Handle setups before they breakout.
Most scripts just look for random highs and lows, but this one uses a geometric algorithm to ensure the base is actually round (avoiding those messy V-shapes).
How it works:
🔵 Blue Arc: This marks a verified, institutional-quality Cup.
🟠 Orange Box: This is the "Handle Zone." If you see this connecting to the current candle, it means the setup is live and ready for a potential entry!
Best Usage:
Works best on Weekly (1W) charts.
It’s designed to be an "Early Warning" system—alerting you while the handle is still forming so you don't miss the move.
Give it a try and let me know what you find! 📉📈
Educational

Capitulation Finder(Sahebson)The Capitulation Finder detects potential exhaustion points in trend moves by identifying price dislocations combined with surging volume and extreme RSI levels.
A bullish capitulation signal is generated when price drops significantly below a user-defined moving average while RSI is oversold and volume spikes above the average.
A bearish capitulation signal is triggered under the opposite conditions—price extended above the moving average, RSI overbought, and volume elevated.
Additional confirmation signals highlight persistent overbought or oversold conditions with volume strength. This tool helps traders pinpoint possible reversal zones during volatile market conditions.

Bassi MA Entry Helper MTF EMA , VWMA Swing , ADX , SMA200 , TPBassi MA Entry Helper is an advanced multi-timeframe confluence system designed to identify high-probability entries using trend, volume, market structure, and volatility filters.
It is built for traders who want cleaner signals, fewer false entries, and strong multi-confirmation setups.
Key Features
Multi-Timeframe EMA Crossovers – HTF signal engine
SMA200 Trend Filter – prevents counter-trend trades
VWMA Swing Confirmation – volume-validated micro-swings
ADX Filter – only trade when the trend has strength
Fractal Structure Mapping – identifies swing highs/lows
Retracement Filter – confirms pullbacks before entries
TP/SL Automation – ATR or percentage based
Clean Entry Labels – main & additional entry signals
Highly Customizable – mode, timeframe, filters, visuals
This script is ideal for:
Scalping • Intraday • Swing • Trend continuation • Volume-based setups • Multi-timeframe alignment
How It Works
Main Buy/Sell Signals
Triggered when:
✔ Fast EMA crosses Slow EMA (HTF)
✔ Price aligned with trend
✔ SMA200 filter valid
✔ VWMA confirmation (optional)
✔ ADX strong
✔ Retracement valid (optional)
Additional Buy/Sell Signals
Triggered when VWMA crosses Slow EMA during trend continuation.
TP/SL System
You can choose between:
%-based take-profit & stop-loss
ATR-based dynamic levels
Automatically projects clean visual levels on your chart.
Notes
This indicator does not repaint and is suitable for both real-time and historical analysis.
Always combine signals with proper risk management.
Initial Release – v1.0
Added multi-timeframe EMA engine
Added SMA200 trend filter
Added VWMA swing entries
Added ADX strength filter
Added retracement filter
Added fractal swing detection
Added TP/SL auto plotting
Added main & additional entry labels
Performance optimized

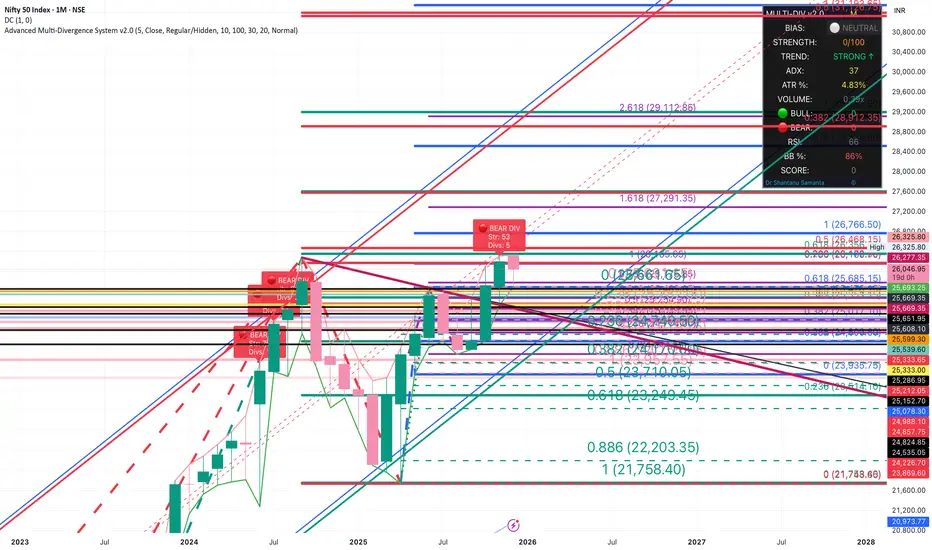
Critical Advanced Multi-Divergence System v2.0Auto calculates 15 indicators , assigns different strength to each and auto adds up to give a Final bias . Auto detects scrip & time frame . Sums up everything in a Dashboard. For educational use only
CandleMapTF - Automatic Candle Structure ToolDescription:
This Pine Script creates an "Automatic Candle Structure Tool" for TradingView that visually manages market structure and dealing ranges across multiple timeframes.
All elements, including colors, opacity, and displayed levels are fully customizable.
Disclaimer:
This script is for educational and informational purposes only and does not
constitute financial advice, investment advice, or a trading recommendation.
Use at your own risk.

Prince Break and RetestHow to use the new visuals (super simple)
When the script prints RETEST BUY or RETEST SELL, you will instantly see:
ENTRY line (lime)
SL line (orange)
TP1 line (teal)
TP2 line (purple)
Entry Mode options
Close = enter at the close of the retest signal candle (simplest)
Box Edge = enter at the box edge (more “limit-order-ish”)
For your style (break + retest), start with Close.

Prime -Hub Prime -Hub is a comprehensive, all-in-one technical analysis toolkit designed for professional Intraday and Swing traders on Nifty, BankNifty, and Stocks. This script consolidates three powerful institutional logic systems into a single, clean interface, replacing the need for multiple indicators.
Disclaimer: This tool is for educational and analytical purposes only. Past performance does not guarantee future results. Trading involves substantial risk.

ORB + FVG + PDH/PDL ORB + FVG + PDH/PDL is an all-in-one day-trading overlay that plots:
Opening Range (ORB) high/low with optional box and extension
Fair Value Gaps (FVG) with optional “unmitigated” levels + mitigation lines
Previous Day High/Low history (PDH/PDL) drawn as one-day segments (yesterday’s levels plotted across today’s session only)
Includes presets (ORB only / FVG only / Both) and optional alerts for ORB touches, ORB break + retest, FVG entry, and PDH/PDL touches.

Institutional Dominance/Trapped Trader Profile @MaxMaserati 3.0📊 Institutional Dominance & Trapped Trader Delta Profile
@MaxMaserati 3.0
═════════════════════════════════════════════════════════════
🎯 OVERVIEW
The IDT Auction Profile is a professional-grade volume order flow analysis tool that reveals where institutional traders hold Positional Advantage and where retail participants are Trapped. Unlike traditional Volume Profile indicators, the IDT Profile integrates Volume Point Delta (VPD) analysis with advanced pattern recognition to identify the exact price levels where profitable institutional positions create support/resistance, and where losing positions are forced to exit.
This indicator answers the critical questions: Who is in profit? Who is trapped? And where will they defend or exit their positions?
═════════════════════════════════════════════════════════════
✨ FEATURES
═════════════════════════════════════════════════════════════
⚡ Quick Presets - One-click configuration for:
• Scalper (1m-5m): 75 bars, 50 rows, ★3 confluence
• Day Trader (15m-1h): 150 bars, 60 rows, ★3 confluence
• Swing Trader (4h-D): 300 bars, 80 rows, ★4 confluence
🔔 Price Alerts - Get notified when price touches:
• VAH (Value Area High) - Resistance zone
• VAL (Value Area Low) - Support zone
• Adjustable sensitivity (0.05% - 1.0%)
📏 POC Line Extensions - Historical context lines extending left from key institutional levels
👻 Previous Session POCs - Dotted reference lines showing prior period levels (carry-over zones)
📊 Real-Time Statistics Panel:
• Total Volume
• Net Delta
• Buy/Sell Pressure %
🎨 Visual Enhancements:
• Column dividers for clarity
• Transparency controls
• Profile auto-hide when price moves away
• Cached color schemes for 30% performance boost
═════════════════════════════════════════════════════════════
🧠 CORE CONCEPT: DOMINANCE VS TRAPPED POSITIONING
═════════════════════════════════════════════════════════════
The indicator categorizes all market participants into two strategic positions based on their entry price relative to current market price:
📍 ABOVE CURRENT PRICE (Resistance Zones)
🔴 Aggressive Sellers in Profit - Sold higher, currently winning. Will defend positions or add to winners.
🟥 Trapped Buyers at Loss - Bought higher, currently losing. Must exit at breakeven, creating resistance.
📍 BELOW CURRENT PRICE (Support Zones)
🟢 Aggressive Buyers in Profit - Bought lower, currently winning. Will defend positions or add to winners.
🟩 Trapped Sellers at Loss - Sold lower, currently losing. Must cover at breakeven, creating support.
⚡ MAXIMUM CONFLUENCE ZONES
When Dominant (Profitable) and Trapped (Loss) positions align at the same level, you get the strongest support/resistance zones:
🟧 Orange Boxes (Above Price) = Aggressive Sellers + Trapped Buyers = STRONGEST RESISTANCE
🟨 Yellow Boxes (Below Price) = Aggressive Buyers + Trapped Sellers = STRONGEST SUPPORT
═════════════════════════════════════════════════════════════
📊 VOLUME ANALYSIS COLUMNS
═════════════════════════════════════════════════════════════
1️⃣ VPD Column (Volume Point Delta)
Net aggressive pressure at each price level (Buying Volume - Selling Volume)
- Bullish Delta (Green): Buyers dominated the auction at this level
- Bearish Delta (Red): Sellers dominated the auction at this level
- Smart Coloring: Automatically highlights institutional patterns
2️⃣ VPS Column (Volume Point of Sell - ASK Volume)
Aggressive buying volume that "lifted the offer" by hitting ask prices
- Represents participants who paid the ask price to enter long
- When price is below this level = These buyers are in profit
- When price is above this level = These sellers who got hit are in profit
- Shows institutional bid volume absorption
3️⃣ VPB Column (Volume Point of Buy - BID Volume)
Aggressive selling volume that "hit the bid" by taking bid prices
- Represents participants who sold at bid price to enter short
- When price is above this level = These sellers are in profit
- When price is below this level = These buyers who got hit are in profit
- Shows institutional ask volume absorption
4️⃣ SVP Column (Optional - Session Volume Profile)
Traditional combined volume profile without bid/ask separation
═════════════════════════════════════════════════════════════
🔍 ADVANCED INSTITUTIONAL PATTERNS DETECTION
═════════════════════════════════════════════════════════════
The indicator uses statistical analysis (standard deviation, moving averages, hit counting) to identify institutional footprints:
⚡ Failed Auctions - "BUYERS TRAPPED" or "SELLERS TRAPPED" labels
• High volume entered, but price immediately reversed
• Creates extreme concentrations of losing positions
• Trading Implication: High-probability reversal zones where trapped participants must exit
📈 Volume Spikes - Bright green/red bars in VPD column
• Volume exceeds average by 2+ standard deviations
• Represents aggressive institutional entry
• Trading Implication: Potential trend continuation or setup for failed auction
🛡️ Absorption Zones - Yellow/Orange colored bars
• Large passive orders absorbing aggressive volume without price movement
• Indicates accumulation (bullish) or distribution (bearish)
• Trading Implication: Institutional positioning before major moves
🧊 Iceberg Orders - Cyan colored bars with high hit counts
• Same price level shows repeated volume without clearing
• Reveals hidden institutional limit orders split into small pieces
• Trading Implication: Strong liquidity magnets, price often returns here
💜 Volume Exhaustion - Purple colored bars
• Sharp volume drop (50%+) after spike
• Momentum exhausted, participants depleted
• Trading Implication: Potential reversal or consolidation ahead
═════════════════════════════════════════════════════════════
🎨 SMART INSTITUTIONAL COLORING
═════════════════════════════════════════════════════════════
Colors bars based on detected patterns vs simple red/green:
🟨 Yellow = Bullish battles won (buyers + trapped sellers)
🟧 Orange = Bearish battles won (sellers + trapped buyers)
🔵 Cyan = Iceberg orders (hidden liquidity)
🟣 Purple = Large passive orders
🟢 Bright Green = Buying spikes (institutional aggression)
🔴 Bright Red = Selling spikes (institutional aggression)
═════════════════════════════════════════════════════════════
⭐ CONFLUENCE SCORING SYSTEM
═════════════════════════════════════════════════════════════
Each price level receives 1-5 stars based on:
★★ Volume spike presence (+2 stars)
★ Absorption pattern (+1 star)
★ Large passive orders (+1 star)
★ Proximity to Value Area (+1 star)
★★ Iceberg detection (+2 stars)
★★ Failed auction (+2 stars)
Minimum Signal Strength filter lets you show only levels with ★3+ confluence for highest-quality signals.
═════════════════════════════════════════════════════════════
🎯 VALUE AREA ANALYSIS
═════════════════════════════════════════════════════════════
VAH (Value Area High) - Blue Line
- Top of the 70% volume acceptance zone
- Price at VAH often rejects downward (resistance)
- Alert triggers when price approaches
VAL (Value Area Low) - Red Line
- Bottom of the 70% volume acceptance zone
- Price at VAL often bounces upward (support)
- Alert triggers when price approaches
Trading Applications:
- Price outside Value Area → Mean reversion opportunity
- Price breaks VA with volume → Trend continuation
- Price oscillates within VA → Range-bound, fade extremes
- Previous session VA lines show carryover levels
═════════════════════════════════════════════════════════════
📋 EXPECTED PRICE BEHAVIOR AT KEY LEVELS
═════════════════════════════════════════════════════════════
⚠️ IMPORTANT: These are observed behavioral patterns for educational purposes and backtesting research. Always validate with 250-500+ backtest trades before risking capital.
1️⃣ POC BOX ZONES (Highest Statistical Relevance)
🟨 Yellow Boxes (Below Current Price - SUPPORT)
Expected Behavior:
- Price approaching from above typically encounters buying pressure
- Both profitable institutional buyers and trapped short sellers create demand
- Common reaction: Price slows, consolidates, or bounces
- Failed bounces often lead to rapid breakdown (trapped buyers capitulate)
What Often Happens:
- Initial dip into zone → Weak bounce attempt
- Second test → Stronger bounce (trapped sellers covering + buyers defending)
- Break below → Quick acceleration as both groups exit
🟧 Orange Boxes (Above Current Price - RESISTANCE)
Expected Behavior:
- Price rallying into zone typically encounters selling pressure
- Both profitable institutional sellers and trapped long buyers create supply
- Common reaction: Price stalls, consolidates, or rejects
What Often Happens:
- Initial push into zone → Weak rejection
- Second test → Stronger rejection (trapped buyers exiting + sellers defending)
- Break above → Quick acceleration as resistance becomes support
2️⃣ FAILED AUCTION ZONES
"SELLERS TRAPPED" Labels (Below Price):
- High-volume selling that immediately reversed = maximum trapped shorts
- When price returns, trapped sellers face pressure to cover
- Typical pattern: Price approaches → Initial hesitation → Sharp bounce
"BUYERS TRAPPED" Labels (Above Price):
- High-volume buying that immediately failed = maximum trapped longs
- Price returning forces trapped buyers to exit at breakeven
- Typical pattern: Price approaches → Distribution → Rejection
3️⃣ VALUE AREA DYNAMICS
Price Outside Value Area (VAH/VAL):
- Price beyond 70% volume zone = statistical outlier
- Two outcomes: Mean reversion OR trend continuation
- Key differentiator: Presence of confluence zones
Mean Reversion Pattern (No Strong Confluence):
- Price extends 1-2% beyond VA → Typically reverts toward POC
- Weak volume on extension → Higher probability of reversal
Breakout Pattern (With ★4+ Confluence):
- Price breaks VA with institutional patterns → Often continues
- Strong volume + confluence = New value area forming
4️⃣ ICEBERG ORDER BEHAVIOR
Cyan Bars with High Hit Counts:
- Repeated volume at same level = Large hidden order absorbing
- Price typically "tests" iceberg multiple times before resolution
- Two outcomes: Absorption complete (break) OR rejection (bounce)
5️⃣ VOLUME SPIKE PATTERNS
Bright Green/Red Bars (Institutional Aggression):
- Extreme delta spikes indicate institutional entry
- Trend Continuation Spikes: Spike aligned with trend = Often continues
- Exhaustion Spikes: Spike against trend = Failed auction forming
═════════════════════════════════════════════════════════════
⚙️ CONFIGURATION GUIDE
═════════════════════════════════════════════════════════════
🎯 QUICK START
1. Select your trading style preset (Scalper/Day/Swing)
2. Enable VAH/VAL alerts in settings
3. Adjust alert sensitivity (0.1% recommended)
4. Add alert condition to TradingView alert system
📊 CORE SETTINGS
- Lookback Period: How many bars to analyze
- Scalping: 50-100 bars
- Day Trading: 100-200 bars
- Swing Trading: 200-500 bars
- Price Row Granularity: How finely to divide price
- 40-50 rows = Fast markets
- 60-80 rows = Balanced (RECOMMENDED)
- 100+ rows = Maximum precision
- Minimum Signal Strength: Filter weak signals
- ★3 = Balanced quality/quantity (RECOMMENDED)
- ★4-5 = Highest quality, fewer opportunities
🎨 VISUAL SETTINGS
- Color Theme: Classic/Institutional/Monochrome/Bold/Minimal/Custom
- Smart Coloring: ON (recommended) - Shows institutional patterns
- Transparency: Adjust profile opacity
- Column Dividers: Visual separators between columns
- POC Extensions: Show historical level significance
📈 ADVANCED FEATURES
- Auto-Hide Distance: Hide profile when price moves X% away
- Statistics Panel: Real-time metrics display
- Previous POCs: Show prior session levels
- Alert Sensitivity: How close price must be to trigger alerts
═════════════════════════════════════════════════════════════
💡 BEST PRACTICES
═════════════════════════════════════════════════════════════
✅ Start with defaults (200 lookback, 60 rows, ★3 confluence, Smart Coloring ON)
✅ Focus on POC boxes first - These are your highest-probability zones
✅ Combine with price action - Use the profile to explain WHY support/resistance exists
✅ Watch for alignment - Yellow/Orange boxes = strongest levels
✅ Respect failed auctions - "TRAPPED" labels are extreme reversal setups
✅ Use Value Area for context - Price outside VA = mean reversion opportunity
✅ Trust confluence scores - ★4-5 signals are institutional-grade setups
✅ Set up alerts for VAH/VAL touches - Don't miss key levels
✅ Check previous session POCs - Institutions defend same zones across sessions
✅ Monitor statistics panel - Understand market conviction in real-time
═════════════════════════════════════════════════════════════
🔧 TECHNICAL SPECIFICATIONS
═════════════════════════════════════════════════════════════
Calculation Method: Enhanced delta using OHLC and volume with wick ratio analysis
Update Frequency: Real-time on every bar close
Performance: Optimized with color caching and pre-calculated values (~30% faster)
Max Capacity: Supports up to 1500 bars lookback and 250 price rows
Compatibility: Works on all symbols and timeframes
Memory Usage: Efficient array management with proper initialization
Alert System: Built-in VAH/VAL touch detection with visual markers
═════════════════════════════════════════════════════════════
🎯 UNIQUE VALUE PROPOSITION
═════════════════════════════════════════════════════════════
Unlike standard Volume Profile indicators that only show where volume occurred, the IDT Auction Profile:
✅ Separates bid vs ask volume to reveal true order flow
✅ Identifies who is profitable vs who is trapped at each level
✅ Detects institutional patterns (icebergs, absorption, failed auctions)
✅ Calculates confluence scores combining multiple factors
✅ Provides clear POC boxes showing exact institutional positioning
✅ Maps positional advantage rather than just volume density
✅ Alerts you to key level touches in real-time
✅ Shows historical context with POC extensions
✅ Displays live statistics for market conviction
This transforms Volume Profile from a historical volume chart into a strategic positioning map showing institutional dominance and trapped participants.
═════════════════════════════════════════════════════════════
📖 HOW TO INTEGRATE WITH YOUR STRATEGY
═════════════════════════════════════════════════════════════
✅ PROPER USES:
- Entry refinement within your existing setups
- Intelligent stop placement beyond institutional levels
- Objective profit targets at next confluence zones
- Trade filtering (only take setups at ★4+ zones)
- Understanding market positioning before entry
- Alert-based monitoring of key support/resistance levels
❌ WHAT IT CANNOT DO:
- Predict direction with certainty
- Replace risk management
- Account for news/external events
- Guarantee profitability
- Work in all market conditions
═════════════════════════════════════════════════════════════
📚 DEVELOPMENT PATH (12-16 Weeks)
═════════════════════════════════════════════════════════════
Weeks 1-2: Observation Only
- Watch price behavior at key levels
- Document patterns without trading
- Set up alerts and observe responses
Weeks 3-8: Paper Trading
- Simulate trades, track all metrics
- Minimum 100 paper trades
- Test different confluence thresholds
Weeks 9-16: Small Size Testing
- Minimal capital, real market conditions
- Continue tracking, refine rules
- Adjust alert sensitivity based on results
After Proven Edge you could potentially include it in your set-up
═════════════════════════════════════════════════════════════
⚠️ CRITICAL DISCLAIMERS
═════════════════════════════════════════════════════════════
⚠️ Past volume ≠ Future price action
⚠️ Institutional positions change rapidly - these are static snapshots
⚠️ No indicator works 100% - risk management is mandatory
⚠️ Market conditions change - adapt your approach
⚠️ Backtest with YOUR style, YOUR timeframe, YOUR risk tolerance
⚠️ Alerts are notifications, not trade signals - you decide the action
The indicator reveals WHERE institutions are positioned and HOW they might behave. YOU decide IF, WHEN, and HOW to trade that information.
═════════════════════════════════════════════════════════════
📞 SUPPORT & UPDATES
═════════════════════════════════════════════════════════════
For questions, suggestions, or bug reports:
- Comment below the indicator
- Follow for updates and new features
- Check documentation for detailed examples
═════════════════════════════════════════════════════════════
Not financial advice. For educational and research purposes only.

STEFAN TEAM LogoSTEFAN TEAM Logo.
"On-Screen Logo for TradingView – A Sharp Brand Accent"
This template is specifically designed for seamless integration into digital spaces: streams, video lessons, presentations, and webinars about trading. The logo maintains perfect readability and a professional appearance on any background—overlaid on charts, in a screen corner, or on an intro screen.
Why this template is an excellent choice:
Optimized for screen: High contrast and clean outlines ensure visibility even at small sizes.
Universal placement: Looks perfect overlaid on the TradingView interface without obscuring key data (candles, indicators, quotes).
Professional signal: Makes your broadcast or video recognizable and strengthens audience trust.
Perfect for: trading streamers, educational course authors, financial analysts, and content creators on YouTube and Twitch.

Entry Scanner Conservative Option AKeeping it simple,
Trend,
RSI,
Stoch RSI,
MACD, checked.
Do not have entry where there is noise on selection, look for cluster of same entry signals.
If you can show enough discipline, you will be profitable.
CT

ATR + True RangeOne indicator for ATR & TR its a common indictor which can be used as one
instead of 2 different its is trial mode only not to be used with out other references

Fixed $200 Risk Futures Position Sizer (2R Target)This indicator is designed for traders who want to follow a strict, professional-style risk model identical to the rules used in funded futures trading programs. Instead of risking a percentage of the account, the indicator always risks a fixed $200 per trade, regardless of contract or market volatility. This allows traders to simulate evaluation accounts and maintain perfect risk discipline.
The tool works across a wide range of futures markets — including micro, mini, and continuous contracts (MES, MNQ, MNQ1!, MYM, M2K, MCL, MGC, ES1!, NQ1!, GC1!) — and automatically loads the correct tick size and tick value for each contract. This ensures that stop distance and risk calculations are always accurate, even when switching between index futures, metals, or energy markets.
You simply enter your Entry Price and Stop Loss Price, and the indicator calculates:
The stop distance in points and ticks
The exact dollar risk per contract
The maximum number of contracts allowed while staying under a fixed $200 risk
A fully automated 2R take-profit target (equivalent to $400 profit per trade)
Expected profit per contract
Total projected profit based on allowed size
Full long/short direction detection
This makes position sizing effortless and completely rule-based. If the chosen stop-loss distance requires more than $200 of risk per contract, the indicator will automatically show 0 contracts allowed, preventing invalid trades and helping maintain consistency.
For clarity and execution, the indicator also plots:
A green Entry Line
A red Stop-Loss Line
A blue 2R Take-Profit Line
This produces a visual, easy-to-understand risk-to-reward layout directly on the chart.
This tool is ideal for traders preparing for funded account challenges, traders practicing mechanical risk systems, or anyone who wants to enforce a strict, repeatable risk framework. It eliminates guesswork, improves consistency, and helps traders build discipline by sizing every trade according to a fixed dollar risk with a precise 2R reward objective.


XXMonk Sequence Price Grid (Manual Origin + U)⭐ XXMonk Sequence Grid – Harmony Price Levels (1–144 Sequence Engine)
Algorithmic Sequence Mapping for Price Displacement
The XXMonk Sequence Grid is a precision mapping tool designed to project algorithmic price levels using harmonic numerical sequences derived from the ICT-inspired time/price symmetry concept.
This indicator takes a user-defined Origin (EQ level) and generates symmetrical expansion bands above and below price using any combination of the following sequence values:
These levels act as algorithmic rails that price frequently reacts to, respects, or expands toward — providing traders with a structural framework to interpret displacement, liquidity objectives, and sequence-based expansions.
🔷 Core Features
✔ Manual Origin (EQ Level)
Set any midpoint — daily open, session equilibrium, dealing range midpoint, your own anchor, etc.
✔ Manual U Value (Unit Size)
No restrictions. Enter any point value (ex: 0.25, 1, 5, 12.5, 25…) to scale the sequence to your instrument.
✔ Full Sequence Control
Toggle ON/OFF each individual harmonic sequence:
Micro ranges → 1, 3, 5
Intermediate → 8, 13, 21
Macro ranges → 34, 55, 89, 144
✔ Individual Line Colors
Every sequence level has its own color input for full customization.
✔ Static Lines (Do Not Move With Cursor)
Lines anchor from the first bar and extend infinitely to the right.
✔ Automatic Labels on Right Side
These levels often align with:
Liquidity pools
Displacement endpoints
PD array boundaries
Algorithmic expansion levels
Reversal zones
Session highs/lows
Volatility-based fractals
Price frequently travels sequence-to-sequence, creating a predictable harmonic structure.

Alloyz Traders_RSI by Sagar BRSI for Intraday purpose with moving average and volume weightage price added in RSI.

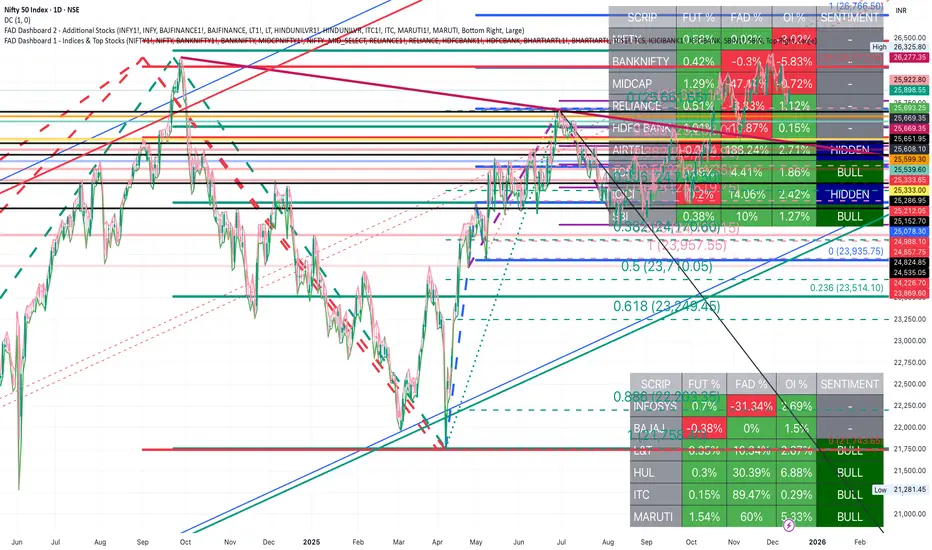
FAD Dashboard 3 - Additional Stocks ( With Alerts )Inspired by ideas of Ram Sir & Wealthcon
Features:
Auto-Timeframe: Values update based on the chart you are looking at (5m, 15m, 1H, etc.).
4 Data Columns:
Future %: Future Price Change (Red/Green).
FAD %: Change in FAD difference (Red/Green).
OI %: Change in Open Interest (Red/Green).
Sentiment Analysis : The specific Bullish/Hidden Bullish logic Strict Colour Logic:
Deep Green( REGULAR LONG BUILD UP): Future ⬆️ + FAD ⬆️ + OI ⬆️
Deep Blue (HIDDEN LONG BUILD UP ): Future ⬇️ + FAD ⬆️ + OI ⬆️
Additionally , auto alerts of Regular or Hidden build up at hourly & daily time frame .
Only for Educational purpose

FAD Dashboard 2 - Top Nifty 50 Stocks ( With Alerts )Inspired by ideas of Ram Sir & Wealthcon
Features:
Auto-Timeframe: Values update based on the chart you are looking at (5m, 15m, 1H, etc.).
4 Data Columns:
Future %: Future Price Change (Red/Green).
FAD %: Change in FAD difference (Red/Green).
OI %: Change in Open Interest (Red/Green).
Sentiment Analysis : The specific Bullish/Hidden Bullish logic Strict Colour Logic:
Deep Green( REGULAR LONG BUILD UP): Future ⬆️ + FAD ⬆️ + OI ⬆️
Deep Blue (HIDDEN LONG BUILD UP ): Future ⬇️ + FAD ⬆️ + OI ⬆️
Additionally , auto alerts of Regular or Hidden build up at hourly & daily time frame .
Only for Educational purpose
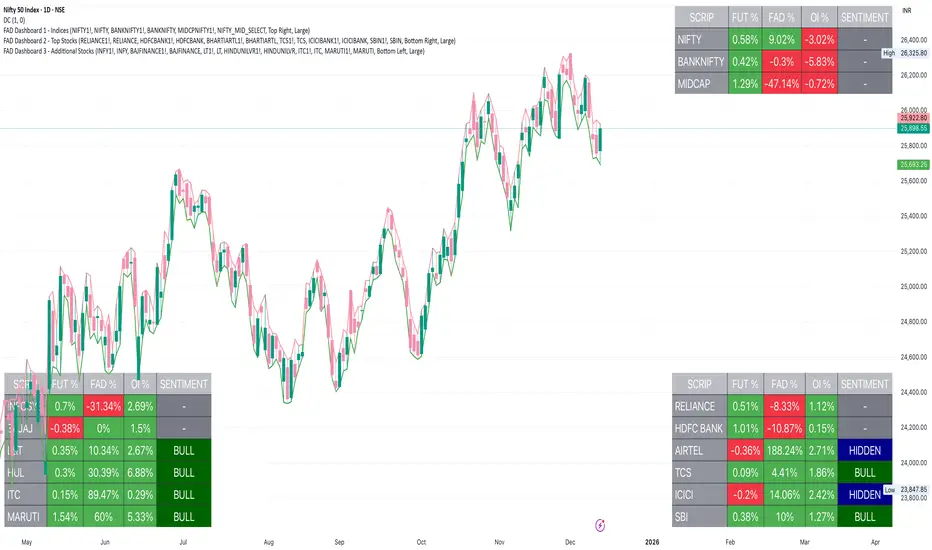
FAD Dashboard 1 - Indices ( With Alerts )Inspired by ideas of Ram Sir & Wealthcon
Features:
Auto-Timeframe: Values update based on the chart you are looking at (5m, 15m, 1H, etc.).
4 Data Columns:
Future %: Future Price Change (Red/Green).
FAD %: Change in FAD difference (Red/Green).
OI %: Change in Open Interest (Red/Green).
Sentiment Analysis : The specific Bullish/Hidden Bullish logic Strict Colour Logic:
Deep Green( REGULAR LONG BUILD UP): Future ⬆️ + FAD ⬆️ + OI ⬆️
Deep Blue (HIDDEN LONG BUILD UP ): Future ⬇️ + FAD ⬆️ + OI ⬆️
Additionally , auto alerts of Regular or Hidden build up at hourly & daily time frame .
Only for Educational purpose

FAD Dashboard 2 - Additional StocksInspired by Ideas of Ram Sir & WEALTHCON
Features:
Auto-Timeframe: Values update based on the chart you are looking at (5m, 15m, 1H, Daily etc.).
4 Data Columns:
Future %: Future Price Change (Red/Green).
FAD %: Change in FAD difference (Red/Green).
OI %: Change in Open Interest (Red/Green).
Sentiment Analysis : The specific Bullish/Hidden Bullish logic Strict Colour Logic:
Deep Green( REGULAR LONG BUILD UP): Future ⬆️ + FAD ⬆️ + OI ⬆️
Deep Blue (HIDDEN LONG BUILD UP ): Future ⬇️ + FAD ⬆️ + OI ⬆️
Only for Educational Purpose
FAD Dashboard 1 - Indices & Top StocksInspired by Ideas of Ram Sir & WEALTHCON
Features:
Auto-Timeframe: Values update based on the chart you are looking at (5m, 15m, 1H, Daily etc.).
4 Data Columns:
Future %: Future Price Change (Red/Green).
FAD %: Change in FAD difference (Red/Green).
OI %: Change in Open Interest (Red/Green).
Sentiment Analysis : The specific Bullish/Hidden Bullish logic Strict Colour Logic:
Deep Green( REGULAR LONG BUILD UP): Future ⬆️ + FAD ⬆️ + OI ⬆️
Deep Blue (HIDDEN LONG BUILD UP ): Future ⬇️ + FAD ⬆️ + OI ⬆️
Only for Educational Purpose

Scalping EMA9/15 This indicator is designed for high-accuracy intraday scalping based on a refined version of the popular EMA9–EMA15 trend-following technique.
It filters weak or premature entries by requiring a retest of the EMA zone before generating a Buy/Sell signal — drastically reducing false breakouts.

Killzones (EST)Asian Range
19:00 – 00:00 EST
Consolidation, liquidity build
London Open
02:00 – 05:00 EST
Initial expansion, Judas Swing
New York Open
07:00 – 10:00 EST
Main move, SMT, MSS setups
NY Lunch/Reversal
11:30 – 13:00 EST
Rebalancing, exit window
