Adaptive Elliott Wave: Forecast + Dashboard (V.2)Title: Adaptive Elliott Wave: Forecast + Dashboard
Description:
Overview
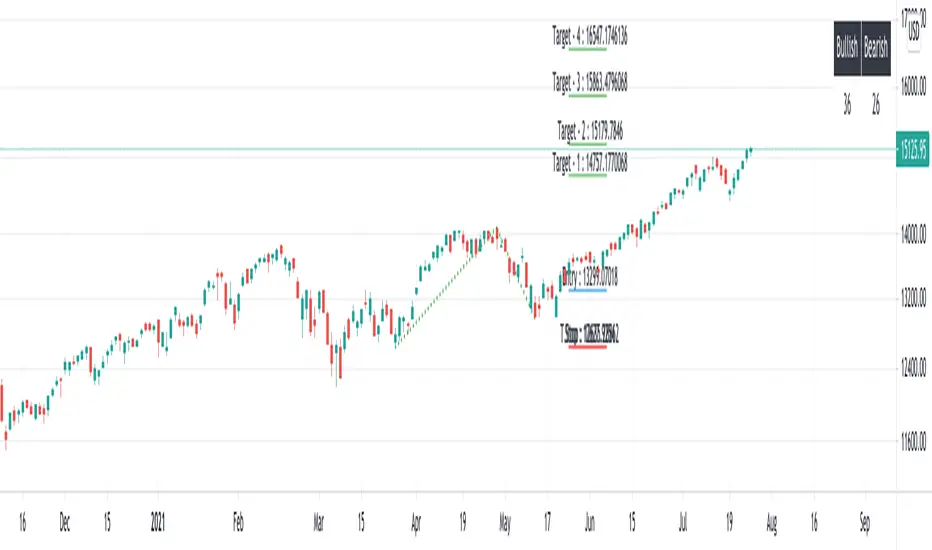
The Adaptive Elliott Wave: Forecast + Dashboard is a technical analysis tool designed to visualize potential Elliott Wave structures using a dynamic, multi-factor approach. Unlike static wave scripts, this indicator adapts its projections based on real-time trend context (Weighted Moving Averages) and momentum shifts (RSI). It is built to help traders identify the most likely path—Impulse or Correction—based on current market conditions.
How It Works
The script uses a combination of pivot-point detection and trend filtering to project future wave paths.
Pivot Logic: The indicator identifies significant Highs and Lows using a sensitivity setting. These pivots form the "anchors" for the Elliott Wave count.
Adaptive Engine: The "Auto-Detect" mode analyzes the relationship between the 50/200 WMA (Trend) and RSI (Momentum).
In a Bull Trend: If RSI is oversold, the script anticipates a bullish "Impulse" wave. If RSI is overbought, it prepares for a "Correction."
In a Bear Trend: The logic reverses to project rallies or downward impulses.
Projections: It calculates Fibonacci-based targets for waves 1-5 (Impulse) or A-B-C/W-X-Y (Correction) and renders them as "ghost lines" that move with the price.
Macro Outlook: For long-term context, the script includes a Macro Projection feature that uses higher-period pivots to show the possible 1-year direction.
Key Features
Target Table: A real-time dashboard showing exact Fibonacci target prices and the percentage distance from the current price.
Corrective Channels: Automatically draws channels for wave corrections to help identify potential breakout or breakdown zones.
Bullish/Bearish Extensions: Shows immediate volatility-based extensions beyond the last confirmed pivot.
RSI Signals: Visual markers on the chart indicate overbought/oversold conditions that feed into the adaptive logic.
How to Use
Identify the Phase: Use the "AI STATUS" in the dashboard to see if the script is currently projecting an Impulse (Trend move) or a Correction (Counter-trend).
Confirm with WMA: Use the 50 (Blue) and 200 (Orange) WMAs to confirm the macro trend before following a projection.
Monitor Fib Targets: Watch for price reactions at the projected labels. If price breaks a target significantly, the wave count may need to be re-evaluated (re-pivot).
Customize Sensitivity: For scalping, lower the "Short-Term Sensitivity." For swing trading, increase it.
Disclaimer
This script is for educational purposes only. Elliott Wave Theory is subjective, and projections are mathematical estimates based on historical volatility. Past performance does not guarantee future results. Always use proper risk management.
Settings Guide
Forecast Mode: Choose between "Auto-Detect" (Dynamic) or manually force an Impulse/Correction count.
Macro Sensitivity: Controls how far back the script looks to generate the purple 1-year projection.
Link Correction to Extension: A unique feature that starts the forecast from a potential extension target rather than the current live price.
Elliottwaveforecasts

Elliott Wave: Pro Forecast + Dashboard (with RSI Divergence)Elliott Wave: Pro Forecast + Dashboard (with RSI Divergence)
This indicator provides a dynamic, real-time projection of Elliott Wave structures, helping traders identify potential trend exhaustion and reversal targets. By combining historical pivot analysis with Fibonacci extensions, it forecasts both short-term "extensions" and long-term "macro" moves.
🚀 Key Features
Automated Elliott Wave Projections: Automatically plots potential 5-wave impulse moves (bullish) and 3-wave corrective moves (ABC - bearish) based on current market volatility.
RSI Divergence Integration (⚡): The script scans for discrepancies between price and momentum. If a reversal is projected while a Bullish or Bearish divergence exists, a lightning bolt icon appears, signaling a high-probability setup.
Dual-Horizon Forecasting:
Short-Term Extension: Projects the immediate continuation of the current trend.
1-Year Macro Projection: A "Big Picture" mode that uses high-sensitivity pivots to forecast long-term structural shifts.
Dynamic Data Dashboard: An on-chart table calculates exact Fibonacci price targets and the percentage distance from the current price, allowing for precise risk/reward planning.
Invalidation Logic: Clearly marks the "Invalidation Line." If price breaches this level, the current wave count is considered void.
🛠️ How to Read the Chart
Historical Waves (Green/Teal): Shows the confirmed pivots that the script is using as a baseline.
Extensions (Orange): The immediate predicted path if the current momentum continues.
Reversals (Blue): The projected Elliott Wave path if the current pivot holds.
Look for the ⚡ symbol near the Invalidation line; this indicates RSI Divergence, suggesting the reversal has strong momentum backing it.
Macro Projection (Purple): Designed for swing traders and investors to see where the asset could be in a year based on larger cycle pivots.
⚙️ Settings & Customization
Sensitivity: Adjust the "Short-Term" and "Macro" sensitivity to filter out market noise or capture smaller intraday cycles.
Scenario Linking: You can choose to have the Reversal projection start after the Extension target is hit, or have them run independently.
Visual Toggles: Enable/Disable the target table, Fibonacci grid levels, and chart labels to keep your workspace clean.
Disclaimer: This indicator is a mathematical projection based on historical volatility and Elliott Wave rules. It is a tool for technical analysis and does not guarantee future results. Always use proper stop-loss management.

Elliott Wave [LuxAlgo]The Elliott Wave indicator allows users to detect Elliott Wave (EW) impulses as well as corrective segments automatically on the chart. These are detected and displayed serially, allowing users to keep track of the evolution of an impulse or corrective wave.
Fibonacci retracements constructed from detected impulse waves are also included.
This script additionally allows users to get alerted on a wide variety of trigger conditions (see the ALERTS section below).
🔶 SETTINGS
🔹 Source
• "high" -> options high, close, maximum of open/close
• "low" -> options low, close, minimum of open/close
🔹 ZigZag
• The source and length are used to check whether a new Pivot Point is found.
Example:
• source = high/low, length = 10:
• There is a new pivot high when:
- previous high is higher than current high
- the highs of 10 bars prior to previous high are all lower
• These pivot points are used to form the ZigZag lines, which in their turn are used for pattern recognition
🔶 USAGE
The basic principles we use to identify Elliott Wave impulses are:
• A movement in the direction of the trend ( Motive/Impulse wave ) is divided in 5 waves (Wave 1 -> 5)
• The Corrective Wave (against the trend) is divided in 3 waves (Wave A -> C)
• The waves can be subdivided in smaller waves
• Wave 2 can’t retrace more than the beginning of Wave 1
• Wave 4 does not overlap with the price territory of Wave 1
Here we see an example:
Let's look at the development:
• 1 bar after point (5) a confirmed 5 Motive Wave pattern is found (1 -> 5; The 5 Waves can also be seen as one large Wave 1 ).
• Next, the script draws a set of Fibonacci lines, which are area's where the Corrective Wave potentially will bounce.
Here we see the fifth wave is getting larger, the previous highest point is updated, and the Wave 5 is larger than Wave 3 :
(At this point, the pattern is invalidated, and it display as dotted)
Further progression in time:
At this point, a confirmed " 3 Corrective Wave pattern " is found (a -> c)
When a new high has developed, a circle is drawn (in the same color of the lines)
However, when the bottom of the drawn box has breached, a red cross will be visualized.
Further progression:
Later on, a bearish confirmed " 5 Motive Wave pattern " is found (1 -> 5):
When a Corrective Wave becomes invalidated, the ABC pattern will display as dashed (not dotted):
🔶 TECHNIQUES
Pine Script™ introduces methods!
• More information can be found here:
• Pine Script™ v5 User Manual 👉 Methods
• Pine Script™ language reference manual 👉 method
🔶 ALERTS
Dynamic alerts are included in the script, you only need to set 1 alert to receive following messages:
• When a new EW Motive Pattern is found (Bullish/Bearish )
• When a new EW Corrective Pattern is found (Bullish/Bearish )
• When an EW Motive Pattern is invalidated (Bullish/Bearish )
• When an EW Corrective Pattern is invalidated (Bullish/Bearish )
• When possible, a start of a new EW Motive Wave is found (Bullish/Bearish )
• Here is information how you can set these alerts()

Elliot Wave - ImpulseLets dabble a bit into Elliot Waves.
This is a simple script which tries to identify Wave 1 and 2 of Elliot Impulese Wave and then projects for Wave 3.
Ratios are taken from below link: elliottwave-forecast.com - Section 3.1 Impulse
Wave 2 is 50%, 61.8%, 76.4%, or 85.4% of wave 1 - used for identifying the pattern.
Wave 3 is 161.8%, 200%, 261.8%, or 323.6% of wave 1-2 - used for setting the targets
Important input parameters
Length : Zigzag Length. Keep the numbers low if you are looking for smaller and shorter trades. Keep the numbers high if you are looking for longer and bigger trades.
Error Percent : Adjustments for ratios as it is not always possible to find exactly equal retracement ratio.
Entry Percent : Once Wave 2 is formed, entry is set after reversing 30% of wave 2. This number can be increased or decreased. Caution: Keeping the number too low may result in false signals.
Ignore Trend Direction : If unchecked, it will only look for pattern if Wave 1 has made a higher high. If not, it will ignore Wave 1 condition and only look at wave 1 to 2 ratio.
Handle Duplicates : Since, the labels are generated upon crossover of entry price, this crossover may happen multiple times. Or sometimes wave 2 can further extend and generate new signal with same wave 1. This parameter says how to handle such cases. Keep Last is set to default and is most preferred option.
ShowRatios and ShowWaves lets you display wave line and retracement ratios for each pivots
EWO Breaking Bands & XTLElliott Wave Principle, developed by Ralph Nelson Elliott , proposes that the seemingly chaotic behaviour of the different financial markets isn’t actually chaotic. In fact the markets moves in predictable, repetitive cycles or waves and can be measured and forecast using Fibonacci numbers. These waves are a result of influence on investors from outside sources primarily the current psychology of the masses at that given time. Elliott wave predicts that the prices of the a traded currency pair will evolve in waves: five impulsive waves and three corrective waves. Impulsive waves give the main direction of the market expansion and the corrective waves are in the opposite direction (corrective wave occurrences and combination corrective wave occurrences are much higher comparing to impulsive waves)
The Elliott Wave Oscillator ( EWO ) helps identifying where you are in the 5 / 3 Elliott Waves , mainly the highest/lowest values of the oscillator might indicate a potential bullish / bearish Wave 3. Mathematically expressed, EWO is the difference between a 5 period and 35 period moving average. In this study instead 35-period, Fibonacci number 34 is implemented for the slow moving average and formula becomes ewo = sma (HL2, 5) - sma (HL2, 34)
The Elliott Wave Oscillator enables traders to track Elliott Wave counts and divergences. It allows traders to observe when an existing wave ends and when a new one begins. Included with the EWO are the breakout bands that help identify strong impulses.
The Expert Trend Locator ( XTL ) was developed by Tom Joseph (in his book Applying Technical Analysis) to identify major trends, similar to Elliott Wave 3 type swings.
Blue bars are bullish and indicate a potential upwards impulse.
Red bars are bearish and indicate a potential downwards impulse.
White bars indicate no trend is detected at the moment.
Added "TSI Arrows". The arrows is intended to help the viewer identify potential turning points. The presence of arrows indicates that the TSI indicator is either "curling" up under the signal line, or "curling" down over the signal line. This can help to anticipate reversals, or moves in favor of trend direction.

Elliott Wave Oscillator Signals by DGTElliott Wave Principle , developed by Ralph Nelson Elliott, proposes that the seemingly chaotic behaviour of the different financial markets isn’t actually chaotic. In fact the markets moves in predictable, repetitive cycles or waves and can be measured and forecast using Fibonacci numbers. These waves are a result of influence on investors from outside sources primarily the current psychology of the masses at that given time. Elliott wave predicts that the prices of the a traded currency pair will evolve in waves: five impulsive waves and three corrective waves. Impulsive waves give the main direction of the market expansion and the corrective waves are in the opposite direction (corrective wave occurrences and combination corrective wave occurrences are much higher comparing to impulsive waves)
The Elliott Wave Oscillator (EWO) helps identifying where you are in the 5-3 Elliott Waves, mainly the highest/lowest values of the oscillator might indicate a potential bullish/bearish Wave 3. Mathematically expressed, EWO is the difference between a 5-period and 35-period moving average based on the close. In this study instead 35-period, Fibonacci number 34 is implemented for the slow moving average and formula becomes ewo = ema(source, 5) - ema(source, 34)
The application of the Elliott Wave theory in real time trading gets difficult because the charts look messy. This study (EWO-S) simplifies the visualization of EWO and plots labels on probable reversals/corrections. The good part is that all plotting’s are performed on the top of the price chart including a histogram (optional and supported on higher timeframes). Additionally optional Keltner Channels Cloud added to help confirming the price actions.
What to look for:
Plotted labels can be used to follow the Elliott Wave occurrences and most importantly they can be considered as signals for possible trade setup opportunities. Elliott Wave Rules and Fibonacci Retracement/Extensions are suggested to confirm the patters provided by the EWO-S
Trading success is all about following your trading strategy and the indicators should fit within your trading strategy, and not to be traded upon solely
Disclaimer : The script is for informational and educational purposes only. Use of the script does not constitutes professional and/or financial advice. You alone the sole responsibility of evaluating the script output and risks associated with the use of the script. In exchange for using the script, you agree not to hold dgtrd TradingView user liable for any possible claim for damages arising from any decision you make based on use of the script
