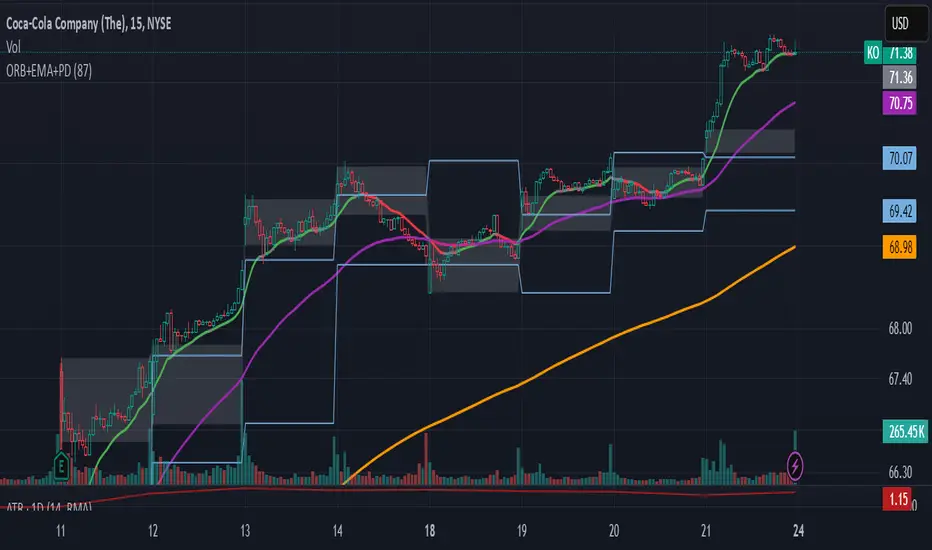
iD EMARSI on ChartSCRIPT OVERVIEW
The EMARSI indicator is an advanced technical analysis tool that maps RSI values directly onto price charts. With adaptive scaling capabilities, it provides a unique visualization of momentum that flows naturally with price action, making it particularly valuable for FOREX and low-priced securities trading.
KEY FEATURES
1 PRICE MAPPED RSI VISUALIZATION
Unlike traditional RSI that displays in a separate window, EMARSI plots the RSI directly on the price chart, creating a flowing line that identifies momentum shifts within the context of price action:
// Map RSI to price chart with better scaling
mappedRsi = useAdaptiveScaling ?
median + ((rsi - 50) / 50 * (pQH - pQL) / 2 * math.min(1.0, 1/scalingFactor)) :
down == pQL ? pQH : up == pQL ? pQL : median - (median / (1 + up / down))
2 ADAPTIVE SCALING SYSTEM
The script features an intelligent scaling system that automatically adjusts to different market conditions and price levels:
// Calculate adaptive scaling factor based on selected method
scalingFactor = if scalingMethod == "ATR-Based"
math.min(maxScalingFactor, math.max(1.0, minTickSize / (atrValue/avgPrice)))
else if scalingMethod == "Price-Based"
math.min(maxScalingFactor, math.max(1.0, math.sqrt(100 / math.max(avgPrice, 0.01))))
else // Volume-Based
math.min(maxScalingFactor, math.max(1.0, math.sqrt(1000000 / math.max(volume, 100))))
3 MODIFIED RSI CALCULATION
EMARSI uses a specially formulated RSI calculation that works with an adaptive base value to maintain consistency across different price ranges:
// Adaptive RSI Base based on price levels to improve flow
adaptiveRsiBase = useAdaptiveScaling ? rsiBase * scalingFactor : rsiBase
// Calculate RSI components with adaptivity
up = ta.rma(math.max(ta.change(rsiSourceInput), adaptiveRsiBase), emaSlowLength)
down = ta.rma(-math.min(ta.change(rsiSourceInput), adaptiveRsiBase), rsiLengthInput)
// Improved RSI calculation with value constraint
rsi = down == 0 ? 100 : up == 0 ? 0 : 100 - (100 / (1 + up / down))
4 MOVING AVERAGE CROSSOVER SYSTEM
The indicator creates a smooth moving average of the RSI line, enabling a crossover system that generates trading signals:
// Calculate MA of mapped RSI
rsiMA = ma(mappedRsi, emaSlowLength, maTypeInput)
// Strategy entries
if ta.crossover(mappedRsi, rsiMA)
strategy.entry("RSI Long", strategy.long)
if ta.crossunder(mappedRsi, rsiMA)
strategy.entry("RSI Short", strategy.short)
5 VISUAL REFERENCE FRAMEWORK
The script includes visual guides that help interpret the RSI movement within the context of recent price action:
// Calculate pivot high and low
pQH = ta.highest(high, hlLen)
pQL = ta.lowest(low, hlLen)
median = (pQH + pQL) / 2
// Plotting
plot(pQH, "Pivot High", color=color.rgb(82, 228, 102, 90))
plot(pQL, "Pivot Low", color=color.rgb(231, 65, 65, 90))
med = plot(median, style=plot.style_steplinebr, linewidth=1, color=color.rgb(238, 101, 59, 90))
6 DYNAMIC COLOR SYSTEM
The indicator uses color fills to clearly visualize the relationship between the RSI and its moving average:
// Color fills based on RSI vs MA
colUp = mappedRsi > rsiMA ? input.color(color.rgb(128, 255, 0), '', group= 'RSI > EMA', inline= 'up') :
input.color(color.rgb(240, 9, 9, 95), '', group= 'RSI < EMA', inline= 'dn')
colDn = mappedRsi > rsiMA ? input.color(color.rgb(0, 230, 35, 95), '', group= 'RSI > EMA', inline= 'up') :
input.color(color.rgb(255, 47, 0), '', group= 'RSI < EMA', inline= 'dn')
fill(rsiPlot, emarsi, mappedRsi > rsiMA ? pQH : rsiMA, mappedRsi > rsiMA ? rsiMA : pQL, colUp, colDn)
7 REAL TIME PARAMETER MONITORING
A transparent information panel provides real-time feedback on the adaptive parameters being applied:
// Information display
var table infoPanel = table.new(position.top_right, 2, 3, bgcolor=color.rgb(0, 0, 0, 80))
if barstate.islast
table.cell(infoPanel, 0, 0, "Current Scaling Factor", text_color=color.white)
table.cell(infoPanel, 1, 0, str.tostring(scalingFactor, "#.###"), text_color=color.white)
table.cell(infoPanel, 0, 1, "Adaptive RSI Base", text_color=color.white)
table.cell(infoPanel, 1, 1, str.tostring(adaptiveRsiBase, "#.####"), text_color=color.white)
BENEFITS FOR TRADERS
INTUITIVE MOMENTUM VISUALIZATION
By mapping RSI directly onto the price chart, traders can immediately see the relationship between momentum and price without switching between different indicator windows.
ADAPTIVE TO ANY MARKET CONDITION
The three scaling methods (ATR-Based, Price-Based, and Volume-Based) ensure the indicator performs consistently across different market conditions, volatility regimes, and price levels.
PREVENTS EXTREME VALUES
The adaptive scaling system prevents the RSI from generating extreme values that exceed chart boundaries when trading low-priced securities or during high volatility periods.
CLEAR TRADING SIGNALS
The RSI and moving average crossover system provides clear entry signals that are visually reinforced through color changes, making it easy to identify potential trading opportunities.
SUITABLE FOR MULTIPLE TIMEFRAMES
The indicator works effectively across multiple timeframes, from intraday to daily charts, making it versatile for different trading styles and strategies.
TRANSPARENT PARAMETER ADJUSTMENT
The information panel provides real-time feedback on how the adaptive system is adjusting to current market conditions, helping traders understand why the indicator is behaving as it is.
CUSTOMIZABLE VISUALIZATION
Multiple visualization options including Bollinger Bands, different moving average types, and customizable colors allow traders to adapt the indicator to their personal preferences.
CONCLUSION
The EMARSI indicator represents a significant advancement in RSI visualization by directly mapping momentum onto price charts with adaptive scaling. This approach makes momentum shifts more intuitive to identify and helps prevent the scaling issues that commonly affect RSI-based indicators when applied to low-priced securities or volatile markets.
Pine Script® strategy