Exponential Moving Average (EMA)

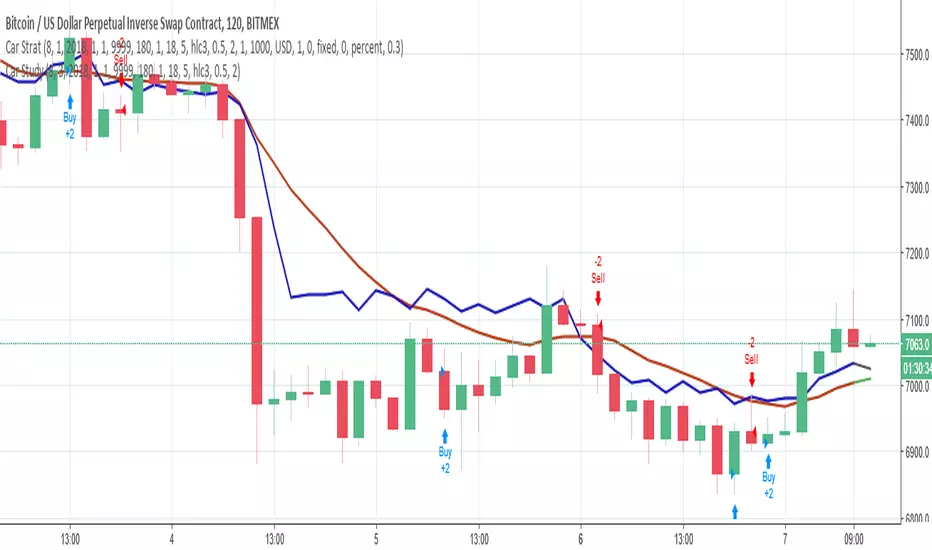
Carribean Strategy
Hi!
This is my first published strategy. This is my passport to early retirement. It is a very modified version of HCL3/Kaufman strategy. Lots of manual coding to solve repaint. Backtest/realtime differences fixed.
I'm finishing the tests but I guess it is almost done.
Using with Autovew. For now, 2 hour candles only!
Please share your results!

Money Flow AUD/USD 3 DayUsing money flow index combined with relative strength index to pick very close to the tops filtered with an EMA , all parameters can be adjusted to suit any time frame with some fine tuning , set up for a 3 day AUD/USD chart but will work with anything, decent win rate and profit factor, numbers used are enough initial capital to cover twice the amount of contracts, and works best with heikin Ashi chart .

TEMA Strategy 1 (Updated)This is just a test strategy using TEMA ( Triple Exponential Moving Average ).
Test Detail
Symbol: BTCUSD
Interval: 1H
Initial Capital: $1000
Investment: 100% Equity
Results (on BTCUSD -2.31% - Bitfinex)
I had to chunk the months because of the order limit (1000)
(all months start at 1st, 00:00 AND finish at last date, 23:59 )
Timeframe: 2017 August - 2017 Nov
Profit: 21.9%
Max Drawdown: 83.94%
Timeframe: 2017 Dec - 2018 Feb
Profit: 446.32%
Max Drawdown: 46.54%
Timeframe: 2018 Mar - 2018 Jul
Profit: 288.87%
Max Drawdown: 51.49%
To fix:
Too many orders, potentially reduce order counts by increasing max loss (100~200 orders/month) \u2028
High Max Drawdown, need to fix that
Looks like orders are created and terminated very quickly, need to look into that
Still figuring things out

EMA Mega Cross Strategy v2vastly improved and tuned. Million+% return from 2016. 2000+% return from 2018.
BB limitMarket maker strategy using Bollinger bands as entry, moving average as close and simple stop-loss with percentage of entry position. It was extremely profitable in june on xbtusd.


Moving Average Cross Strategy Simply define your fast and slow M then backtest the strategy.
*First script, work in progress. Will allow you to combine two TV indicators into one.

Moving Average Cross StrategySimply choose your moving averages and backtest shorting and longing the crossing of these MA's. Meant for dialing in MA crosses as part of a trading setup and not reason enough to take the trade. First script, work in progress.

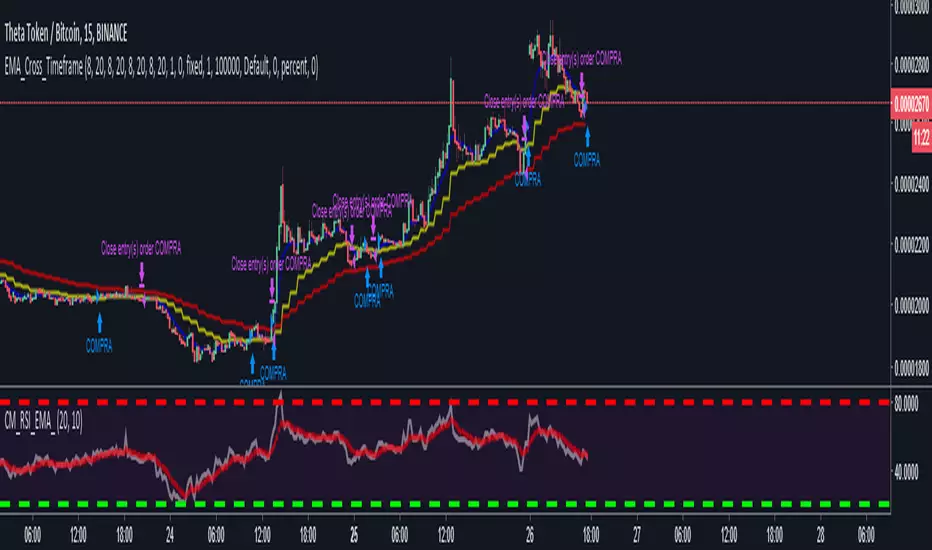
EMA_Cross_TimeframeIndicator made to show the EMAs in different timeframes.
indicator gives buys signal when the EMA of the current chart (emaA1) crosses the EMA of the 1H chart (emaH1). And it gives the signal of sale when the EMA of the current chart (emaA1), crosses down the EMA of the 1H chart (emaH1) and the closing is below the emaH1.
NOTE 1: In the tests that I have done, it has given great signs of purchase, but with the sales signals, I still have to find the best result.
NOTE 2: Do not blindly use any indicators, analyze them, and use the indicator to help confirm your inputs and outputs.
I am open to suggestions for improvements.
Long Term Strategy (100% BTC, only Longs)My BTCUSD Long Term Strategy,
based on Ichimoku, BB, EMA's & some William's Alligator & Fractals.
Up to this point only gave profitable long trades on BTCUSD (100% profit factor).
Have fun & be careful, nothing is bullet proof.
Ciao!

Short Term StrategyMy Short Term Strategy,
works best on low time frames (3min - 5 min).
But keep an eye on low TR, as it will tend to trend too much.
As always, keep it safe.
Ciao!

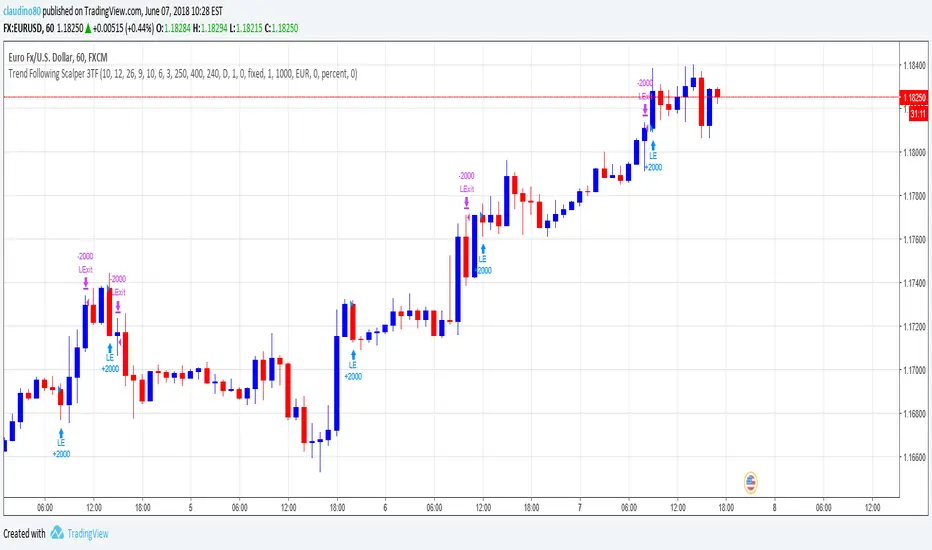
Trend Following Scalper 3 Time FramseDo you think it is a good idea to use the Stochastic / MACD / EMA and cross check THREE timeframes to detect a new trend?
If you think that it would be a good idea, this is the script that you are looking for.
The Trend Following Scalper (3 Time Frames) script has been developed to automate the trading activity by detecting a new trend and by scalping a fixed amount of pips each trade. That is why it is called Trend Following Scalper.
How does the script detect the new trend?
The beginning of the new trend is detected on the lower timeframe (1H is the suggested one) by joining the information of the Stochastic, MACD and Exponential Moving Average.
Once a potential trade has been detected on lower timeframe, the script confirms it by looking the upper timeframe (e.g. Daily + H4) by gathering the same indicator / parameter information.
If the threes timeframes are moving in the same direction, the script open a new trade.
Why do we need to merge lower and higher timeframe before open the trade?
The lower timeframe shows a shorter Price Action context. The short price action context has a short life! By looking at the higher time frames context the script tries to exclude the short life counter-trend moves. At the end, a new trade is open only if the higher timeframe context supports the lower timeframe indication.
What about the Risk-Reward (following RR) ratio?
The RR is set by default as 1.6 (stop loss 25 pips and take profit 40 pips).
This configuration has been heavily tested on multiple crosses and it has shown a good Equity Line with a low Drawdown.
(Note: the stop loss and take profit can be changed by the user via the parameter pages. Suggest RR > 1.5)
What about the accuracy of the Script?
The average script accuracy is > 55% on the H1 time frame (tested with various crosses).
With this accuracy, and by risking 0.6% of the capital each trade, your capital will grow > 25% every 100 trades.
What about the drawdown?
It depends on the capital and the size of the position used on each trade.
For example, with an initial capital of 1000 Euros and by risking 0.6% of the capital each trade, the drawdown is close to 3%.
(The strategy tester result has been calculated starting from January 2017. The strategy produced 527E (i.e. 52% gain) starting from a 1000E capital and risking 0.5% each trade)
Do you want to try the script? Please write me!
Do you have some question? Please write me!
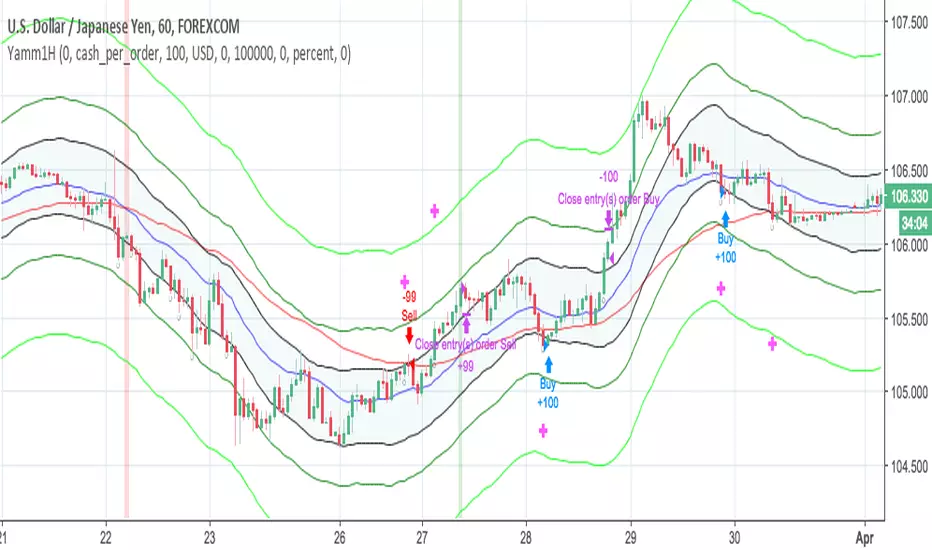
Trend Following Scalper 2 Time FramesDo you think it is a good idea to use the Stochastic / MACD / EMA and cross check TWO timeframes to detect a new trend?
If you think that it would be a good idea, this is the script that you are looking for.
The Trend Following Scalper (2 Time Frames) script has been developed to automate the trading activity by detecting a new trend and by scalping a fixed amount of pips each trade. That is why it is called Trend Following Scalper.
How does the script detect the new trend?
The beginning of the new trend is detected on the lower timeframe (4H is the suggested one) by joining the information of the Stochastic, MACD and Exponential Moving Average.
Once a potential trade has been detected on lower timeframe, the script confirms it by looking the upper timeframe (e.g. Daily) by gathering the same indicator / parameter information.
If both timeframes are moving in the same direction, the script open a new trade.
Why do we need to merge lower and higher timeframe before open the trade?
The lower timeframe shows a shorter Price Action context. The short price action context has a short life! By looking at the higher time frame context the script tries to exclude the short life counter-trend moves. At the end, a new trade is open only if the higher timeframe context supports the lower timeframe indication.
What about the Risk-Reward (following RR) ratio?
The RR is set by default as 1.6 (stop loss 25 pips and take profit 40 pips).
This configuration has been heavily tested on multiple crosses and it has shown a good Equity Line with a low Drawdown.
(Note: the stop loss and take profit can be changed by the user via the parameter pages. Suggest RR > 1.5)
What about the accuracy of the Script?
The average script accuracy is > 45% (tested with various crosses).
With this accuracy, and by risking 0.6% of the capital each trade, your capital will grow > 10% every 100 trades.
What about the drawdown?
It depends on the capital and the size of the position used on each trade.
For example, with an initial capital of 1000 Euros and by risking 0.5% of the capital each trade, the drawdown is close to 6%.
Do you want to try the script? Please write me!
Do you have some question? Please write me!

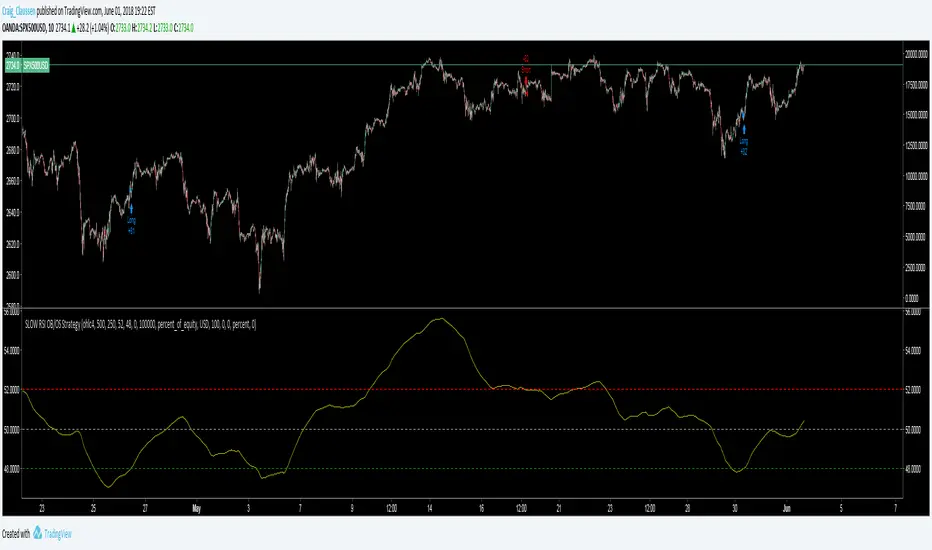
SLOW RSI OB/OS StrategySlowing the RSI down opens up a whole new world of possibilities.
This concept can work for a lot of TA indicators including the MACD.
See script source code for further description. Feel free to add pyramid trades at your own discretion in your format menu.
No this doesn't repaint!
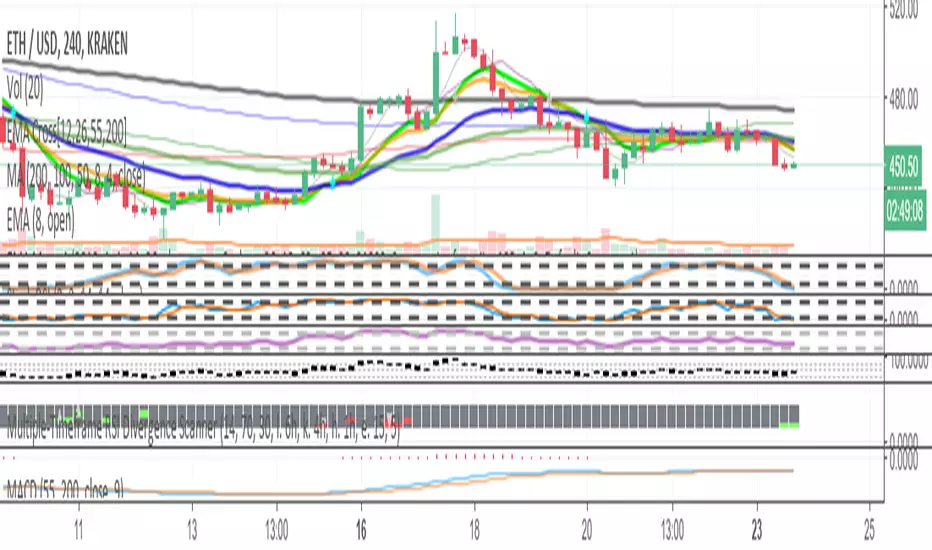
EMA Mega Cross StrategyBased on Anvamsi's script which uses 12/26 EMA crosses for entry/exit signals. I also add the following features:
* Optimized default parameters for ETH 4hr chart
* Use EMA 55/200 relationship to filter out signals
* Use RSI vs EMA of RSI to filter out signals
* Use 26/55 EMA relationship to filter out signals
* Use volume climax technique as an additional exit strategy
* Uses bull/bear RSI divs as an additional exit strategy
* Adds bull RSI div quick flip plays when nothing else is going on for extra $$
This very experimental and my first major script. I've kept it invite only because the only people using this should have a direct line of communication open with me at this point.
NOTE #1:
You can get 2018 ETH trade profitability to reach 100% if you change line 97 from:
if (shortEMA and (rsi1 <= ema(rsi1,RSIEMALength)) and shorttrend and (ema(close,26) < ema(close,55)))
to:
if (shortEMA and (rsi1 <= ema(rsi1,RSIEMALength)) and shorttrend)
Basically, you remove an extra filter from the short strategy. It's novel to see profitability hit 100% but if you look at performance from 2017, it increases the max draw down by a lot!
NOTE #2:
I couldn't get RSI bear div quick flips to work so they are disabled. The remaining short strategy is in effect.
NOTE #3:
The profitability is good for long-only, if you check Strategy Tester->Performance Summary.
NOTE #4:
I am not an expert trader (mainly due to psychological factors i think) but i can program and have a good understanding of signal processing from working with analog synthesizers. Use this at your own risk. I am not liable if you lose all of your money!
NOTE #5:
Code is really messy. Old code commented out everywhere. :/

EMA Cross Strategy - Angara123Based on Anvamsi's script.
Added a filter to only enter trades when the RSI is greater than (or less than if shorting) the 26 period EMA of the RSI.
Turned off stop losses for better gains.
will add other features as we collaborate in chat

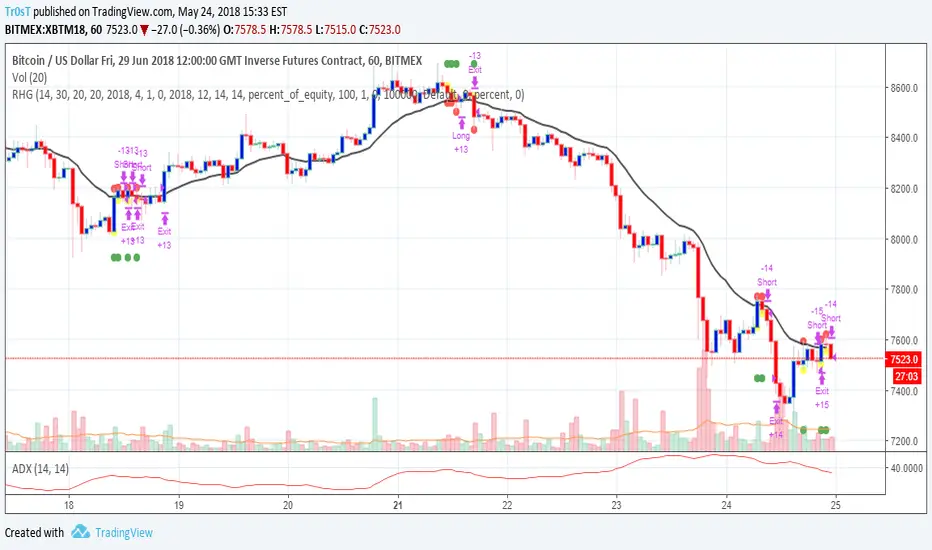
Linda Raschke's Holy GrailAnother script based on Linda Raschke's strategy with the same name from her book about swing trading.
Simple profitable trading strategyThis strategy has three components.
Philakones EMAs are a sequence of five fibonacci EMAs. They range from 55 candles (green) to 8 candles (red) in length. A strong trend or breakout is marked by the emas appearing in sequence of their length from 8 to 55 or vice versa. These EMAs are also used to signal an exit. Only two EMAs are used for exit signals - when the 13 EMA crosses over/under the 55 EMA.
RSI gives a bullish signal when 40 > rsi > 70. Exit signals are oversold (30) or overbought (70)
Stochastics give a bullish signal when stoch < 80 and an exit signal when > 95.
Results include 3 ticks of slippage and taker fees of .002. Provides a pretty smooth equity curve with a 73% win rate and beats buy and hold by than 10x (returns about 60x overall) since start of 2017.

EMAcrossover_RSI Buy/sell signal-TRXBTC_15min by rajista EMAcrossover_RSI Buy/sell signal Strategy
To be used in combination with Alerts script, both can be added to your tradingview charts (Chart time-frame should be set to 15min) like you add any other simple indicator.
Add this script to your favorites and once you have been granted access, you will be notified in your Tradingview notifications section, then you can go ahead and add these two scripts into your charts from your favorite section of Indicator menu in Tradingview.
Benefits of this strategy:
1> Fully automated buy/sell signals 24x7
2>Your trades will always be based on a certain entry and exit plan.
3>No emotions involved with these trading calls, so no chance of FOMO buying/Panic Sell
4>You can fully customize the settings with a simple click(customization details given below)
5>Its completely free of cost!!!
There are two parts of this automated trading call system:
1>Strategy script- Gives the buy/sell signals based on the settings provided.
2>Alert script- Gives Alert notifications in tradingview when a buy/sell call is made.
Principle of working is very simple to understand:
Stragey script makes:
Buy call - When the 9EMA crosses above the 21EMA or RSI level-20 is reached in 15min-Chart.
Sell call -When 9EMA crosses below the 21EMA or RSI level-70 is reached in 15min-Chart.
Above values of EMA's and RSI are default values , which can be changed easily in settings panel of Strategy script.
Alert Script allows you to add Alerts when these buy/sell calls are made.
To create a Buy call alert:
1> Click on the create alert icon in your chart (top-centre)
2>Click on Condition -drop down button and select EMAcross_rsi_Alerts
3>Below that bar you will see another bar titled "Buy"-click on its drop down menu and select "Crossing Down"
4>Below that bar right next to Value change 0 to 0.9.
5>Set expiration date for your alerts as per your wish
6>Ensure "Show Popup" and "Play sound" is checked
7>You can check option of sending the alert to your email also.
Finally click on create.
To create Sell Alert:
Repeat same process, except that, after step 2- Do this- change the "long" option to "short" by clicking on the drop down menu right next to the first bar.
Click on create, Finally both of your automated buy/sell call alerts will be configured.
I know its been 2-3 days since i tweeted about this strategy and now i am making it available, you can understand i had to put in a lot of working hours, towards creating the source code for the strategy script and then for alerts script and even more so towards finding the perfect default settings which can be used straight away by anyone, even if you are new in crypto trading, apart from the time which i dedicate to analyse charts and pass on the knowledge/info to you all.
My next post will be even more helpful to you people as i am currently testing "fully automated trading" yea you heard that right!! - This system will trade 24x7 for you guys/girls no matter wherever you are either you are sleeping or watching a movie, your trades would still be getting executed with a proper entery-exit plan on a crypto exchange.
MP ZeroLag EMANew script based on zlema. Hopefully responds better tot ake advantage of margin trading. As usual, commands for both spot trading and margin trading are included, just need to comment or uncomment (using // ) which you prefer. They are just labels so both work in the same way (long/buy, short/sell). Also added some flair to pretty it up a bit, and yes, those divergences are in fact functional, but not really part of the script (disclosure- the divergences are taken from DonovanWall's ideas, full credit here). There is a "new stuff" section, which you CAN use, but right now it was for art and introduced way too many functions at once to be of any use, but feel free to explore as an Easter Egg :)
Autoview friendly in design :)
As usual, all proceeds go to the betterment of these scripts as well as my upcoming surgery (Carpel Tunnel Syndrome, yuck)
1Dsg49Zt2FQ9BnUHrmXQwvhL5dd3teqa7g
ltc addy- LYUpgsHSHnKeYdNaj9bu9prK4QsnJXEQtP
pinkcoin addy- 2PoeXyAk3rF9FmMC8azme2mGzMYsEiZ5eS
