Session MasterSession Master Indicator
Overview
The "Session Master" indicator is a unique tool designed to enhance trading decisions by providing visual cues and relevant information during the critical last 15 minutes of a trading session. It also integrates advanced trend analysis using the Average Directional Index (ADX) and Directional Movement Index (DI) to offer insights into market trends and potential entry/exit points.
Originality and Functionality
This script combines session timing, visual alerts, and trend analysis in a cohesive manner to give traders a comprehensive view of market behavior as the trading day concludes. Here’s a breakdown of its key features:
Last 15 Minutes Highlight : The script identifies the last 15 minutes of the trading session and highlights this period with a semi-transparent blue background, helping traders focus on end-of-day price movements.
Previous Session High and Low : The script dynamically plots the high and low of the previous trading session. These levels are crucial for identifying support and resistance and are highlighted with dashed lines and labeled for easy identification during the last 15 minutes of the current session.
Directional Movement and Trend Analysis : Using a combination of ADX and DI, the script calculates and plots trend strength and direction. A 21-period Exponential Moving Average (EMA) is plotted with color coding (green for bullish and red for bearish) based on the DI difference, offering clear visual cues about the market trend.
Technical Explanation
Last 15 Minutes Highlight:
The script checks the current time and compares it to the session’s last 15 minutes.
If within this period, the background color is changed to a semi-transparent blue to alert the trader.
Previous Session High and Low:
The script retrieves the high and low of the previous daily session.
During the last 15 minutes of the session, these levels are plotted as dashed lines and labeled appropriately.
ADX and DI Calculation:
The script calculates the True Range, Directional Movement (both positive and negative), and smoothes these values over a specified length (28 periods by default).
It then computes the Directional Indicators (DI+ and DI-) and the ADX to gauge trend strength.
The 21-period EMA is plotted with dynamic color changes based on the DI difference to indicate trend direction.
How to Use
Highlight Key Moments: Use the blue background highlight to concentrate on market movements in the critical last 15 minutes of the trading session.
Identify Key Levels: Pay attention to the plotted high and low of the previous session as they often act as significant support and resistance levels.
Assess Trend Strength: Use the ADX and DI values to understand the strength and direction of the market trend, aiding in making informed trading decisions.
EMA for Entry/Exit: Use the color-coded 21-period EMA for potential entry and exit signals based on the trend direction indicated by the DI.
Conclusion
The "Session Master" indicator is a powerful tool designed to help traders make informed decisions during the crucial end-of-session period. By combining session timing, previous session levels, and advanced trend analysis, it provides a comprehensive overview that is both informative and actionable. This script is particularly useful for intraday traders looking to optimize their strategies around session close times.
Exponential Moving Average (EMA)

Exponential Moving Average with ADR bandIndicator: Exponential Moving Average with ADR Band
This TradingView script calculates and displays an Exponential Moving Average (EMA) along with an Average Daily Range (ADR) band around it. The indicator helps traders identify potential dynamic support and resistance levels adjusted for market volatility. Especially significant moves that originate from the ZONE and reach outside should be taken seriously.
Key Features:
EMA Calculation: The script computes the Exponential Moving Average (EMA) of the closing prices over a user-defined period.
ADR Band: It calculates the Average Daily Range (ADR) using a Simple Moving Average (SMA) of the daily high-low range over the same period.
Adjustable Parameters:
Length: The period for both the EMA and the ADR calculation, which can be set by the user (default is 20).
Multiple: A multiplier for the ADR to adjust the width of the bands around the EMA (default is 1).
Plotting: The EMA is plotted as an orange line. The upper and lower ADR bands are plotted around the EMA, and the area between these bands is filled with a translucent orange color to highlight the channel.
How It Works:
EMA Calculation: The script computes the EMA of the closing prices using the specified length.
ADR Calculation: The daily range (high-low) is averaged over the same length to get the ADR.
Band Creation: The upper band is created by adding the ADR (multiplied by the user-defined multiple) to the EMA. The lower band is created by subtracting the ADR (multiplied by the user-defined multiple) from the EMA.
Visualization: The EMA and ADR bands are plotted, and the area between the bands is filled to create a clear visual representation of the ADR channel.
Usage:
This indicator can be used to gauge market volatility and potential support/resistance zones.
The ADR band provides a dynamic range that adjusts with market conditions, helping traders identify potential breakout and reversal points.
To customize the indicator, adjust the 'Length' and 'ADR multiple' parameters to suit your trading style and the specific characteristics of the asset you are analyzing.

Long/Short EMA Premium [NL]1. EMA Calculation :
- The script calculates three Exponential Moving Averages (EMAs): EMA 1, EMA 2, and EMA 50.
- The lengths of EMA 1 and EMA 2 are customizable by the user inputs `ema1Length` and `ema2Length`, respectively.
- EMA 50 is fixed with a length of 50.
2. EMA Crossover Detection :
- The script detects crossovers between EMA 1 and EMA 2 using the `ta.crossover()` and `ta.crossunder()` functions, storing the crossover events in the `cross` variable.
3. Crossover Symbol :
- A triangle-up shape is plotted below the bars when there is a crossover between EMA 1 and EMA 2. This symbol visually indicates the crossover points.
4. Trade Signals :
- Long and short signals are generated based on the crossover events and the relationship between the closing price and EMA 1.
- For a long signal, EMA 1 must cross above EMA 2, and both the current and previous closing prices must be above EMA 1.
- For a short signal, EMA 1 must cross below EMA 2, and both the current and previous closing prices must be below EMA 1.
5. Stop Conditions :
- Stop conditions are used to exit long or short trades.
- If in a long trade, the script checks if the low of the previous candle crossed below EMA 1 and the high of the current candle is below EMA 1. If true, it triggers the "Stop Long" condition.
- If in a short trade, the script checks if the high of the previous candle crossed above EMA 1 and the low of the current candle is above EMA 1. If true, it triggers the "Stop Short" condition.
6. Plotting :
- The script plots EMA 1, EMA 2, and EMA 50 on the chart to visualize their movements.
7. Alerts :
- The script generates alerts for EMA crossovers, long and short signals, as well as stop long and stop short conditions, allowing traders to receive notifications when these events occur.
Overall, the script provides a comprehensive EMA crossover strategy with customizable parameters and clear trade signals and exit conditions.

Daniels Script v2 EMA 4h y DTitle:
"EMA 200 Dynamic Projection on 4H and Daily Charts"
Description:
"This script is designed to provide traders with a comprehensive view of market trends by displaying the 200-period Exponential Moving Average (EMA) on both 4-hour and daily charts simultaneously. Unlike typical EMA representations, this script enhances user decision-making by projecting the potential future path of these EMAs using a dynamic slope calculation.
The dynamic projection feature calculates the slope based on recent changes in the EMA, allowing traders to visualize potential future trends more accurately. This innovative approach helps in identifying potential areas of support and resistance before they are fully formed, offering traders a strategic advantage in planning their entries and exits.
Key Features:
Dual Time Frame Analysis: View 200-period EMAs for both 4-hour and daily charts on a single graph.
Dynamic EMA Projections: Projected using a calculated slope from recent EMA changes, presented as dotted lines for clear distinction.
Enhanced Trend Visualization: Helps in recognizing trend continuations or reversals early, aiding in risk management and decision-making processes.
Usage:
Simply add the script to your chart, and the EMAs along with their projections will automatically be displayed. The 4-hour EMA is shown in green, while the daily EMA is in red. Projections extend from the last known data point, providing a visual guide to potential future movements.
This script is unique in its approach to combining real-time EMA analysis with predictive modeling, making it a valuable tool for traders looking to enhance their technical analysis capabilities."
## SPANISH
Título del Script:
"Proyección Dinámica de la EMA 200 en Gráficos de 4H y Diarios"
Descripción del Script:
"Este script está diseñado para proporcionar a los traders una visión integral de las tendencias del mercado al mostrar la Media Móvil Exponencial (EMA) de 200 periodos tanto en los gráficos de 4 horas como diarios simultáneamente. A diferencia de las representaciones típicas de la EMA, este script mejora la toma de decisiones del usuario al proyectar el posible camino futuro de estas EMAs utilizando un cálculo de pendiente dinámico.
La función de proyección dinámica calcula la pendiente basada en cambios recientes en la EMA, permitiendo a los traders visualizar tendencias futuras potenciales con mayor precisión. Este enfoque innovador ayuda a identificar áreas potenciales de soporte y resistencia antes de que se formen completamente, ofreciendo a los traders una ventaja estratégica en la planificación de sus entradas y salidas.
Características Clave:
Análisis de Doble Marco Temporal: Visualiza las EMAs de 200 periodos para los gráficos de 4 horas y diarios en un solo gráfico.
Proyecciones Dinámicas de la EMA: Proyectadas utilizando una pendiente calculada a partir de cambios recientes en la EMA, presentadas como líneas punteadas para una clara distinción.
Visualización Mejorada de Tendencias: Ayuda en el reconocimiento temprano de continuaciones o reversos de tendencias, asistiendo en la gestión de riesgos y en los procesos de toma de decisiones.
Uso:
Simplemente añade el script a tu gráfico, y las EMAs junto con sus proyecciones se mostrarán automáticamente. La EMA de 4 horas se muestra en verde, mientras que la EMA diaria está en rojo. Las proyecciones se extienden desde el último punto de datos conocido, proporcionando una guía visual hacia movimientos futuros potenciales.
Este script es único en su enfoque de combinar análisis de EMA en tiempo real con modelado predictivo, convirtiéndolo en una herramienta valiosa para traders que buscan mejorar sus capacidades de análisis técnico."

Support Resistance & Ema
The "Support Resistance & Ema" indicator combines various strategies to assist traders in identifying significant support and resistance levels on the chart and in following trends through exponential moving averages (EMA). This script is designed to be versatile and useful in different trading strategies.
Key Features:
Support and Resistance: It utilizes pivot highs and lows to pinpoint support and resistance levels. These levels are plotted on the chart with lines that change color based on trend reversals.
Trend Identification: The indicator follows trends using four conditions:
_hh: Higher highs and higher lows, indicating an uptrend.
_ll: Lower highs and lower lows, indicating a downtrend.
_hl: Higher highs and lower lows, indicating weakening uptrend or an impending reversal.
_lh: Lower highs and higher lows, indicating weakening downtrend or an impending reversal.
Exponential Moving Averages (EMA): It also displays various EMAs (9, 21, 50, 100, 200) on the chart to provide further insights into the trend direction.
Usage:
Support and Resistance: Support and resistance lines are automatically plotted on the chart. Trend reversals are highlighted by changing the color of the lines.
Trend Identification: The _hh, _ll, _hl, _lh conditions help identify trend changes. When one of these conditions is met, it indicates a particular configuration of highs and lows that might suggest a trading opportunity.
Exponential Moving Averages (EMA): The EMAs are plotted on the chart and can be used to confirm trends identified by the main indicator.
To use this script, you need to add it as an indicator to your trading chart. Once applied, the support, resistance lines, and EMAs will be visible on the chart, providing traders with valuable information to make informed trading decisions.
In summary, this script offers a comprehensive way to identify significant support and resistance levels, spot market trends, and confirm those trends through the use of exponential moving averages.

F.B_Double Hull Moving Average Trend TrackerThe F.B_Double Hull Moving Average Trend Tracker indicator is designed to identify market trends and is based on two Hull Moving Averages.
The "Hull Moving Average" (HMA) is a fast and smooth moving average that exhibits a rather unique behavior. The HMA attempts to completely remove lag while simultaneously presenting smoother results.
The first derivative is calculated for each HMA 1 and HMA 2.
If HMA 1 derivative > 0 and HMA 2 derivative > 0, then color the HMA lines and bar color green.
If HMA 1 derivative < 0 and HMA 2 derivative < 0, then color the HMA lines and bar color red.
If the slope of the derivative is different between HMA 1 and HMA 2, then color the HMA lines and bar color gray.
Meaning of colors:
Green ⇒ Uptrend
Gray ⇒ Price consolidation, trend weakness, or correction
Red ⇒ Downtrend
Best used in conjunction with additional indicators.

Moving Average Crossover MonitorMoving Average Crossover Monitor: Gain Insight into Market Trends
The Moving Average Crossover Monitor is a specialized tool crafted for traders seeking to understand and predict market trends more effectively. This indicator's primary focus lies in analyzing consecutive candle movements above or below specified moving averages and providing predictive estimates based on historical data.
Key Features:
1. Consecutive Candle Tracking: The indicator meticulously counts and tracks the number of consecutive candles that close above or below a selected moving average (MA1). This tracking offers a tangible measure of trend persistence over time.
2. Historical Analysis for Future Prediction: By analyzing past trends, the indicator provides insights into potential future movements. It estimates the likelihood of upcoming candles continuing above or below the moving average based on historical patterns.
3. Dynamic Visualization: Moving averages (SMA, WMA, EMA) are dynamically plotted on the chart, clearly displaying crossover points and trend transitions.
How It Works:
1. Moving Average Calculation: Select your preferred moving average type (SMA, WMA, EMA) and define short and long periods. The indicator computes two moving averages (MA1 and MA2) based on these parameters.
2. Consecutive Candle Analysis:
- Above MA1: Tracks and counts consecutive candles closing above MA1, indicating potential bullish momentum.
- Below MA1: Tracks and counts consecutive candles closing below MA1, suggesting potential bearish sentiment.
3. Future Trend Prediction: Based on historical data of consecutive candle movements, the indicator estimates the likelihood of the next candle continuing in the same direction (above or below MA1).
Advantages for Traders:
1. Quantitative Insights: Use numerical data on consecutive candles to gauge trend strength and durability.
2. Predictive Analytics: Leverage historical patterns to anticipate future market movements and adjust trading strategies accordingly.
3. Decision Support Tool: Gain clarity on trend transitions, empowering timely and informed trading decisions.
Disclaimer:
This indicator is provided for educational purposes only and should not be considered as financial advice. Trading involves risks, and past performance is not indicative of future results. Traders should conduct their own analysis and exercise caution when making trading decisions based on any indicator or tool. Always consider risk management strategies and consult with a qualified financial advisor if needed.

Price Based Z-Trend - Strategy [presentTrading]█ Introduction and How it is Different
Z-score: a statistical measurement of a score's relationship to the mean in a group of scores.
Simple but effective approach.
The "Price Based Z-Trend - Strategy " leverages the Z-score, a statistical measure that gauges the deviation of a price from its moving average, normalized against its standard deviation. This strategy stands out due to its simplicity and effectiveness, particularly in markets where price movements often revert to a mean. Unlike more complex systems that might rely on a multitude of indicators, the Z-Trend strategy focuses on clear, statistically significant price movements, making it ideal for traders who prefer a streamlined, data-driven approach.
BTCUSD 6h LS Performance
█ Strategy, How It Works: Detailed Explanation
🔶 Calculation of the Z-score
"Z-score is a statistical measurement that describes a value's relationship to the mean of a group of values. Z-score is measured in terms of standard deviations from the mean. If a Z-score is 0, it indicates that the data point's score is identical to the mean score. A Z-score of 1.0 would indicate a value that is one standard deviation from the mean. Z-scores may be positive or negative, with a positive value indicating the score is above the mean and a negative score indicating it is below the mean."
The Z-score is central to this strategy. It is calculated by taking the difference between the current price and the Exponential Moving Average (EMA) of the price over a user-defined length, then dividing this by the standard deviation of the price over the same length:
z = (x - μ) /σ
Local
🔶 Trading Signals
Trading signals are generated based on the Z-score crossing predefined thresholds:
- Long Entry: When the Z-score crosses above the positive threshold.
- Long Exit: When the Z-score falls below the negative threshold.
- Short Entry: When the Z-score falls below the negative threshold.
- Short Exit: When the Z-score rises above the positive threshold.
█ Trade Direction
The strategy allows users to select their preferred trading direction through an input option.
█ Usage
To use this strategy effectively, traders should first configure the Z-score thresholds according to their risk tolerance and market volatility. It's also crucial to adjust the length for the EMA and standard deviation calculations based on historical performance and the expected "noise" in price data.
The strategy is designed to be flexible, allowing traders to refine settings to better capture profitable opportunities in specific market conditions.
█ Default Settings
- Trade Direction: Both
- Standard Deviation Length: 100
- Average Length: 100
- Threshold for Z-score: 1.0
- Bar Color Indicator: Enabled
These settings offer a balanced starting point but can be customized to suit various trading styles and market environments. The strategy's parameters are designed to be adjusted as traders gain experience and refine their approach based on ongoing market analysis.
Z-score is a must-learn approach for every algorithmic trader.

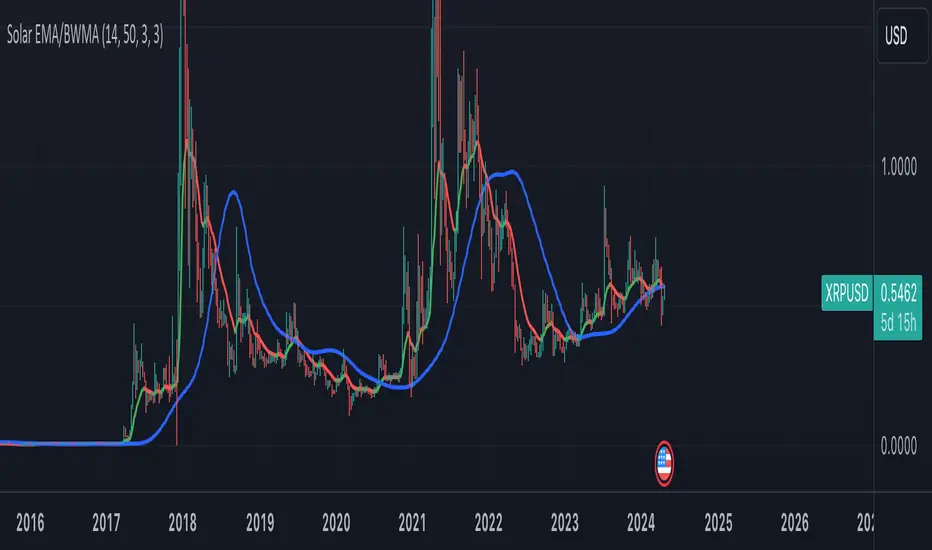
Combined Indicator: Solar EMA and BWMACombined Indicator: Solar EMA and BWMA
This custom indicator combines two popular moving average techniques, the Exponential Moving Average (EMA) and the Barycenter Weighted Moving Average (BWMA), to provide insights into market trends and potential trade opportunities.
Solar EMA (Exponential Moving Average):
The Solar EMA is a dynamic moving average that reacts quickly to price changes while reducing lag.
It is plotted on the chart with customizable lengths, allowing traders to adapt to different market conditions.
Bullish (upward) trends are indicated by a green line, bearish (downward) trends by a red line, and neutral periods by a yellow line.
BWMA (Barycenter Weighted Moving Average):
The BWMA is a weighted moving average that emphasizes recent price action while maintaining smoothness.
It is calculated using a combination of alpha and beta parameters, providing flexibility in tuning to specific market behaviors.
The BWMA line is plotted on the chart, with color indicating trend direction: blue for bullish, red for bearish, and gray for neutral.
Key Features:
Dynamic adaptation to different timeframes, adjusting lengths for both EMA and BWMA based on the selected timeframe.
Detection of potential trend changes and significant market movements using a combination of EMA trend analysis and RSI (Relative Strength Index).
Buy and sell signals generated based on support and resistance levels, providing actionable insights for traders.
Usage:
Traders can use the Solar EMA and BWMA to identify trends, confirm trend reversals, and plan entry and exit points for trades.
Combining both moving averages offers a comprehensive view of market sentiment and enhances decision-making processes.
Disclaimer:
This indicator is intended for educational and informational purposes only and should not be construed as financial advice. Traders are encouraged to conduct their own research and analysis before making any trading decisions.
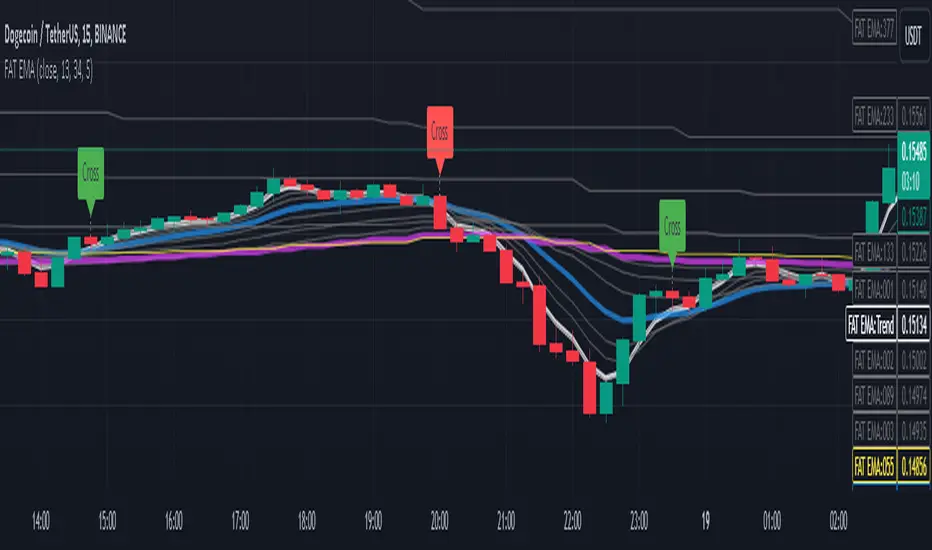
Fibonacci Adaptive Timeframe EMA (FAT EMA)The "Fibonacci Adaptive Timeframe EMA" is a sophisticated trading indicator designed for the TradingView platform, leveraging the power of Exponential Moving Averages (EMAs) determined by Fibonacci sequence lengths to provide traders with dynamic market insights. This indicator overlays directly on the price chart, offering a unique blend of trend analysis, smoothing techniques, and timeframe adaptability, making it an invaluable tool for traders looking to enhance their technical analysis strategy.
Key Features
1. Fibonacci-Based EMA Lengths: Utilizes the Fibonacci sequence to select EMA lengths, incorporating natural mathematical ratios believed to be significant in financial markets. The available lengths range from 1 to 987, allowing for detailed trend analysis over various periods.
2. Multiple Smoothing Methods: Offers the choice between several smoothing techniques, including Simple Moving Average (SMA), Exponential Moving Average (EMA), Smoothed Moving Average (SMMA or RMA), Weighted Moving Average (WMA), and Volume Weighted Moving Average (VWMA). This versatility ensures that users can tailor the indicator to suit their analytical preferences.
3. Timeframe Adaptability: Features the ability to fetch and calculate EMAs from different timeframes, providing a multi-timeframe analysis within a single chart view. This adaptability gives traders a broader perspective on market trends, enabling more informed decision-making.
4. Dynamic Visualization Options: Traders can customize the display to suit their analysis needs, including toggling the visibility of Fibonacci EMA lines, EMA prices, and smoothed EMA lines. Additionally, forecast lines can be projected into the future, offering speculative insights based on current trends.
5. Ema Tail Visualization: An innovative feature allowing for the visualization of the 'tail' or the continuation of EMA lines, which can be particularly useful for identifying trend persistence or reversal points.
6. User-friendly Customization: Through a series of input options, traders can easily adjust the source data, Fibonacci lengths, smoothing method, and visual aspects such as line colors and transparency, ensuring a seamless integration into any trading strategy.
Application and Use Cases
The "Fibonacci Adaptive Timeframe EMA" indicator is designed for traders who appreciate the significance of Fibonacci numbers in market analysis and seek a flexible tool to analyze trends across different timeframes. Whether it's for scalping, day trading, or long-term investing, this indicator can provide valuable insights into price dynamics, trend strengths, and potential reversal points. Its adaptability makes it suitable for various asset classes, including stocks, forex, commodities, and cryptocurrencies.
Fibonacci Timeframe Adaptive EMAThe "Fibonacci Timeframe Adaptive EMA" is a sophisticated trading indicator designed for the TradingView platform, leveraging the power of Exponential Moving Averages (EMAs) determined by Fibonacci sequence lengths to provide traders with dynamic market insights. This indicator overlays directly on the price chart, offering a unique blend of trend analysis, smoothing techniques, and timeframe adaptability, making it an invaluable tool for traders looking to enhance their technical analysis strategy.
Key Features
1. Fibonacci-Based EMA Lengths: Utilizes the Fibonacci sequence to select EMA lengths, incorporating natural mathematical ratios believed to be significant in financial markets. The available lengths range from 1 to 987, allowing for detailed trend analysis over various periods.
2. Multiple Smoothing Methods: Offers the choice between several smoothing techniques, including Simple Moving Average (SMA), Exponential Moving Average (EMA), Smoothed Moving Average (SMMA or RMA), Weighted Moving Average (WMA), and Volume Weighted Moving Average (VWMA). This versatility ensures that users can tailor the indicator to suit their analytical preferences.
3. Timeframe Adaptability: Features the ability to fetch and calculate EMAs from different timeframes, providing a multi-timeframe analysis within a single chart view. This adaptability gives traders a broader perspective on market trends, enabling more informed decision-making.
4. Dynamic Visualization Options: Traders can customize the display to suit their analysis needs, including toggling the visibility of Fibonacci EMA lines, EMA prices, and smoothed EMA lines. Additionally, forecast lines can be projected into the future, offering speculative insights based on current trends.
5. Ema Tail Visualization: An innovative feature allowing for the visualization of the 'tail' or the continuation of EMA lines, which can be particularly useful for identifying trend persistence or reversal points.
6. User-friendly Customization: Through a series of input options, traders can easily adjust the source data, Fibonacci lengths, smoothing method, and visual aspects such as line colors and transparency, ensuring a seamless integration into any trading strategy.
Application and Use Cases
The "Fibonacci Timeframe Adaptive EMA" indicator is designed for traders who appreciate the significance of Fibonacci numbers in market analysis and seek a flexible tool to analyze trends across different timeframes. Whether it's for scalping, day trading, or long-term investing, this indicator can provide valuable insights into price dynamics, trend strengths, and potential reversal points. Its adaptability makes it suitable for various asset classes, including stocks, forex, commodities, and cryptocurrencies.

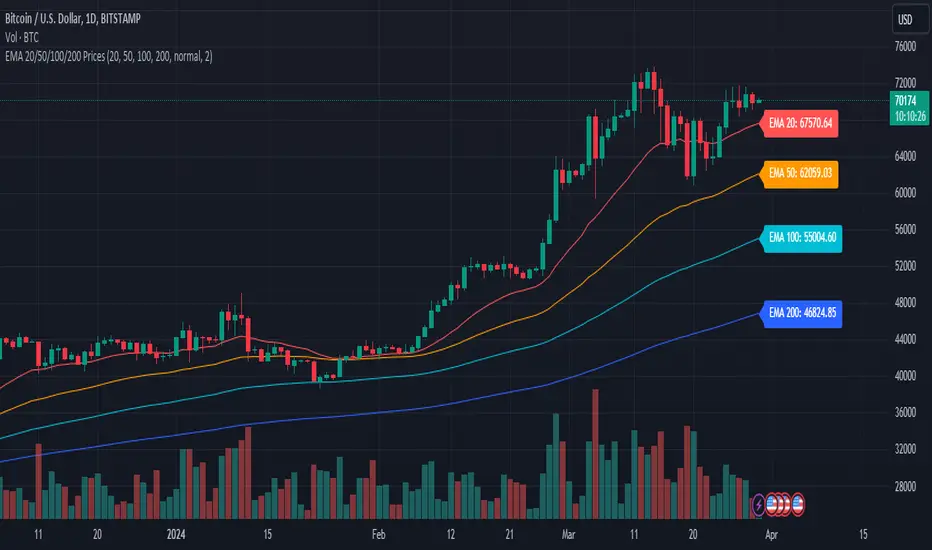
EMA 20/50/100/200 PricesDescription:
Introducing the EMA Indicator with Dynamic Labels, a unique addition to the TradingView Public Library. This innovative script enhances trend analysis and decision-making by overlaying four Exponential Moving Averages (EMAs) – 20, 50, 100, and 200 periods – on your chart, each with a distinct color for quick identification.
What sets this script apart?
Unlike standard EMA indicators, this script includes dynamic labels that display the current price level of each EMA at the latest price bar. This feature provides an instant snapshot of market sentiment, offering insights into potential dynamic support or resistance levels.
Key Features:
Customizable EMA Periods: Tailor the EMA periods according to your trading strategy, allowing for flexibility across different timeframes and assets.
Adaptive Label Sizes: A unique function adjusts label sizes based on user input, ensuring optimal readability across various display settings.
Color-Coded EMAs: Quickly differentiate between the EMAs with pre-defined colors, enhancing visual clarity and trend recognition.
How to Use:
Trend Analysis: Use the EMAs to identify the overall market trend. When shorter EMAs are above longer ones, it suggests a bullish trend, and vice versa.
Trade Entries and Exits: Look for crossovers of the EMAs as potential entry or exit signals. Dynamic labels will help you pinpoint the exact levels.
Customization: Adjust the EMA periods and label sizes under the indicator settings to match your trading style and preferences.
Underlying Concepts:
This script utilizes the classic EMA calculation but innovates by integrating dynamic, real-time labels and customizable periods. The choice of four different periods allows for a nuanced analysis of trend strength and direction, catering to both short-term traders and long-term investors.
Originality and Contribution:
The "Advanced EMA Indicator with Dynamic Labels" is original in its approach to providing real-time, actionable data through dynamic labels. It caters to the community's need for more interactive and informative indicators that go beyond basic trend analysis.
Conclusion:
Whether you're a novice trader seeking to understand market trends or an experienced investor looking for nuanced analysis tools, this script offers valuable insights and flexibility. It stands as a testament to the power of Pine Script in creating practical, user-centric trading tools.
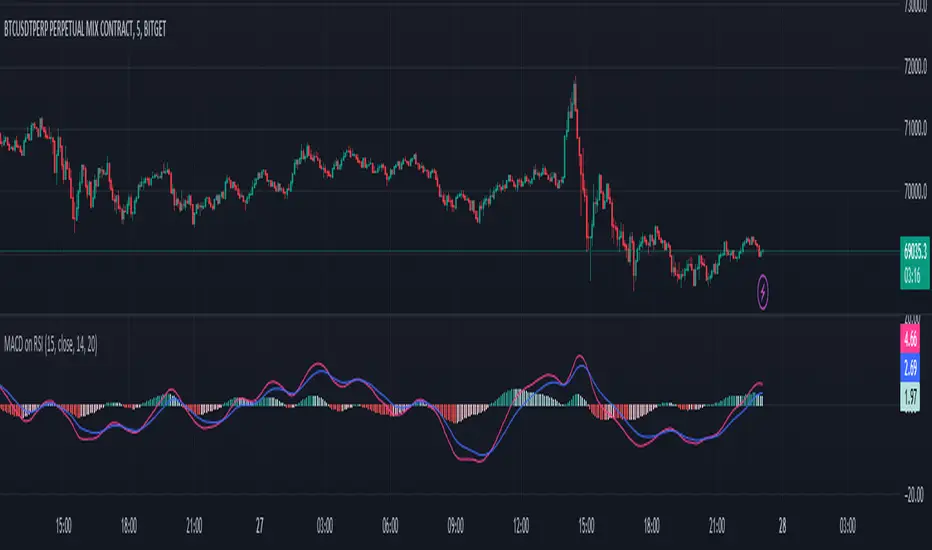
MACD on RSIThe MACD on RSI indicator combines elements of the Moving Average Convergence Divergence (MACD) and the Relative Strength Index (RSI). It calculates the RSI on a specified source with a customizable length, then applies two exponential moving averages (EMAs) to the RSI values. The difference between these EMAs forms the MACD line, visually representing the momentum of the RSI.
Entry FraggerEntry Fragger is a simple buy signal indicator.
It is most suitable for cryptocurrency, especially for altcoins on the 5 minute to daily timeframe and is based on simple volume calculations, in combination with EMA's.
Main Signal Logic explained:
A buy signal is generated by counting candles with an above average sell volume of 130% to 170%, taking into account the candles position below and above the 50 and 200 EMA.
If criteria meet, the first green candle above the 50 EMA's suggests upcoming higher prices.
The indicator has 2 input variables.
"Signal Confirmations (0 - 7):" Changes signal accuracy by a defining an ammount of high sell volume candles necessary below the 50 EMA.
"Volume Calculation Base (9 - 200):" Sets the exponential volume multiplier, this affects candle coloring and the volume calculation inside the candle.
"Style Settings": Turn ON/OFF Signals, Cloud, Bar Coloring, EMA's, etc...
There are no generally suitable default numbers for those 2 inputs, those have to be tested out, depending on cryptocurrency and timeframe.
The calculation is very basic, the underlying idea being, market maker initiating range breakouts through rapid increase of volume above or below the EMA's .
Example settings:
SOLUSDT: Signal Confirmations: 2, Volume Calculation Base 13.
SOLUSDT: Signal Confirmations: 0, Volume Calculation Base 20.
As you can see it affects signals quite a lot, but staying accurate.
Finetune the inputs to your preference.
Risk to Reward, Stoploss, Take Profit, position sizing, etc... is up to the user.
Recommended entry is to wait for following candle closes, entering half of the candle size and setting Stoploss outside the structure, like this:
Or right below the candles open, for safety.

QTE Scalper ModifiedA modified version of the QTE scalper indicator. Produces a buy/sell signal based on a 2 candle pattern. For long signals it produces a signal when the high and low of the second candle are below the high and low of the first candle and both candles close above the 10 period EMA. The reverse is true for short signals.
Added functionality so that signals will trigger an alert: Add the indicator to the chart on the instrument and timeframe you wish to use it on. Add an alert and in the 'condition' section choose the indicator and set the trigger as 'once per bar close'. You will have to set individual alerts for both long and short signals and if you change the time period on the chart.

MBAND 200 4H BTC/USDT - By MGS-TradingMBAND 200 4H BTC/USDT with RSI and Volume by MGS-Trading: A Neural Network-Inspired Indicator
Introduction:
The MBAND 200 4H BTC/USDT with RSI and Volume represents a groundbreaking achievement in the integration of artificial intelligence (AI) into cryptocurrency market analysis. Developed by MGS-Trading, this indicator is the culmination of extensive research and development efforts aimed at leveraging AI's power to enhance trading strategies. By synthesizing neural network concepts with traditional technical analysis, the MBAND indicator offers a dynamic, multi-dimensional view of the market, providing traders with unparalleled insights and actionable signals.
Innovative Approach:
Our journey to create the MBAND indicator began with a simple question: How can we mimic the decision-making prowess of a neural network in a trading indicator? The answer lay in the weighted aggregation of Exponential Moving Averages (EMAs) from multiple timeframes, each serving as a unique input akin to a neuron in a neural network. These weights are not arbitrary; they were painstakingly optimized through backtesting across various market conditions to ensure they reflect the significance of each timeframe’s contribution to overall market dynamics.
Core Features:
Neural Network-Inspired Weights: The heart of the MBAND indicator lies in its AI-inspired weighting system, which treats each timeframe’s EMA as an input node in a neural network. This allows the indicator to process complex market data in a nuanced and sophisticated manner, leading to more refined and informed trading signals.
Multi-Timeframe EMA Analysis: By analyzing EMAs from 15 minutes to 3 days, the MBAND indicator captures a comprehensive snapshot of market trends, enabling traders to make informed decisions based on a broad spectrum of data.
RSI and Volume Integration: The inclusion of the Relative Strength Index (RSI) and volume data adds layers of confirmation to the signals generated by the EMA bands. This multi-indicator approach helps in identifying high-probability setups, reinforcing the neural network’s concept of leveraging multiple data points for decision-making.
Usage Guidelines:
Signal Interpretation: The MBAND bands provide a visual representation of the market’s momentum and direction. A price moving above the upper band signals strength and potential continuation of an uptrend, while a move below the lower band suggests weakness and a possible downtrend.
Overbought/Oversold Conditions: The RSI component identifies when the asset is potentially overbought (>70) or oversold (<30). Traders should watch for these conditions near the MBAND levels for potential reversal opportunities.
Volume Confirmation: An increase in volume accompanying a price move towards or beyond an MBAND level serves as confirmation of the strength behind the move. This can indicate whether a breakout is likely to sustain or if a reversal has substantial backing.
Strategic Entry and Exit Points: Combine the MBAND readings with RSI and volume indicators to pinpoint strategic entry and exit points. For example, consider entering a long position when the price is near the lower MBAND, RSI indicates oversold conditions, and there is a notable volume increase.
About MGS-Trading:
At MGS-Trading, we are passionate about harnessing the transformative power of AI to revolutionize cryptocurrency trading. Our indicators and tools are designed to provide traders with advanced analytics and insights, drawing on the latest AI techniques and methodologies. The MBAND 200 4H BTC/USDT with RSI and Volume indicator is a prime example of our commitment to innovation, offering traders a sophisticated, AI-enhanced tool for navigating the complexities of the cryptocurrency markets.
Disclaimer:
The MBAND indicator is provided for informational purposes only and does not constitute investment advice. Trading cryptocurrencies involves significant risk and can result in the loss of your investment. We recommend conducting your own research and consulting with a qualified financial advisor before making any trading decisions.

Cauchy Distribution Trend AnalysisThis custom Pine Script indicator is designed to analyze assets, including cryptocurrencies, through a lens inspired by the Cauchy distribution's characteristics. It focuses on identifying potential long and short opportunities by evaluating the asset's price position relative to a dynamically calculated median price and a scale parameter. Here's a breakdown of its components and how to use it:
Components
Median Length: The period over which the median price is calculated. The median price acts as a proxy for the Cauchy distribution's location parameter, representing a central value around which the market price fluctuates.
MA Length: The length for calculating the moving average, which is used to determine the scale parameter. The scale parameter estimates the average volatility around the median price, adjusted for the selected averaging method.
Moving Average Type: Offers a choice between HMA (Hull Moving Average), SMA (Simple Moving Average), and EMA (Exponential Moving Average) to calculate the scale parameter. This flexibility allows users to tailor the sensitivity of the scale parameter to the asset's price volatility.
Median Price Calculation: Uses the close price (by default) to calculate the median price over the specified period.
Scale Parameter Calculation: A function that calculates the scale parameter based on the chosen average source. This parameter is used to identify the threshold for long and short conditions.
Strategy Logic
Long Condition: Triggered when the asset's close price is greater than the sum of the median price and the scale parameter. This indicates that the asset's price has moved significantly above the median price, suggesting bullish momentum.
Short Condition: Triggered when the asset's close price is less than the difference between the median price and the scale parameter. This indicates that the asset's price has moved significantly below the median price, suggesting bearish momentum.

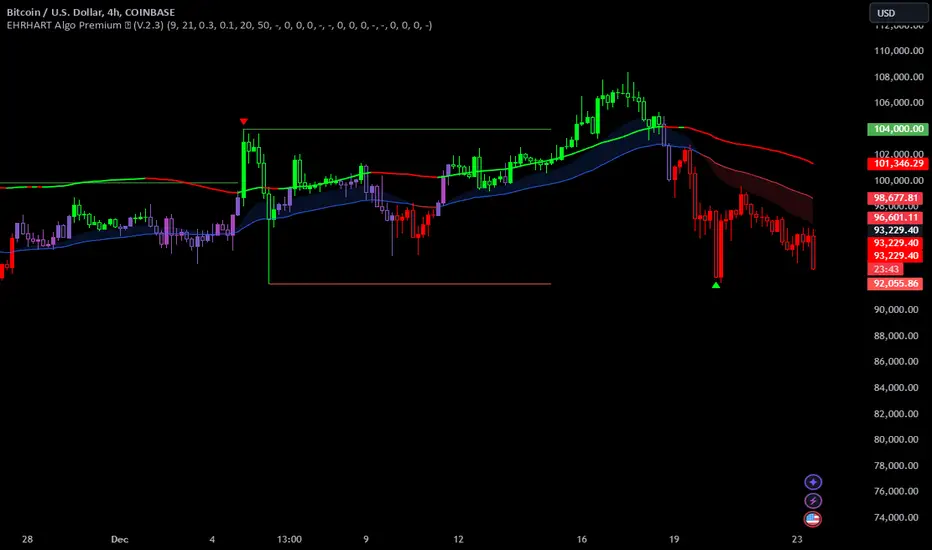
EHRHART Algo Premium (V.2)EHRHART Algo Premium is a indicator designed to help traders analyze market flow. It work with multiple EMA for identifying the sentiment of market. It's very simple calculation but it's a good help for people who use price action. I think the visual of the chart is very important and and I wanted to create an indicator very visual. I'm price action lover like lots of people and I personally think it's very important to identify the flow of market because buying when the flow of market is up give you better chance to win your trade. It's not BUY and SELL signal, this indicator don't tell u when u need buy or when u need sell, it's principally here for helping the visual of trading chart (have a good clear chart). I decided to post this indicator because people were asking me how it worked and were curious about these colors, so here we go !
This indicator show:
The main flow ( green candle=buy pressure /red candle=seller pressure ), it's based on two EMA cross over, this two EMA are editable so u can take the combination you want depending on your trading strategy. When the first EMA is above the second EMA candle becoming green and when the second EMA is above the first EMA candle becoming red.
The trend of two EMA crossover (blue=bullish and violet=bearish), it's based on two EMA (two different than main flow) cross over, this two EMA are editable so u can take the combination you want depending on your trading strategy. When the first EMA is above the second EMA the trend becoming blue and when the second EMA is above the first EMA the trend becoming violet.
Potential trend reversals (violet candle), it's calculate with the two EMA of the main flow, when these two EMA becoming closer, the candle becoming violet. It meaning that the trend may reversals. I added sensitivity parameter, so u can adjust it depending on your trading strategy, the more sensitive it is, the more candle will be colored violet.
A system of RSI print on the chart, when the RSI becoming overbought (more than 75) a red triangle will pop up on the chart, and when the RSI becoming oversold (less than 25) a green triangle will pop up on the chart. U can show or hidden these setting.
Bullish candles are represented by hollow candles.
Bearish candles are represented by full candles.
You can use this indicator with multiple strategy, I personally use it with price action (support/resistance) and I made it for that (but it's your choice).
This is an example of how I'll use it:
Here we can see that the price is coming testing our weakly support, however the main flow is bullish (red candle), so I'm waiting my first signal (violet candle). When the first candle passed violet I decided to enter the trade because violet candle after red candle means that the two EMA start closed to themselves meaning that's the flow may turn green. My second signal will be candle passed green, because it meaning the two EMA start deviate from themselves, buyer are taking advantage. In this situation a green triangle on the support will be my third signal.
Bitcoin Momentum StrategyThis is a very simple long-only strategy I've used since December 2022 to manage my Bitcoin position.
I'm sharing it as an open-source script for other traders to learn from the code and adapt it to their liking if they find the system concept interesting.
General Overview
Always do your own research and backtesting - this script is not intended to be traded blindly (no script should be) and I've done limited testing on other markets beyond Ethereum and BTC, it's just a template to tweak and play with and make into one's own.
The results shown in the strategy tester are from Bitcoin's inception so as to get a large sample size of trades, and potential returns have diminished significantly as BTC has grown to become a mega cap asset, but the script includes a date filter for backtesting and it has still performed solidly in recent years (speaking from personal experience using it myself - DYOR with the date filter).
The main advantage of this system in my opinion is in limiting the max drawdown significantly versus buy & hodl. Theoretically much better returns can be made by just holding, but that's also a good way to lose 70%+ of your capital in the inevitable bear markets (also speaking from experience).
In saying all of that, the future is fundamentally unknowable and past results in no way guarantee future performance.
System Concept:
Capture as much Bitcoin upside volatility as possible while side-stepping downside volatility as quickly as possible.
The system uses a simple but clever momentum-style trailing stop technique I learned from one of my trading mentors who uses this approach on momentum/trend-following stock market systems.
Basically, the system "ratchets" up the stop-loss to be much tighter during high bearish volatility to protect open profits from downside moves, but loosens the stop loss during sustained bullish momentum to let the position ride.
It is invested most of the time, unless BTC is trading below its 20-week EMA in which case it stays in cash/USDT to avoid holding through bear markets. It only trades one position (no pyramiding) and does not trade short, but can easily be tweaked to do whatever you like if you know what you're doing in Pine.
Default parameters:
HTF: Weekly Chart
EMA: 20-Period
ATR: 5-period
Bar Lookback: 7
Entry Rule #1:
Bitcoin's current price must be trading above its higher-timeframe EMA (Weekly 20 EMA).
Entry Rule #2:
Bitcoin must not be in 'caution' condition (no large bearish volatility swings recently).
Enter at next bar's open if conditions are met and we are not already involved in a trade.
"Caution" Condition:
Defined as true if BTC's recent 7-bar swing high minus current bar's low is > 1.5x ATR, or Daily close < Daily 20-EMA.
Trailing Stop:
Stop is trailed 1 ATR from recent swing high, or 20% of ATR if in caution condition (ie. 0.2 ATR).
Exit on next bar open upon a close below stop loss.
I typically use a limit order to open & exit trades as close to the open price as possible to reduce slippage, but the strategy script uses market orders.
I've never had any issues getting filled on limit orders close to the market price with BTC on the Daily timeframe, but if the exchange has relatively low slippage I've found market orders work fine too without much impact on the results particularly since BTC has consistently remained above $20k and highly liquid.
Cost of Trading:
The script uses no leverage and a default total round-trip commission of 0.3% which is what I pay on my exchange based on their tier structure, but this can vary widely from exchange to exchange and higher commission fees will have a significantly negative impact on realized gains so make sure to always input the correct theoretical commission cost when backtesting any script.
Static slippage is difficult to estimate in the strategy tester given the wide range of prices & liquidity BTC has experienced over the years and it largely depends on position size, I set it to 150 points per buy or sell as BTC is currently very liquid on the exchange I trade and I use limit orders where possible to enter/exit positions as close as possible to the market's open price as it significantly limits my slippage.
But again, this can vary a lot from exchange to exchange (for better or worse) and if BTC volatility is high at the time of execution this can have a negative impact on slippage and therefore real performance, so make sure to adjust it according to your exchange's tendencies.
Tax considerations should also be made based on short-term trade frequency if crypto profits are treated as a CGT event in your region.
Summary:
A simple, but effective and fairly robust system that achieves the goals I set for it.
From my preliminary testing it appears it may also work on altcoins but it might need a bit of tweaking/loosening with the trailing stop distance as the default parameters are designed to work with Bitcoin which obviously behaves very differently to smaller cap assets.
Good luck out there!

Trend Deviation strategy - BTC [IkkeOmar]Intro:
This is an example if anyone needs a push to get started with making strategies in pine script. This is an example on BTC, obviously it isn't a good strategy, and I wouldn't share my own good strategies because of alpha decay.
This strategy integrates several technical indicators to determine market trends and potential trade setups. These indicators include:
Directional Movement Index (DMI)
Bollinger Bands (BB)
Schaff Trend Cycle (STC)
Moving Average Convergence Divergence (MACD)
Momentum Indicator
Aroon Indicator
Supertrend Indicator
Relative Strength Index (RSI)
Exponential Moving Average (EMA)
Volume Weighted Average Price (VWAP)
It's crucial for you guys to understand the strengths and weaknesses of each indicator and identify synergies between them to improve the strategy's effectiveness.
Indicator Settings:
DMI (Directional Movement Index):
Length: This parameter determines the number of bars used in calculating the DMI. A higher length may provide smoother results but might lag behind the actual price action.
Bollinger Bands:
Length: This parameter specifies the number of bars used to calculate the moving average for the Bollinger Bands. A longer length results in a smoother average but might lag behind the price action.
Multiplier: The multiplier determines the width of the Bollinger Bands. It scales the standard deviation of the price data. A higher multiplier leads to wider bands, indicating increased volatility, while a lower multiplier results in narrower bands, suggesting decreased volatility.
Schaff Trend Cycle (STC):
Length: This parameter defines the length of the STC calculation. A longer length may result in smoother but slower-moving signals.
Fast Length: Specifies the length of the fast moving average component in the STC calculation.
Slow Length: Specifies the length of the slow moving average component in the STC calculation.
MACD (Moving Average Convergence Divergence):
Fast Length: Determines the number of bars used to calculate the fast EMA (Exponential Moving Average) in the MACD.
Slow Length: Specifies the number of bars used to calculate the slow EMA in the MACD.
Signal Length: Defines the number of bars used to calculate the signal line, which is typically an EMA of the MACD line.
Momentum Indicator:
Length: This parameter sets the number of bars over which momentum is calculated. A longer length may provide smoother momentum readings but might lag behind significant price changes.
Aroon Indicator:
Length: Specifies the number of bars over which the Aroon indicator calculates its values. A longer length may result in smoother Aroon readings but might lag behind significant market movements.
Supertrend Indicator:
Trendline Length: Determines the length of the period used in the Supertrend calculation. A longer length results in a smoother trendline but might lag behind recent price changes.
Trendline Factor: Specifies the multiplier used in calculating the trendline. It affects the sensitivity of the indicator to price changes.
RSI (Relative Strength Index):
Length: This parameter sets the number of bars over which RSI calculates its values. A longer length may result in smoother RSI readings but might lag behind significant price changes.
EMA (Exponential Moving Average):
Fast EMA: Specifies the number of bars used to calculate the fast EMA. A shorter period results in a more responsive EMA to recent price changes.
Slow EMA: Determines the number of bars used to calculate the slow EMA. A longer period results in a smoother EMA but might lag behind recent price changes.
VWAP (Volume Weighted Average Price):
Default settings are typically used for VWAP calculations, which consider the volume traded at each price level over a specific period. This indicator provides insights into the average price weighted by trading volume.
backtest range and rules:
You can specify the start date for backtesting purposes.
You can can select the desired trade direction: Long, Short, or Both.
Entry and Exit Conditions:
LONG:
DMI Cross Up: The Directional Movement Index (DMI) indicates a bullish trend when the positive directional movement (+DI) crosses above the negative directional movement (-DI).
Bollinger Bands (BB): The price is below the upper Bollinger Band, indicating a potential reversal from the upper band.
Momentum Indicator: Momentum is positive, suggesting increasing buying pressure.
MACD (Moving Average Convergence Divergence): The MACD line is above the signal line, indicating bullish momentum.
Supertrend Indicator: The Supertrend indicator signals an uptrend.
Schaff Trend Cycle (STC): The STC indicates a bullish trend.
Aroon Indicator: The Aroon indicator signals a bullish trend or crossover.
When all these conditions are met simultaneously, the strategy considers it a favorable opportunity to enter a long trade.
SHORT:
DMI Cross Down: The Directional Movement Index (DMI) indicates a bearish trend when the negative directional movement (-DI) crosses above the positive directional movement (+DI).
Bollinger Bands (BB): The price is above the lower Bollinger Band, suggesting a potential reversal from the lower band.
Momentum Indicator: Momentum is negative, indicating increasing selling pressure.
MACD (Moving Average Convergence Divergence): The MACD line is below the signal line, signaling bearish momentum.
Supertrend Indicator: The Supertrend indicator signals a downtrend.
Schaff Trend Cycle (STC): The STC indicates a bearish trend.
Aroon Indicator: The Aroon indicator signals a bearish trend or crossover.
When all these conditions align, the strategy considers it an opportune moment to enter a short trade.
Disclaimer:
THIS ISN'T AN OPTIMAL STRATEGY AT ALL! It was just an old project from when I started learning pine script!
The backtest doesn't promise the same results in the future, always do both in-sample and out-of-sample testing when backtesting a strategy. And make sure you forward test it as well before implementing it!
Furthermore this strategy uses both trend and mean-reversion systems, that is usually a no-go if you want to build robust trend systems .
Don't hesitate to comment if you have any questions or if you have some good notes for a beginner.

Price and Volume Stochastic Divergence [MW]Introduction
This indicator creates signals of interest for entering and exiting long and short positions on equities. It primarily uses up and down trends defined by the change in cumulative volume with some filtering provided by a short period exponential moving average (9 EMA by default).
Settings
Moving Average Period : The moving average over which the cumulative volume delta is calculated. Default: 14
Short Period EMA : The EMA used to represent price action, and is used to generate the EMA Delta line. Default: 27 (3*3*3)
Long Period EMA : The second EMA used to calculate the EMA Delta line. Default: 108 (2*2*3*3*3)
Stochastic K Value : The value used for stochastic curve smoothing. Default: 3
Dot Size : The diameter of the larger indicator. Default: 10
Dot Transparency : The transparency level of the outer ring of the primary BUY/SELL signal. Default: 50 (0 is opaque, 100 is transparent)
Band Distance from 0 to 100 : The upper and lower band distance. Default: 20
Calculations
The cumulative volume delta (CVD) is calculated using candle bodies and wicks. For a red candle, buying volume is calculated by multiplying the volume by the spread percentage of the average of the top and bottom wicks, while Selling Volume is calculated multiplying the volume by the spread percentage of the average of the top and bottom wicks - in addition to the spread percentage of the candle body.
For a green candle, buying volume is calculated by multiplying the volume by the spread percentage of the average of the top and bottom wicks - plus the spread percentage of the candle body - while Selling Volume is calculated using only the spread percentage average of the top and bottom wicks.
Once we have the CVD, we can then perform a stochastic calculation of the CVD value.
stochastic calculation = (current value - lowest value in period) / (highest value in period - lowest value in period)
We’ll do the same stochastic calculation for the short term EMA (27 EMA default) as well as for the difference between the short term and long term EMA.
When the stochastic CVD value is rising from zero and the short term EMA stochastic value equals 100, then it’s a major bullish signal. When the stochastic CVD value is falling from 100 and the short term EMA stochastic value equals 0, then it’s a major bearish signal.
Sometimes, after a bullish or bearish signal, the stochastic CVD will reverse direction triggering a new opposing signal.
How to Interpret
The CVD indicates when there is either more buying than selling or vice versa. A value over 50 for the stochastic CVD curve represents more buying taking place. A value below 50 represents more selling. One might intuitively believe that when there is more buying volume than selling volume that the price would follow suit. This is not always the case.
Most of the time buying volume will precede consistent price movement upwards, and selling volume will precede consistent price movement downwards. When this divergence occurs, the indicator generates a signal. When this divergence begins to fail, and buying or selling volume reverses, then another signal is generated indicating that the buying/selling impulse is headed back into the direction of price action.
These interactions are visually represented on the chart with the coral line that represents CVD, and the yellow line that represents the EMA, or the average price. When the coral line goes up and the yellow line stays down, that’s the BUY signal. When the coral line goes down and the yellow line stays up, that’s the sell signal. When the coral line switches direction, the chart generates another signal showing that volume is moving in a direction that supports the price.
The orange line represents the stochastic representation of the difference between the short EMA (27 by default) and the long EMA (108 by default). EMA differences is a method that can be used to define a trend. When a short term EMA is above a longer term EMA, that may represent a bullish trend. When it is below, that may represent a bearish trend. When all 3 lines are rising or falling in the same direction at the same time, it tends to indicate a movement that has the potential to continue.
Other Usage Notes and Limitations
It's important for traders to be aware of the limitations of any indicator and to use them as part of a broader, well-rounded trading strategy that includes risk management, fundamental analysis, and other tools that can help with reducing false signals, determining trend direction, and providing additional confirmation for a trade decision. Diversifying strategies and not relying solely on one type of indicator or analysis can help mitigate some of these risks.
This indicator can be paired with the MW Volume Impulse indicator if it is desired to see the actual buying and selling cumulative volume deltas. Also, in many cases, the BUY and SELL signals tend to correspond with Keltner Bands (ATR Bands) becoming extended. Lastly, volume weighted average price (VWAP) along with other macro events can impact price and negate signals. To view VWAP lines, you may choose to use the Multi VWAP or Multi VWAP for Gaps indicator to help ensure that the signals you see in this indicator are not being affected by VWAP lines.

Long EMA Strategy with Advanced Exit OptionsThis strategy is designed for traders seeking a trend-following system with a focus on precision and adaptability.
**Core Strategy Concept**
The essence of this strategy lies in use of Exponential Moving Averages (EMAs) to identify potential long (buy) positions based on the relative positions of short-term, medium-term, and long-term EMAs. The use of EMAs is a classic yet powerful approach to trend detection, as these indicators smooth out price data over time, emphasizing the direction of recent price movements and potentially signaling the beginning of new trends.
**Customizable Parameters**
- **EMA Periods**: Users can define the periods for three EMAs - long-term, medium-term, and short-term - allowing for a tailored approach to capture trends based on individual trading styles and market conditions.
- **Volatility Filter**: An optional Average True Range (ATR)-based volatility filter can be toggled on or off. When activated, it ensures that trades are only entered when market volatility exceeds a user-defined threshold, aiming to filter out entries during low-volatility periods which are often characterized by indecisive market movements.
- **Trailing Stop Loss**: A trailing stop loss mechanism, expressed as a percentage of the highest price achieved since entry, provides a dynamic way to manage risk by allowing profits to run while cutting losses.
- **EMA Exit Condition**: This advanced exit option enables closing positions when the short-term EMA crosses below the medium-term EMA, serving as a signal that the immediate trend may be reversing.
- **Close Below EMA Exit**: An additional exit condition, which is disabled by default, allows positions to be closed if the price closes below a user-selected EMA. This provides an extra layer of flexibility and risk management, catering to traders who prefer to exit positions based on specific EMA thresholds.
**Operational Mechanics**
Upon activation, the strategy evaluates the current price in relation to the set EMAs. A long position is considered when the current price is above the long-term EMA, and the short-term EMA is above the medium-term EMA. This setup aims to identify moments where the price momentum is strong and likely to continue.
The strategy's versatility is further enhanced by its optional settings:
- The **Volatility Filter** adjusts the sensitivity of the strategy to market movements, potentially improving the quality of the entries during volatile market conditions.
The Average True Range (ATR) is a key component of this filter, providing a measure of market volatility by calculating the average range between the high and low prices over a specified number of periods. Here's how you can adjust the volatility filter settings for various market conditions, focusing on filtering out low-volatility markets:
Setting Examples for Volatility Filter
1. High Volatility Markets (e.g., Cryptocurrencies, Certain Forex Pairs):
ATR Periods: 14 (default)
ATR Multiplier: Setting the multiplier to a lower value, such as 1.0 or 1.2, can be beneficial in high-volatility markets. This sensitivity allows the strategy to react to volatility changes more quickly, ensuring that you're entering trades during periods of significant movement.
2. Medium Volatility Markets (e.g., Major Equity Indices, Medium-Volatility Forex Pairs):
ATR Periods: 14 (default)
ATR Multiplier: A multiplier of 1.5 (default) is often suitable for medium volatility markets. It provides a balanced approach, ensuring that the strategy filters out low-volatility conditions without being overly restrictive.
3. Low Volatility Markets (e.g., Some Commodities, Low-Volatility Forex Pairs):
ATR Periods: Increasing the ATR period to 20 or 25 can smooth out the volatility measure, making it less sensitive to short-term fluctuations. This adjustment helps in focusing on more significant trends in inherently stable markets.
ATR Multiplier: Raising the multiplier to 2.0 or even 2.5 increases the threshold for volatility, effectively filtering out low-volatility conditions. This setting ensures that the strategy only triggers trades during periods of relatively higher volatility, which are more likely to result in significant price movements.
How to Use the Volatility Filter for Low-Volatility Markets
For traders specifically interested in filtering out low-volatility markets, the key is to adjust the ATR Multiplier to a higher level. This adjustment increases the threshold required for the market to be considered sufficiently volatile for trade entries. Here's a step-by-step guide:
Adjust the ATR Multiplier: Increase the ATR Multiplier to create a higher volatility threshold. A multiplier of 2.0 to 2.5 is a good starting point for very low-volatility markets.
Fine-Tune the ATR Periods: Consider lengthening the ATR calculation period if you find that the strategy is still entering trades in undesirable low-volatility conditions. A longer period provides a more averaged-out measure of volatility, which might better suit your needs.
Monitor and Adjust: Volatility is not static, and market conditions can change. Regularly review the performance of your strategy in the context of current market volatility and adjust the settings as necessary.
Backtest in Different Conditions: Before applying the strategy live, backtest it across different market conditions with your adjusted settings. This process helps ensure that your approach to filtering low-volatility conditions aligns with your trading objectives and risk tolerance.
By fine-tuning the volatility filter settings according to the specific characteristics of the market you're trading in, you can enhance the performance of this strategy
- The **Trailing Stop Loss** and **EMA Exit Conditions** provide two layers of exit strategies, focusing on capital preservation and profit maximization.
**Visualizations**
For clarity and ease of use, the strategy plots the three EMAs and, if enabled, the ATR threshold on the chart. These visual cues not only aid in decision-making but also help in understanding the market's current trend and volatility state.
**How to Use**
Traders can customize the EMA periods to fit their trading horizon, be it short, medium, or long-term trading. The volatility filter and exit options allow for further customization, making the strategy adaptable to different market conditions and personal risk tolerance levels.
By offering a blend of trend-following principles with advanced risk management features, this strategy aims to cater to a wide range of trading styles, from cautious to aggressive. Its strength lies in its flexibility, allowing traders to fine-tune settings to their specific needs, making it a potentially valuable tool in the arsenal of any trader looking for a disciplined approach to navigating the markets.

VWAP 8EMA Crossover Scalping IndicatorWhy?
Everybody, especially in Indian context, from 9:15 AM to 3:30 PM, wants to trade in BankNifty.
And even 15m is Too Big timeframe for The Great Indian Options buyers. Everyone knows how potentially BankNifty (& FinNifty on Tuesday and Sensex on Friday) can show dance within 15m.
So there always been an overarching longing among traders to have something in shorter timeframes. And this 5m timeframe, looks like a universally (sic) accepted Standard Timeframe for Indian Options traders.
So here is this.
What?
The time we are publishing this public indicator Indian market (Nifty) is in ATH at ~22200.
In any such super trending market it's always good to wait for a dip and then in suitable time, enter the trade in the direction of the larger trend. The reversal trading systems, in such a situation, proves to be ineffective.
Of course there are time when market is sideways and keeps on oscillating between +/2 standard deviation of the 20 SMA. In such a situation the reversal play works perfectly. But not so in such a trending market.
So the question comes up - after a dip what's the right point to enter.
Hence comes the importance of such a crossover based trading system.
In this indicator, it's a well-known technique (nothing originally from ours, it's taken from social media, exact one we forgot) to find out the 8EMA and VWAP crossover.
So we learned from social media, practice in our daily trading a bit, actuate it and now publishing it.
A few salient points
It does not make sense to jump into the trade just on the crossover (or crossunder).
So we added some more sugar to it, e.g. we check the color the candle. Also the next candle if crosses and closes above (or below) the breakout candle's high/low.
The polarity (color) of both the alert (breakout/breakdown) and confirmation candle to be same (green for crossover, red from crossunder).
Of course, it does provider BUY and SELL alerts separately.
These all we have found out doing backtesting and forward testing with 1/2 lots and saw this sort of approaches works.
Hence all of these are added to this script.
Nomenclature
Here green line is the 8EMA and the red line is the VWAP.
Also there is a black dotted line. That's 50 EMA. It's to show you the trend.
The recent trade is shown in the top right of the chart as green (for buy) or red (for sell) with SL and 1:1 target.
How to trade using this system?
This is roughly we have found the best possible use of this indicator.
Lets explain with a bullish BUY positive crossover (means 8EMA is crossing over the daily VWAP)
Keep timeframe as 5m
Check the direction/slope of the black dotted line (50 EMA). If it's upwards, only take bullish positions.
Open the chart which has the VWAP. (e.g. FinNifty spot or MidcapNifty spot does not have vwap). So in those cases Future is the way to go.
Wait for a breakout crossover and let the indicator gives a green, triangular UP arrow.
Draw a horizontal line to the close of that candle for next few (say 6 candles i.e. 30m) candles.
Wait for the price first to retest the 8EMA or even better the VWAP (or near to the 8EMA, VWAP)
Let the price moves and closes above the horizontal line drawn in the 4th step.
Take a bullish trade, keeping VWAP as the SL and 1:1 as the target.
Additionally, Options buyer can consult ADX also to see if the ADX is more than 25 and moving up for the bullish trade. (This has to be added seperately in the chart, it's not a part of the indicator).
Mention
The concept we have taken from some social media. Forget exactly where we heard this first time. We just coded it with some additional steps.
Statutory Disclaimer
There is no silver bullet / holy grail in trading. Nothing works 100% time. One has to be careful about the loss (s)he can bear in case of the trade goes against.
We, as the author of this script, is not responsible for any trading or position decision one is taken based on the outcome of this.
It is our sole discretion to change, add, delete the portion or withdraw the whole script without any prior notice or intimation.
In Indian Context: We are not SEBI registered.
