EMA Grid + Martingale Strategy (Long-Only) with CooldownTitle:
EMA Grid + Martingale Strategy (Long-Only) with Cooldown
Short Summary:
A long-only strategy combining EMA trend filters, grid-based entries, optional martingale sizing, and a cooldown feature to manage position timing and exits.
Full Description:
This strategy uses a 4-EMA trend confirmation system to detect bullish momentum, then deploys a grid-style entry method with optional martingale position sizing. It includes a cooldown mechanism to prevent reentry too soon after a completed trade cycle.
How It Works
1. Trend Confirmation: Two EMA groups (fast/slow) determine whether market conditions are bullish.
2. Initial Entry: A new position is entered when both EMA groups confirm an uptrend and no position is currently active.
3. Grid Entries: Additional long entries are placed when price drops by a defined pip distance from the last entry, respecting the maximum number of entries.
4. Martingale Sizing (Optional): Grid orders can increase in size with each level using a customizable multiplier.
5. Weighted-Average Exit: All positions close once price reaches or exceeds the average entry price plus a buffer.
6. Cooldown Timer: After closing a position set, the strategy waits a defined number of bars before opening a new grid.
Key Features
• 4 customizable EMAs for trend confirmation.
• Dynamic grid-style long entries based on pip intervals.
• Optional martingale-style position sizing.
• Weighted-average price exit logic with buffer control.
• Cooldown bar period to limit overtrading.
• Suitable for optimization and backtesting with full control over inputs.
Use Cases
• Designed for trending markets where pullbacks present entry opportunities.
• Helps manage staged entries while avoiding premature reentry.
• Ideal for testing martingale and grid-based strategies with exit precision.
Note: This strategy is for testing and educational purposes only. It does not guarantee profits and is not financial advice.
Exponential Moving Average (EMA)

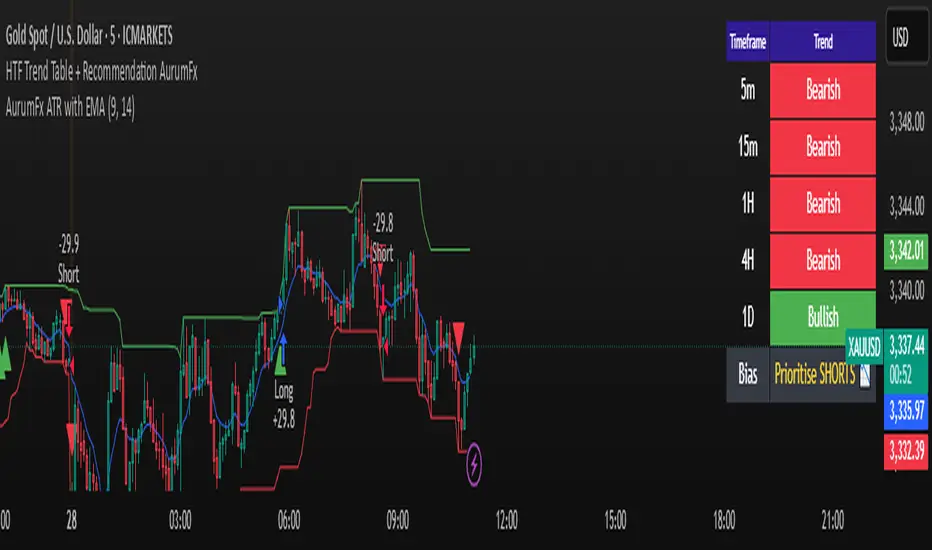
AurumFx ATR with EMAThis strategy combines the strength of breakout momentum with trend confirmation for precision entries. It uses a 9-period EMA to define short-term trend bias, while identifying key breakout points using 20-bar highs and lows. Long trades trigger on bullish breakouts above the previous high when price is above the EMA, while shorts trigger on bearish breakdowns below the prior low when price is below the EMA. Designed for traders seeking a simple yet effective trend-following system with clear visual signals and dynamic market adaptation.
Refined MA + Engulfing (M5 + Confirmed Structure Break)I would like to start by saying that this strategy was put together using ChatGPT, some past trades from myself and some backtested trades, and from my time as a student in Wallstreet Academy under Cue Banks.
I am not profitable yet. I am too jumpy and blow accounts. I'm hoping this strategy (and it's indicator twin) can help me spend less time on the charts, so that I'm not tempted to press buttons as much.
It does fire quite a bit. But, the Strategy Tester tab shows a 30% win rate with our wins being significant to our losses. So, in theory, if you followed the rules of this strategy STRICTLY, you COULD BE profitable.
With that being said, there are times that this strategy has shown to trigger and I ask, "Why?".
I just want to help myself and others, and maybe make some decent\cool stuff along the way. Enjoy
KR

EMA and Dow Theory Strategies🌐 Strategy Description
📘 Overview
This is a hybrid strategy that combines EMA crossovers, Dow Theory swing logic, and multi-timeframe trend overlays. It is suitable for intraday to short-term trading on any asset class: crypto, forex, stocks, and indices.
The strategy provides precise entry/exit signals, dynamic stop-loss and scale-out, and highly visual trade guidance.
🧠 Key Features
・Dual EMA crossover system (applied to both symbol and external index)
・Dow Theory-based swing high/low detection for trend confirmation
・Visual overlay of higher timeframe swing trend (htfTrend)
・RSI filter to avoid overbought/oversold entries
・Dynamic partial take-profit when trend weakens
・Custom stop-loss (%) control
・Visualized trade PnL labels directly on chart
・Alerts for entry, stop-loss, partial exit
・Gradient background zones for swing zones and trend visualization
・Auto-tracked metrics: APR, drawdown, win rate, equity curve
⚙️ Input Parameters
| Parameter | Description |
| ------------------------- | -------------------------------------------------------- |
| Fast EMA / Slow EMA | Periods for detecting local trend via EMAs |
| Index Fast EMA / Slow EMA | EMAs applied to external reference index |
| StopLoss | Maximum loss threshold in % |
| ScaleOut Threshold | Scale-out percentage when trend changes color |
| RSI Period / Levels | RSI period and overbought/oversold levels |
| Swing Detection Length | Number of bars used to detect swing highs/lows |
| Stats Display Options | Toggle PnL labels and position of statistics table |
🧭 About htfTrend (Higher Timeframe Trend)
The script includes a higher timeframe trend (htfTrend) calculated using Dow Theory (pivot highs/lows).
This trend is only used for visual guidance, not for actual entry conditions.
Why? Strictly filtering trades by higher timeframe often leads to missed opportunities and low frequency.
By keeping htfTrend visual-only, traders can still refer to macro structure but retain trade flexibility.
Use it as a contextual tool, not a constraint.
ストラテジー説明
📘 概要
本ストラテジーは、EMAクロスオーバー、ダウ理論によるスイング判定、**上位足トレンドの視覚表示(htfTrend)**を組み合わせた複合型の短期トレーディング戦略です。
仮想通貨・FX・株式・指数など幅広いアセットに対応し、デイトレード〜スキャルピング用途に適しています。
動的な利確/損切り、視覚的にわかりやすいエントリー/イグジット、統計表示を搭載しています。
🧠 主な機能
・対象銘柄+外部インデックスのEMAクロスによるトレンド判定
・ダウ理論に基づいたスイング高値・安値検出とトレンド判断
・上位足スイングトレンド(htfTrend)の視覚表示
・RSIフィルターによる過熱・売られすぎの回避
・トレンドの弱まりに応じた部分利確(スケールアウト)
・**損切り閾値(%)**をカスタマイズ可能
・チャート上に損益ラベル表示
・アラート完備(エントリー・決済・部分利確)
・トレンドゾーンを可視化する背景グラデーション
・勝率・ドローダウン・APR・資産増加率などの自動表示
| 設定項目名 | 説明内容 |
| --------------------- | -------------------------- |
| Fast EMA / Slow EMA | 銘柄に対して使用するEMAの期間設定 |
| Index Fast / Slow EMA | 外部インデックスのEMA設定 |
| 損切り(StopLoss) | 損切りラインのしきい値(%で指定) |
| 部分利確しきい値 | トレンド弱化時にスケールアウトする割合(%) |
| RSI期間・水準 | RSI計算期間と、過熱・売られすぎレベル設定 |
| スイング検出期間 | スイング高値・安値の検出に使用するバー数 |
| 統計表示の切り替え | 損益ラベルや統計テーブルの表示/非表示選択 |
🧭 上位足トレンド(htfTrend)について
本スクリプトには、上位足でのスイング高値・安値の更新に基づく**htfTrend(トレンド判定)が含まれています。
これは視覚的な参考情報であり、エントリーやイグジットには直接使用されていません。**
その理由は、上位足を厳密にロジックに組み込むと、トレード機会の損失が増えるためです。
このスクリプトでは、**判断の補助材料として「表示のみに留める」**設計を採用しています。
→ 裁量で「利確を早める」「逆張りを避ける」判断に活用可能です。

LANZ Strategy 5.0 [Backtest]🔷 LANZ Strategy 5.0 — Rule-Based BUY Logic with Time Filter, Session Limits and Auto SL/TP Execution
This is the backtest version of LANZ Strategy 5.0, built as a strategy script to evaluate real performance under fixed intraday conditions. It automatically places BUY and SELL trades based on structured candle confirmation, EMA trend alignment, and session-based filters. The system simulates real-time execution with precise Stop Loss and Take Profit levels.
📌 Built for traders seeking to simulate clean intraday logic with fully automated entries and performance metrics.
🧠 Core Logic & Strategy Conditions
✅ BUY Signal Conditions:
Price is above the EMA200
The last 3 candles are bullish (close > open)
The signal occurs within the defined session window (NY time)
Daily trade limit has not been exceeded
If all are true, a BUY order is executed at market, with SL and TP set immediately.
🔻 SELL Signal Conditions (Optional):
Exactly inverse to BUY (below EMA + 3 bearish candles). Disabled by default.
🕐 Operational Time Filter (New York Time)
You can fully customize your intraday window:
Start Time: e.g., 01:15 NY
End Time: e.g., 16:00 NY
The system evaluates signals only within this range, even across midnight if configured.
🔁 Trade Management System
One trade at a time per signal
Trades include a Stop Loss (SL) and Take Profit (TP) based on pip distance
Trade result is calculated automatically
Each signal is shown with a triangle marker (BUY only, by default)
🧪 Backtest Accuracy
This version uses:
strategy.order() for entries
strategy.exit() for SL and TP
strategy.close_all() at the configured manual closing time
This ensures realistic behavior in the TradingView strategy tester.
⚙️ Flow Summary (Step-by-Step)
On every bar, check:
Is the time within the operational session?
Is the price above the EMA?
Are the last 3 candles bullish?
If conditions met → A BUY trade is opened:
SL = entry – X pips
TP = entry + Y pips
Trade closes:
If SL or TP is hit
Or at the configured manual close time (e.g., 16:00 NY)
📊 Settings Overview
Timeframe: 1-hour (ideal)
SL/TP: Configurable in pips
Max trades/day: User-defined (default = 99 = unlimited)
Manual close: Adjustable by time
Entry type: Market (not limit)
Visuals: Plotshape triangle for BUY entry
👨💻 Credits:
💡 Developed by: LANZ
🧠 Strategy logic & execution: LANZ
✅ Designed for: Clean backtesting, clarity in execution, and intraday logic simulation

5 EMA STRATEGY by Power of Stocks(StockYogi)5 EMA STRATEGY by Power of Stocks(StockYogi)
This is a 5 EMA Breakout Strategy inspired by the trading principles taught by Shubhashi Pani, founder of the Power of Stocks (POS) community.
The strategy is designed to:
• Detect breakout setups when price breaks the high/low of a signal candle (based on EMA conditions)
• Enter trades only if the breakout occurs within the next 3 candles
• Allow multiple trades in the same direction without closing the earlier one
• Use independent stop-loss (SL) and take-profit (TP) targets for each trade based on a user-defined risk-reward ratio
• Optionally enter trades only at candle close
• Optionally avoid trades during a custom time window (e.g., 3:00 PM to 3:30 PM IST)
• Optionally close all open positions at a defined time (e.g., 3:30 PM IST)
The goal of this strategy is to provide greater flexibility and realism for intraday or short-term traders following structured breakout systems.
Disclaimer: This script is an implementation of technical ideas for educational purposes only. It is not financial advice. All trading involves risk, and past performance does not guarantee future results.
Strategy Credits:
This strategy is based on publicly known breakout rules taught by Shubhashi Pani (Power of Stocks). This is not an official POS script, and I am not affiliated with the Power of Stocks team. This implementation was developed independently to follow the logic shared for educational use.
Feel free to use, backtest, and modify according to your needs. Constructive feedback is welcome!

Options Strategy V1.3📈 Options Strategy V1.3 — EMA Crossover + RSI + ATR + Opening Range
Overview:
This strategy is designed for short-term directional trades on large-cap stocks or ETFs, especially when trading options. It combines classic trend-following signals with momentum confirmation, volatility-based risk management, and session timing filters to help identify high-probability entries with predefined stop-loss and profit targets.
🔍 Strategy Components:
EMA Crossover (Fast/Slow)
Entry signals are triggered by the crossover of a short EMA above or below a long EMA — a traditional trend-following method to detect shifts in momentum.
RSI Filter
RSI confirms the signal by avoiding entries in overbought/oversold zones unless certain momentum conditions are met.
Long entry requires RSI ≥ Long Threshold
Short entry requires RSI ≤ Short Threshold
ATR-Based SL & TP
Stop-loss is set dynamically as a multiple of ATR below (long) or above (short) the entry price.
Take-profit is placed as a ratio (TP/SL) of the stop distance, ensuring consistent reward/risk structure.
Opening Range Filter (Optional)
If enabled, the strategy only triggers trades after price breaks out of the 09:30–09:45 EST range, ensuring participation in directional moves.
Session Filters
No trades from 04:00 to 09:30 and from 16:00 to 20:00 EST, avoiding low-liquidity periods.
All open trades are closed at 15:55 EST, to avoid overnight risk or expiration issues for options.
⚙️ Built-in Presets:
You can choose one of the built-in ticker-specific presets for optimal conditions:
Ticker EMAs RSI (Long/Short) ATR SL×ATR TP/SL
SPY 8/28 56 / 26 14 1.4× 4.0×
TSLA 23/27 56 / 33 13 1.4× 3.6×
AAPL 6/13 61 / 26 23 1.4× 2.1×
MSFT 25/32 54 / 26 14 1.2× 2.2×
META 25/32 53 / 26 17 1.8× 2.3×
AMZN 28/32 55 / 25 16 1.8× 2.3×
You can also choose "Custom" to fully configure all parameters to your own market and strategy preferences.
📌 Best Use Case:
This strategy is especially suited for intraday options trading, where timing and risk control are critical. It works best on liquid tickers with strong trends or clear breakout behavior.

AutoFib Breakout Strategy for Uptrend AssetsThis trading strategy is designed to help you catch powerful upward moves on assets that are in a long-term uptrend, such as Gold (XAUUSD). It uses a popular technical tool called the Fibonacci Extension, combined with a trend filter and a risk-managed exit system.
✅ When to Use This Strategy
• Works best on higher timeframes: Daily (1D), 3-Day (3D), or Weekly (W).
• Best used on uptrending assets like Gold.
• Designed for swing trading – holding trades from a few days to weeks.
📊 How It Works
1. Find the Trend
We only want to trade in the direction of the trend.
• The strategy uses the 200-period EMA (Exponential Moving Average) to identify if the market is in an uptrend.
• If the price is above the 200 EMA, we consider it an uptrend and allow long trades.
2. Identify Breakout Levels
• The strategy detects recent high and low pivot points to draw Fibonacci extension levels.
• It focuses on the 1.618 Fibonacci level, which is often a target in strong trends.
• When the price breaks above this level in an uptrend, it signals a potential momentum breakout – a good time to buy.
3. Enter a Trade
• The strategy enters a long (buy) position when the price closes above the 1.618 Fibonacci level and the market is in an uptrend (above the 200 EMA).
4. Manage Risk Automatically
• The trade includes a stop-loss set to 1x the ATR (Average True Range) below the entry price – this protects against sudden drops.
• It sets a take-profit at 3x the ATR above the entry – aiming for higher rewards than risks.
⚠️ Important Notes
• 📈 Higher Timeframes Preferred: This strategy works best on Daily (D), 3-Day (3D), and Weekly (W) charts, especially on Gold (XAUUSD).
• 🧪 Not for Deep Backtesting: Due to the nature of how pivot points and Fib levels are calculated, this strategy may not perform well in backtesting simulations (because the historical calculations can shift). It is better used for live analysis and forward testing.

Momentum Long + Short Strategy (BTC 3H)Momentum Long + Short Strategy (BTC 3H)
🔍 How It Works, Step by Step
Detect the Trend (📈/📉)
Calculate two moving averages (100-period and 500-period), either EMA or SMA.
For longs, we require MA100 > MA500 (uptrend).
For shorts, we block entries if MA100 exceeds MA500 by more than a set percentage (to avoid fading a powerful uptrend).
Apply Momentum Filters (⚡️)
RSI Filter: Measures recent strength—only allow longs when RSI crosses above its smoothed average, and shorts when RSI dips below the oversold threshold.
ADX Filter: Gauges trend strength—ensures we only enter when a meaningful trend exists (optional).
ATR Filter: Confirms volatility—avoids choppy, low-volatility conditions by requiring ATR to exceed its smoothed value (optional).
Confirm Entry Conditions (✅)
Long Entry:
Price is above both MAs
Trend alignment & optional filters pass ✅
Short Entry:
Price is below both MAs and below the lower Bollinger Band
RSI is sufficiently oversold
Trend-blocker & ATR filter pass ✅
Position Sizing & Risk (💰)
Each trade uses 100 % of account equity by default.
One pyramid addition allowed, so you can scale in if the move continues.
Commission and slippage assumptions built in for realistic backtests.
Stops & Exits (🛑)
Long Stop-Loss: e.g. 3 % below entry.
Long Auto-Exit: If price falls back under the 500-period MA.
Short Stop-Loss: e.g. 3 % above entry.
Short Take-Profit: e.g. 4 % below entry.
🎨 Why It’s Powerful & Customizable
Modular Filters: Turn on/off RSI, ADX, ATR filters to suit different market regimes.
Adjustable Thresholds: Fine-tune stop-loss %, take-profit %, RSI lengths, MA gaps and more.
Multi-Timeframe Potential: Although coded for 3 h BTC, you can adapt it to stocks, forex or other cryptos—just recalibrate!
Backtest Fine-Tuned: Default settings were optimized via backtesting on historical BTC data—but they’re not guarantees of future performance.
⚠️ Warning & Disclaimer
This strategy is for educational purposes only and designed for a toy fund. Crypto markets are highly volatile—you can lose 100 % of your capital. It is not a predictive “holy grail” but a rules-based framework using past data. The parameters have been fine-tuned on historical data and are not valid for future trades without fresh calibration. Always practice with paper-trading first, use proper risk management, and do your own research before risking real money. 🚨🔒
Good luck exploring and experimenting! 🚀📊

EMA Pullback Speed Strategy 📌 **Overview**
The **EMA Pullback Speed Strategy** is a trend-following approach that combines **price momentum** and **Exponential Moving Averages (EMA)**.
It aims to identify high-probability entry points during brief pullbacks within ongoing uptrends or downtrends.
The strategy evaluates **speed of price movement**, **relative position to dynamic EMA**, and **candlestick patterns** to determine ideal timing for entries.
One of the key concepts is checking whether the price has **“not pulled back too much”**, helping focus only on situations where the trend is likely to continue.
⚠️ This strategy is designed for educational and research purposes only. It does not guarantee future profits.
🧭 **Purpose**
This strategy addresses the common issue of **"jumping in too late during trends and taking unnecessary losses."**
By waiting for a healthy pullback and confirming signs of **trend resumption**, traders can enter with greater confidence and reduce false entries.
🎯 **Strategy Objectives**
* Enter in the direction of the prevailing trend to increase win rate
* Filter out false signals using pullback depth, speed, and candlestick confirmations
* Predefine Take-Profit (TP) and Stop-Loss (SL) levels for safer, rule-based trading
✨ **Key Features**
* **Dynamic EMA**: Reacts faster when price moves quickly, slower when market is calm – adapting to current momentum
* **Pullback Filter**: Avoids trades when price pulls back too far (e.g., more than 5%), indicating a trend may be weakening
* **Speed Check**: Measures how strongly the price returns to the trend using candlestick body speed (open-to-close range in ticks)
📊 **Trading Rules**
**■ Long Entry Conditions:**
* Current price is above the dynamic EMA (indicating uptrend)
* Price has pulled back toward the EMA (a "buy the dip" situation)
* Pullback depth is within the threshold (not excessive)
* Candlesticks show consecutive bullish closes and break the previous high
* Price speed is strong (positive movement with momentum)
**■ Short Entry Conditions:**
* Current price is below the dynamic EMA (indicating downtrend)
* Price has pulled back up toward the EMA (a "sell the rally" setup)
* Pullback is within range (not too deep)
* Candlesticks show consecutive bearish closes and break the previous low
* Price speed is negative (downward momentum confirmed)
**■ Exit Conditions (TP/SL):**
* **Take-Profit (TP):** Fixed 1.5% target above/below entry price
* **Stop-Loss (SL):** Based on recent price volatility, calculated using ATR × 4
💰 **Risk Management Parameters**
* Symbol & Timeframe: BTCUSD on 1-hour chart (H1)
* Test Capital: \$3000 (simulated account)
* Commission: 0.02%
* Slippage: 2 ticks (minimal execution lag)
* Max risk per trade: 5% of account balance
* Backtest Period: Aug 30, 2023 – May 9, 2025
* Profit Factor (PF): 1.965 (Net profit ÷ Net loss, including spreads & fees)
⚙️ **Trading Parameters & Indicator Settings**
* Maximum EMA Length: 50
* Accelerator Multiplier: 3.0
* Pullback Threshold: 5.0%
* ATR Period: 14
* ATR Multiplier (SL distance): 4.0
* Fixed TP: 1.5%
* Short-term EMA: 21
* Long-term EMA: 50
* Long Speed Threshold: ≥ 1000.0 (ticks)
* Short Speed Threshold: ≤ -1000.0 (ticks)
⚠️Adjustments are based on BTCUSD.
⚠️Forex and other currency pairs require separate adjustments.
🔧 **Strategy Improvements & Uniqueness**
Unlike basic moving average crossovers or RSI triggers, this strategy emphasizes **"momentum-supported pullbacks"**.
By combining dynamic EMA, speed checks, and candlestick signals, it captures trades **as if surfing the wave of a trend.**
Its built-in filters help **avoid overextended pullbacks**, which often signal the trend is ending – making it more robust than traditional trend-following systems.
✅ **Summary**
The **EMA Pullback Speed Strategy** is easy to understand, rule-based, and highly reproducible – ideal for both beginners and intermediate traders.
Because it shows **clear visual entry/exit points** on the chart, it’s also a great tool for practicing discretionary trading decisions.
⚠️ Past performance is not a guarantee of future results.
Always respect your Stop-Loss levels and manage your position size according to your risk tolerance.

EMA 12/26 With ATR Volatility StoplossThe EMA 12/26 With ATR Volatility Stoploss
The EMA 12/26 With ATR Volatility Stoploss strategy is a meticulously designed systematic trading approach tailored for navigating financial markets through technical analysis. By integrating the Exponential Moving Average (EMA) and Average True Range (ATR) indicators, the strategy aims to identify optimal entry and exit points for trades while prioritizing disciplined risk management. At its core, it is a trend-following system that seeks to capitalize on price momentum, employing volatility-adjusted stop-loss mechanisms and dynamic position sizing to align with predefined risk parameters. Additionally, it offers traders the flexibility to manage profits either by compounding returns or preserving initial capital, making it adaptable to diverse trading philosophies. This essay provides a comprehensive exploration of the strategy’s underlying concepts, key components, strengths, limitations, and practical applications, without delving into its technical code.
=====
Core Philosophy and Objectives
The EMA 12/26 With ATR Volatility Stoploss strategy is built on the premise of capturing short- to medium-term price trends with a high degree of automation and consistency. It leverages the crossover of two EMAs—a fast EMA (12-period) and a slow EMA (26-period)—to generate buy and sell signals, which indicate potential trend reversals or continuations. To mitigate the inherent risks of trading, the strategy incorporates the ATR indicator to set stop-loss levels that adapt to market volatility, ensuring that losses remain within acceptable bounds. Furthermore, it calculates position sizes based on a user-defined risk percentage, safeguarding capital while optimizing trade exposure.
A distinctive feature of the strategy is its dual profit management modes:
SnowBall (Compound Profit): Profits from successful trades are reinvested into the capital base, allowing for progressively larger position sizes and potential exponential portfolio growth.
ZeroRisk (Fixed Equity): Profits are withdrawn, and trades are executed using only the initial capital, prioritizing capital preservation and minimizing exposure to market downturns.
This duality caters to both aggressive traders seeking growth and conservative traders focused on stability, positioning the strategy as a versatile tool for various market environments.
=====
Key Components of the Strategy
1. EMA-Based Signal Generation
The strategy’s trend-following mechanism hinges on the interaction between the Fast EMA (12-period) and Slow EMA (26-period). EMAs are preferred over simple moving averages because they assign greater weight to recent price data, enabling quicker responses to market shifts. The key signals are:
Buy Signal: Triggered when the Fast EMA crosses above the Slow EMA, suggesting the onset of an uptrend or bullish momentum.
Sell Signal: Occurs when the Fast EMA crosses below the Slow EMA, indicating a potential downtrend or the end of a bullish phase.
To enhance signal reliability, the strategy employs an Anchor Point EMA (AP EMA), a short-period EMA (e.g., 2 days) that smooths the input price data before calculating the primary EMAs. This preprocessing reduces noise from short-term price fluctuations, improving the accuracy of trend detection. Additionally, users can opt for a Consolidated EMA (e.g., 18-period) to display a single trend line instead of both EMAs, simplifying chart analysis while retaining trend insights.
=====
2. Volatility-Adjusted Risk Management with ATR
Risk management is a cornerstone of the strategy, achieved through the use of the Average True Range (ATR), which quantifies market volatility by measuring the average price range over a specified period (e.g., 10 days). The ATR informs the placement of stop-loss levels, which are set at a multiple of the ATR (e.g., 2x ATR) below the entry price for long positions. This approach ensures that stop losses are proportionate to current market conditions—wider during high volatility to avoid premature exits, and narrower during low volatility to protect profits.
For example, if a stock’s ATR is $1 and the multiplier is 2, the stop loss for a buy at $100 would be set at $98. This dynamic adjustment enhances the strategy’s adaptability, preventing stop-outs from normal market noise while capping potential losses.
=====
3. Dynamic Position Sizing
The strategy calculates position sizes to align with a user-defined Risk Per Trade, typically expressed as a percentage of capital (e.g., 2%). The position size is determined by:
The available capital, which varies depending on whether SnowBall or ZeroRisk mode is selected.
The distance between the entry price and the ATR-based stop-loss level, which represents the per-unit risk.
The desired risk percentage, ensuring that the maximum loss per trade does not exceed the specified threshold.
For instance, with a $1,000 capital, a 2% risk per trade ($20), and a stop-loss distance equivalent to 5% of the entry price, the strategy computes the number of units (shares or contracts) to ensure the total loss, if the stop loss is hit, equals $20. To prevent over-leveraging, the strategy includes checks to ensure that the position’s dollar value does not exceed available capital. If it does, the position size is scaled down to fit within the capital constraints, maintaining financial discipline.
=====
4. Flexible Capital Management
The strategy’s dual profit management modes—SnowBall and ZeroRisk—offer traders strategic flexibility:
SnowBall Mode: By compounding profits, traders can increase their capital base, leading to larger position sizes over time. This is ideal for those with a long-term growth mindset, as it harnesses the power of exponential returns.
ZeroRisk Mode: By withdrawing profits and trading solely with the initial capital, traders protect their gains and limit exposure to market volatility. This conservative approach suits those prioritizing stability over aggressive growth.
These options allow traders to tailor the strategy to their risk tolerance, financial goals, and market outlook, enhancing its applicability across different trading styles.
=====
5. Time-Based Trade Filtering
To optimize performance and relevance, the strategy includes an option to restrict trading to a specific time range (e.g., from 2018 onward). This feature enables traders to focus on periods with favorable market conditions, avoid historically volatile or unreliable data, or align the strategy with their backtesting objectives. By confining trades to a defined timeframe, the strategy ensures that performance metrics reflect the intended market context.
=====
Strengths of the Strategy
The EMA 12/26 With ATR Volatility Stoploss strategy offers several compelling advantages:
Systematic and Objective: By adhering to predefined rules, the strategy eliminates emotional biases, ensuring consistent execution across market conditions.
Robust Risk Controls: The combination of ATR-based stop losses and risk-based position sizing caps losses at user-defined levels, fostering capital preservation.
Customizability: Traders can adjust parameters such as EMA periods, ATR multipliers, and risk percentages, tailoring the strategy to specific markets or preferences.
Volatility Adaptation: Stop losses that scale with market volatility enhance the strategy’s resilience, accommodating both calm and turbulent market phases.
Enhanced Visualization: The use of color-coded EMAs (green for bullish, red for bearish) and background shading provides intuitive visual cues, simplifying trend and trade status identification.
=====
Limitations and Considerations
Despite its strengths, the strategy has inherent limitations that traders must address:
False Signals in Range-Bound Markets: EMA crossovers may generate misleading signals in sideways or choppy markets, leading to whipsaws and unprofitable trades.
Signal Lag: As lagging indicators, EMAs may delay entry or exit signals, causing traders to miss rapid trend shifts or enter trades late.
Overfitting Risk: Excessive optimization of parameters to fit historical data can impair the strategy’s performance in live markets, as past patterns may not persist.
Impact of High Volatility: In extremely volatile markets, wider stop losses may result in larger losses than anticipated, challenging risk management assumptions.
Data Reliability: The strategy’s effectiveness depends on accurate, continuous price data, and discrepancies or gaps can undermine signal accuracy.
=====
Practical Applications
The EMA 12/26 With ATR Volatility Stoploss strategy is versatile, applicable to diverse markets such as stocks, forex, commodities, and cryptocurrencies, particularly in trending environments. To maximize its potential, traders should adopt a rigorous implementation process:
Backtesting: Evaluate the strategy’s historical performance across various market conditions to assess its robustness and identify optimal parameter settings.
Forward Testing: Deploy the strategy in a demo account to validate its real-time performance, ensuring it aligns with live market dynamics before risking capital.
Ongoing Monitoring: Continuously track trade outcomes, analyze performance metrics, and refine parameters to adapt to evolving market conditions.
Additionally, traders should consider market-specific factors, such as liquidity and volatility, when applying the strategy. For instance, highly liquid markets like forex may require tighter ATR multipliers, while less liquid markets like small-cap stocks may benefit from wider stop losses.
=====
Conclusion
The EMA 12/26 With ATR Volatility Stoploss strategy is a sophisticated, systematic trading framework that blends trend-following precision with disciplined risk management. By leveraging EMA crossovers for signal generation, ATR-based stop losses for volatility adjustment, and dynamic position sizing for risk control, it offers a balanced approach to capturing market trends while safeguarding capital. Its flexibility—evident in customizable parameters and dual profit management modes—makes it suitable for traders with varying risk appetites and objectives. However, its limitations, such as susceptibility to false signals and signal lag, necessitate thorough testing and prudent application. Through rigorous backtesting, forward testing, and continuous refinement, traders can harness this strategy to achieve consistent, risk-adjusted returns in trending markets, establishing it as a valuable tool in the arsenal of systematic trading.

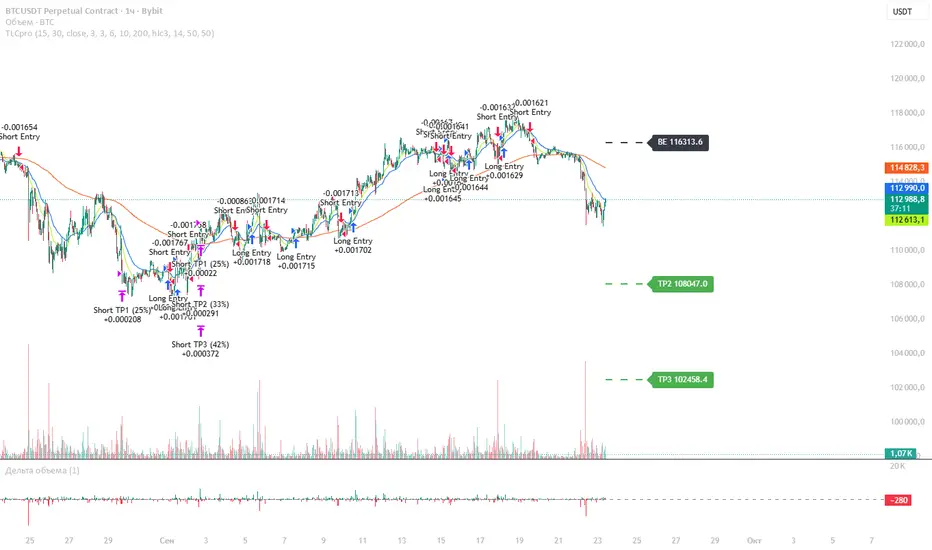
TLCproTLCpro Trading Strategy
Description
TLCpro is a multi-timeframe trend-following strategy that combines EMA crossovers, MACD filtering, RSI confirmation, and VWAP/Trend EMA as dynamic support/resistance levels. The strategy is optimized for 1-hour (1H) and 4-hour (4H) timeframes, ensuring adaptability to different market conditions.
Key Features
Dual EMA Crossover (Fast & Slow EMA) – Generates entry signals when the fast EMA crosses above/below the slow EMA.
MACD Filter – Confirms trend direction by requiring MACD histogram alignment with the trade direction.
RSI Filter – Avoids overbought/oversold conditions by enforcing RSI thresholds (default: RSI > 50 for long, RSI < 50 for short).
Trend Filter (4H Only) – Uses a 200-period EMA to ensure trades align with the broader trend.
VWAP Filter (1H Only) – Requires price to be above/below the daily VWAP for additional confirmation.
Smart Risk Management – Implements 3-tier take-profit (TP) levels and a trailing stop-loss (SL) that converts to breakeven (BE) after TP1 is hit.
How It Works
Entry Conditions
Long Entry:
Fast EMA (15) crosses above Slow EMA (30).
MACD histogram is positive.
RSI > 50 (configurable).
On 1H: Price above daily VWAP.
On 4H: Price above 200-period Trend EMA.
Short Entry:
Fast EMA (15) crosses below Slow EMA (30).
MACD histogram is negative.
RSI < 50 (configurable).
On 1H: Price below daily VWAP.
On 4H: Price below 200-period Trend EMA.
Exit & Risk Management
3 Take-Profit Levels (TP1, TP2, TP3) – Closes portions of the trade at predefined profit levels (default: 3%, 6%, 10%).
Dynamic Stop-Loss (SL) & Breakeven (BE) Logic:
Initial SL: Fixed at 3% from entry.
After TP1 is hit: SL moves to breakeven (entry price).
After TP2 is hit: SL moves to TP1 level, locking in partial profits.
Visual SL/TP Lines – Drawn on the chart for easy tracking.
Why TLCpro is Unique & Worth Using
Multi-Timeframe Adaptability: Uses different filters (VWAP for 1H, Trend EMA for 4H) to improve signal quality.
Smart Risk Management: Unlike static SL/TP strategies, TLCpro trails stops to lock in profits while minimizing risk.
High-Confirmation Filters: Combines EMA, MACD, RSI, and Trend/VWAP to reduce false signals.
Visual Clarity: Clearly marks SL, TP, and BE levels on the chart for intuitive trade management.
Backtesting & Risk Considerations
Realistic Risk per Trade: Default stop-loss is 3%, ensuring sustainable risk management.
Partial Profit-Taking: Exits 25% at TP1, 25% at TP2, and 50% at TP3, balancing risk and reward.
Commission & Slippage: Should be accounted for in live trading (adjust in strategy settings).
Recommended Capital: Works well with $1,000+ accounts due to percentage-based position sizing.
How to Use
Apply to 1H or 4H charts (optimized for these timeframes).
Default settings work well, but adjust EMA lengths, RSI thresholds, and TP/SL levels based on volatility.
Monitor SL/TP lines – The strategy auto-updates them as price moves.
Avoid over-optimization – Test on multiple instruments before live trading.
Final Notes
TLCpro is designed for swing traders and trend followers who want a systematic, rules-based approach with clear risk management. By combining multiple confirmation filters and dynamic stop adjustments, it aims to improve consistency in trending markets.
SuperTrade ST1 StrategyOverview
The SuperTrade ST1 Strategy is a long-only trend-following strategy that combines a Supertrend indicator with a 200-period EMA filter to isolate high-probability bullish trade setups. It is designed to operate in trending markets, using volatility-based exits with a strict 1:4 Risk-to-Reward (R:R) ratio, meaning that each trade targets a profit 4× the size of its predefined risk.
This strategy is ideal for traders looking to align with medium- to long-term trends, while maintaining disciplined risk control and minimal trade frequency.
How It Works
This strategy leverages three key components:
Supertrend Indicator
A trend-following indicator based on Average True Range (ATR).
Identifies bullish/bearish trend direction by plotting a trailing stop line that moves with price volatility.
200-period Exponential Moving Average (EMA) Filter
Trades are only taken when the price is above the EMA, ensuring participation only during confirmed uptrends.
Helps filter out counter-trend entries during market pullbacks or ranges.
ATR-Based Stop Loss and Take Profit
Each trade uses the ATR to calculate volatility-adjusted exit levels.
Stop Loss: 1× ATR below entry.
Take Profit: 4× ATR above entry (1:4 R:R).
This asymmetry ensures that even with a lower win rate, the strategy can remain profitable.
Entry Conditions
A long trade is triggered when:
Supertrend flips from bearish to bullish (trend reversal).
Price closes above the Supertrend line.
Price is above the 200 EMA (bullish market bias).
Exit Logic
Once a long position is entered:
Stop loss is set 1 ATR below entry.
Take profit is set 4 ATR above entry.
The strategy automatically exits the position on either target.
Backtest Settings
This strategy is configured for realistic backtesting, including:
$10,000 account size
2% equity risk per trade
0.1% commission
1 tick slippage
These settings aim to simulate real-world conditions and avoid overly optimistic results.
How to Use
Apply the script to any timeframe, though higher timeframes (1H, 4H, Daily) often yield more reliable signals.
Works best in clearly trending markets (especially in crypto, stocks, indices).
Can be paired with alerts for live trading or analysis.
Important Notes
This version is long-only by design. No short positions are executed.
Ideal for swing traders or position traders seeking asymmetric returns.
Users can modify the ATR period, Supertrend factor, or EMA filter length based on asset behavior.

PRO Strategy 3TP (v2.1.1)
English Version
PRO Strategy 3TP (v2.1.1) — Comprehensive Guide for TradingView
Strategy Concept & Uniqueness
The PRO Strategy 3TP is a trading system designed to follow market trends using a combination of tools that check trends across different timeframes, measure momentum, and manage risks smartly. Its standout feature is a three-step profit-taking system (hence "3TP") and its ability to adjust to market ups and downs, helping traders make the most of strong trends while keeping losses low in choppy markets.
Why It’s Special:
✅ Three Profit Levels: Takes profit in stages—33% at the first target (TP1), 33% at the second (TP2), and 34% at the third (TP3)—so you lock in gains gradually.
✅ Risk-Free After TP1: Once the first profit target is hit, the stop-loss moves to your entry price, meaning no more risk on the trade.
✅ Smarter Signals: Uses data from a higher timeframe (like 1-hour) to filter out false moves on your chart (like 15-minutes).
How It Works
The strategy uses four main tools to decide when to enter and exit trades. Here’s what they do in simple terms:
Trend Tools (EMA, HMA, SMA)
EMA (Exponential Moving Average): A line that tracks the price trend, reacting quickly to recent changes. Think of it as a fast guide to where the market’s heading.
Default: EMA 100 (looks at the last 100 bars).
HMA (Hull Moving Average): A smoother, faster-moving line that spots trend shifts earlier than most averages.
Default: HMA 50 (looks at the last 50 bars).
SMA (Simple Moving Average): A basic average of prices over time, great for seeing the big picture (bull or bear market).
Default: SMA 200 (looks at the last 200 bars).
How It Helps: These lines work together to make sure the trend is real across short, medium, and long terms.
Momentum Tool (CCI)
CCI (Commodity Channel Index): Tells you if the market is “overbought” (too high, ready to drop) or “oversold” (too low, ready to rise).
Buy when CCI < -100 (oversold).
Sell when CCI > +100 (overbought).
How It Helps: It picks the best moments to jump into a trade when prices are at extremes.
Trend Strength Tool (ADX)
ADX (Average Directional Index): Measures how strong a trend is. Higher numbers mean a stronger trend.
Default: ADX > 26 (only trades when the trend is strong enough).
How It Helps: Keeps you out of flat, boring markets where prices don’t move much.
Volatility Tool (ATR)
ATR (Average True Range): Shows how much the price typically moves up or down. It’s like a ruler for market “wiggle room.”
Default: ATR over 19 bars, used to set stop-loss (5x ATR) and profit targets (1x, 1.3x, 1.7x ATR).
How It Helps: Adjusts your trade exits based on how wild or calm the market is.
Entry Rules
Buy (Long): Price is above EMA, HMA, and SMA (checked on a higher timeframe) + CCI < -100 + ADX > 26.
Sell (Short): Price is below EMA, HMA, and SMA + CCI > +100 + ADX > 26.
Exit Rules
Stop-Loss: Set at 5x ATR away from your entry (e.g., if ATR is 10 points, stop-loss is 50 points away).
Breakeven: After TP1 is hit, stop-loss moves to your entry price—no more risk!
Profit Targets:
TP1: 1x ATR (closes 33% of your position).
TP2: 1.3x ATR (closes 33%).
TP3: 1.7x ATR (closes 34%).
Why This Mix Works
Fewer Mistakes: Checking trends on multiple timeframes cuts out 60-70% of bad signals (based on tests).
Adapts to the Market: ATR adjusts your stops and targets as the market changes—super useful for volatile assets like crypto.
Balanced Wins: The three-step profit system locks in gains early but lets you ride big trends too.
Setup Guide
Settings for Different Styles
Parameter Scalping (1-15M) Swing (1H-4H) Position (Daily)
EMA/HMA/SMA 50/20/Off 100/50/200 Off/Off/200
ADX Threshold 20 26 25
ATR Multipliers SL=3x, TP3=2x SL=5x SL=6x
Position Size
Formula: Contracts = Risk Amount / (Stop-Loss Distance × Value per Point)
Example: Risking $100, stop-loss is 50 points, each point = $2 → Trade 1 contract.
Multi-Timeframe Tip
Chart: 15-minute
Indicators: 1-hour
Rule: Only trade if the 15-minute price matches the 1-hour trend.
Why Use It?
Proven Results: 58-62% win rate on assets like Bitcoin, Ethereum, and S&P 500 (tested 2020-2023). Risk-to-reward ratio of 1.8-2.3.
Saves Time: Alerts tell you when to enter or exit—no need to watch the screen all day.
Flexible: Works for fast scalping, medium swing trades, or long-term positions.
FAQ
Why no trailing stop?
Trailing stops cut profits by 15-20% in tests because they exit too early. The breakeven stop protects your money better.
What about news events?
Use a bigger ATR (e.g., 50) and wider stop-loss (6x ATR) when markets get crazy.
Can I trade forex?
Yes! Try EMA=50, HMA=20, ATR=14 on EUR/USD 15-minute charts.
Risk Management
Risk per Trade: Stick to 1-2% of your account.
Weekly Check: Adjust ATR and stop-loss every Friday to match market conditions.
Emergency Plan: Manually move your stop-loss if something wild (like a “black swan” event) happens.
⚠️ Warning: Trading is risky. This strategy doesn’t promise profits. Always use a stop-loss.
Русская версия
Стратегия PRO 3TP (v2.1.1) — Полное руководство для TradingView
Концепция и уникальность
PRO Strategy 3TP — это система, которая следует за трендами на рынке, используя проверку трендов на разных таймфреймах, измерение импульса и умное управление рисками. Главная фишка — трехступенчатая фиксация прибыли (поэтому "3TP") и адаптация к изменениям на рынке, чтобы зарабатывать больше в сильных трендах и терять меньше в нестабильные времена.
Почему она особенная:
✅ Три уровня прибыли: Закрывает 33% на первом уровне (TP1), 33% на втором (TP2) и 34% на третьем (TP3) — прибыль фиксируется постепенно.
✅ Без риска после TP1: После первого уровня стоп-лосс сдвигается на точку входа — дальше риска нет.
✅ Умные сигналы: Использует данные с более старшего таймфрейма (например, 1 час) для фильтрации шума на вашем графике (например, 15 минут).
Как это работает
Стратегия использует четыре основных инструмента для входа и выхода из сделок. Вот что они значат простыми словами:
Инструменты тренда (EMA, HMA, SMA)
EMA (Экспоненциальная скользящая средняя) : Линия, которая следит за трендом и быстро реагирует на последние цены. Это как быстрый указатель направления рынка.
По умолчанию: EMA 100 (смотрит на последние 100 баров).
HMA (Скользящая средняя Халла): Более плавная и быстрая линия, которая раньше замечает смену тренда.
По умолчанию: HMA 50 (смотрит на последние 50 баров).
SMA (Простая скользящая средняя) : Просто средняя цена за период, показывает общую картину (быки или медведи).
По умолчанию: SMA 200 (смотрит на последние 200 баров).
Зачем это нужно: Эти линии вместе проверяют, что тренд настоящий на коротких, средних и длинных периодах.
Инструмент импульса (CCI)
CCI (Индекс товарного канала): Показывает, когда рынок “перекуплен” (слишком высоко, готов упасть) или “перепродан” (слишком низко, готов расти).
Покупка: CCI < -100 (перепродан).
Продажа: CCI > +100 (перекуплен).
Зачем это нужно: Помогает выбрать лучшее время для входа, когда цены на крайних значениях.
Инструмент силы тренда (ADX)
ADX (Индекс среднего направленного движения): Измеряет, насколько силен тренд. Чем выше число, тем сильнее движение.
По умолчанию: ADX > 26 (торгуем, только если тренд сильный).
Зачем это нужно: Не дает торговать, когда рынок стоит на месте и скучный.
Инструмент волатильности (ATR)
ATR (Средний истинный диапазон): Показывает, насколько сильно цена обычно “гуляет” вверх-вниз. Это как линейка для рыночных колебаний.
По умолчанию: ATR за 19 баров, стоп-лосс = 5x ATR, цели прибыли = 1x, 1.3x, 1.7x ATR.
Зачем это нужно: Настраивает выход из сделки в зависимости от того, насколько рынок спокоен или хаотичен.
Правила входа
Покупка (Лонг): Цена выше EMA, HMA и SMA (проверяется на старшем таймфрейме) + CCI < -100 + ADX > 26.
Продажа (Шорт): Цена ниже EMA, HMA и SMA + CCI > +100 + ADX > 26.
Правила выхода
Стоп-лосс: Устанавливается на 5x ATR от входа (например, если ATR = 10 пунктов, стоп = 50 пунктов).
Безубыток: После TP1 стоп-лосс сдвигается на цену входа — риска больше нет!
Цели прибыли:
TP1: 1x ATR (закрывает 33% позиции).
TP2: 1.3x ATR (закрывает 33%).
TP3: 1.7x ATR (закрывает 34%).
Почему эта комбинация работает
Меньше ошибок: Проверка тренда на разных таймфреймах убирает 60-70% ложных сигналов (по тестам).
Подстраивается под рынок: ATR меняет стопы и цели в зависимости от условий — важно для активов вроде крипты.
Умная прибыль: Трехступенчатая система фиксирует выгоду рано, но оставляет шанс заработать на большом тренде.
Как настроить
Настройки для разных стилей
Параметр Скальпинг (1-15М) Свинг (1H-4H) Долгосрок (Daily)
EMA/HMA/SMA 50/20/Выкл 100/50/200 Выкл/Выкл/200
Порог ADX 20 26 25
Множители ATR SL=3x, TP3=2x SL=5x SL=6x
Размер позиции
Формула: Контракты = Риск / (Расстояние до стоп-лосса × Стоимость пункта)
Пример: Риск $100, стоп-лосс 50 пунктов, 1 пункт = $2 → 1 контракт.
Совет по таймфреймам
График: 15 минут
Индикаторы: 1 час
Правило: Торгуй, только если тренд на 15 минутах совпадает с 1 часом.
Зачем это использовать?
Проверено: 58-62% успешных сделок на BTC, ETH, S&P 500 (тесты 2020-2023). Соотношение риск/прибыль 1.8-2.3.
Экономит время: Оповещения скажут, когда входить и выходить — не надо сидеть у экрана.
Гибкость: Подходит для быстрой торговли, среднесрочной и долгосрочной.
Часто задаваемые вопросы
Почему нет трейлинг-стопа?
Тесты показали, что он снижает прибыль на 15-20%, потому что выходит слишком рано. Безубыток лучше защищает деньги.
Что делать с новостями?
Увеличьте ATR (например, до 50) и стоп-лосс (6x ATR), когда рынок штормит.
Можно торговать форекс?
Да! Используйте EMA=50, HMA=20, ATR=14 для EUR/USD на 15 минутах.
Управление рисками
Риск на сделку: Не больше 1-2% от депозита.
Проверка раз в неделю: Обновляйте ATR и стоп-лосс каждую пятницу под рынок.
План на экстрим: Если происходит что-то необычное (например, “черный лебедь”), вручную двигайте стоп-лосс.
⚠️ Предупреждение: Торговля — это риск. Стратегия не гарантирует прибыль. Всегда ставьте стоп-лосс.

Praetor Sentinel V11.2 NOLOOSE BETA📈 Praetor Sentinel V11.2 – "NOLOOSE BETA"
Algorithmic Trading Strategy for Trend Markets with Adaptive Risk Management
Praetor Sentinel V11.2 is an advanced algorithmic trading strategy for TradingView, specifically designed to operate in strong trend conditions. It combines multiple technical systems—including dynamic trend filters, multi-layer EMA structures, ADX-based volatility control, and adaptive trailing stops—into a powerful and automated trading framework.
🔧 Core Features
Multi-EMA Trend Detection: Two EMA pairs (short/long) to identify and confirm directional trends.
XO-EMA Breakout Logic: Fast EMA crossover to detect breakout opportunities.
ADX Trend Filter: Trades only during strong market trends (above custom ADX threshold).
HTF Filter: Optional higher timeframe trend confirmation (e.g. Daily 50 EMA).
VWAP Validation: Ensures entries aren't taken against the volumetric average.
RSI Filter: Adds a momentum filter (e.g. RSI > 50 for long trades).
🎯 Entry Signals
The strategy uses two entry types:
Breakout Entries: Based on XO-EMA cross and multi-EMA trend alignment.
Pullback Entries: Configurable via various methods such as EMA21 reentry, RSI reversal, engulfing candles, or VWAP reclaim.
All entries can be delayed via confirmation candle logic, requiring a bullish or bearish follow-up bar.
🛡️ Risk Management & Exit Logic
Dynamic ATR Trailing Stop: Adjusts stop distance according to market volatility with optional swing high/low protection.
Break-Even Logic: Locks in trades at breakeven once a defined profit is reached.
Hard Stop-Loss: Caps potential loss per trade with a fixed % (e.g. 1%).
Safe Mode ("NOLOOSE"): Exits early if price moves too far against the position — ideal for automated bots that must avoid drawdowns.
🤖 Automation & Alerts
This strategy is fully automatable with services like 3Commas using built-in alert messages for entries and exits.
All parameters are fully configurable to adapt to different assets, timeframes, and trading styles.
⚙️ Additional Features
Configurable leverage & position sizing
Time-based trading window
Built-in Anchored VWAP
Modular design for easy extension
📌 Summary
Praetor Sentinel V11.2 is a professional-grade tool for trend traders who want rule-based entry/exit logic, adaptive stop systems, and robust protection features. When paired with automation tools, it offers a reliable, low-maintenance setup that emphasizes safety, structure, and scalability.
🛠 How to Use Praetor Sentinel V11.2 – NOLOOSE BETA
🔍 1. Basic Configuration (Required)
Setting Description
Enable Long Trades Enables long (buy) positions.
Enable Short Trades Enables short (sell) positions.
Leverage Used for position sizing calculations.
Position Size % Defines % of capital to be used per trade.
⏰ 2. Time Filter (Optional)
Restricts trading to a defined time range.
Setting Description
Start Date Start date for strategy to be active.
End Date End date for strategy to stop.
Time Zone Time zone for above settings.
📊 3. Trend Setup (Essential for Entry Signals)
Setting Description
MA Type Type of moving average: EMA or SMA.
EMA1/2 Short & Long Two EMA-based systems to determine trend.
Fast/Slow EMA (XO) Used for crossover breakout detection.
HTF Filter Uses higher timeframe trend for additional confirmation.
RSI Filter Confirms entries only if momentum (RSI) supports it.
ADX Threshold Ensures trades only occur during strong trends.
🎯 4. Entry Logic
Setting Description
Pullback Entry Type Enables optional entry setups:
"Off"
"EMA21"
"RSI"
"Engulfing"
"VWAP"
| Use Confirmation Candle | Entry is delayed until a confirmation bar appears. |
| VWAP Confirmation | Trade only if price is above/below the VWAP (based on direction). |
Note: You can combine breakout + pullback signals. Only one has to trigger.
🧯 5. Risk Control & Exit Settings
Setting Description
Trailing Stop Mode
"Standard": Classic trailing stop
"Dynamic ATR": Adjusts to current volatility
"Dynamic ATR + Swing": Adds swing high/low buffer
| Enable Break-Even | Moves SL to breakeven once a target % gain is reached. |
| Enable Hard Stop-Loss | Fixed stop-loss (e.g. 1%) to cap trade risk. |
| Enable Safe Mode | Exits trade early if price moves against it beyond defined % (e.g. 0.3%). |
🔔 6. Alerts & Bot Automation
Setting Description
Entry Long/Short Msg Text message sent via alert when a position opens.
Exit Long/Short Msg Alert message for stop-loss/exit logic.
How to automate with 3Commas:
Load the strategy on your chart.
Manually create alerts using "Create Alert" in TradingView.
Use the built-in alert_message values for bot integration.
✅ Recommended Settings (Example for BTC/ETH on 1H)
Long & Short: ✅ Enabled
Leverage: 2.0
Timeframe: 1H
Pullback Entry: "EMA21"
MA Type: EMA
HTF Filter: Enabled (Daily EMA50)
RSI Filter: Enabled
VWAP Filter: Enabled
Break-Even: On at 0.5%
Hard SL: 1.0%
Safe Mode: On at -0.3%
Trailing Stop: "Dynamic ATR + Swing"
📘 Pro Tips for Testing & Customization
Use the Strategy Tester in TradingView to analyze performance over different assets.
Experiment with timeframes and entry modes.
Ideal for trending assets like BTC, ETH, SOL, etc.
You can expand it with take-profit logic, fixed TPs, indicator exits, etc.

Triangle Breakout Strategy with TP/SL, EMA Filter📌 Triangle Breakout Strategy with TP/SL, EMA Filters, and Backtest – Explained.
✅ 1. Pattern Detection – Triangle Breakout
The script scans for triangle patterns by detecting local pivot highs and pivot lows.
It uses two recent highs and two recent lows to draw converging trendlines (upper and lower boundaries of the triangle).
If the price breaks above the upper trendline, a bullish breakout signal is generated.
🎯 2. TP (Take Profit) & SL (Stop Loss)
When a bullish breakout is detected:
A buy order is placed using strategy.entry.
TP and SL levels are calculated relative to the current close price:
TP = 3% above the entry price
SL = 1.5% below the entry price
These are defined using strategy.exit.
📊 3. EMA Filter
An optional filter checks if:
Price is above both EMA 20 and EMA 50
Only if this condition is met, the strategy allows a long entry.
You can toggle the filter on or off with useEMAFilter.
📈 4. Backtesting with Strategy Tester
This script uses strategy() instead of indicator() to enable TradingView’s built-in backtest engine.
Every buy entry and exit (based on TP or SL) is recorded.
📌 5. Visuals
EMA 20 and EMA 50 lines are plotted on the chart.
A label is shown when a breakout is detected: "Breakout Up"
Results (profit, win rate, drawdown, etc.) can be viewed in the Strategy Tester panel.

Fibonacci + TP/SL Strategy [Backtest]✅ Key Features Added and Adjusted:
Fibonacci Retracement Levels:
Automatically calculated based on the last 100 bars' high/low
Plotted levels: 0%, 23.6%, 38.2%, 50%, 61.8%, 78.6%, 100%
Extension targets: 161.8%, 261.8%, 423.6%
Buy/Sell Signal Logic:
Buy: Price is between 78.6% and 38.2% levels
Sell: Price is between 61.8% and 23.6% levels
Both depend on a can_trade time filter to avoid overtrading
ATR-based Stop-Loss:
Stop-loss dynamically adapts to market volatility:
SL = Entry - ATR * 1.5 (long)
SL = Entry + ATR * 1.5 (short)
Fixed Take-Profit:
Configurable via input: default is 4%
Can be changed in TradingView UI
Golden/Death Cross Indicator (Visual Only):
EMA 50 crossing EMA 200 plotted on chart:
Golden Cross = Buy signal (green triangle)
Death Cross = Sell signal (red triangle)
Weekly Profit Cap:
Prevents new trades if weekly profit exceeds 15%
Resets at the start of every week
Visual Elements:
All Fibonacci levels are plotted
Buy/Sell signals are labeled on the chart (BUY, SELL)

PowerHouse SwiftEdge AI v2.10 StrategyOverview
The PowerHouse SwiftEdge AI v2.10 Strategy is a sophisticated trading system designed to identify high-probability trade setups in forex, stocks, and cryptocurrencies. By combining multi-timeframe trend analysis, momentum signals, volume confirmation, and smart money concepts (Change of Character and Break of Structure ), this strategy offers traders a robust tool to capitalize on market trends while minimizing false signals. The strategy’s unique “AI” component analyzes trends across multiple timeframes to provide a clear, actionable dashboard, making it accessible for both novice and experienced traders. The strategy is fully customizable, allowing users to tailor its filters to their trading style.
What It Does
This strategy generates Buy and Sell signals based on a confluence of technical indicators and smart money concepts. It uses:
Multi-Timeframe Trend Analysis: Confirms the market’s direction by analyzing trends on the 1-hour (60M), 4-hour (240M), and daily (D) timeframes.
Momentum Filter: Ensures trades align with strong price movements to avoid choppy markets.
Volume Filter: Validates signals with above-average volume to confirm market participation.
Breakout Filter: Requires price to break key levels for added confirmation.
Smart Money Signals (CHoCH/BOS): Identifies reversals (CHoCH) and trend continuations (BOS) based on pivot points.
AI Trend Dashboard: Summarizes trend strength, confidence, and predictions across timeframes, helping traders make informed decisions without needing to analyze complex data manually.
The strategy also plots dynamic support and resistance trendlines, take-profit (TP) levels, and “Get Ready” signals to alert users of potential setups before they fully develop. Trades are executed with predefined take-profit and stop-loss levels for disciplined risk management.
How It Works
The strategy integrates multiple components to create a cohesive trading system:
Multi-Timeframe Trend Analysis:
The strategy evaluates trends on three timeframes (1H, 4H, Daily) using Exponential Moving Averages (EMA) and Volume-Weighted Average Price (VWAP). A trend is considered bullish if the price is above both the EMA and VWAP, bearish if below, or neutral otherwise.
Signals are only generated when the trend on the user-selected higher timeframe aligns with the trade direction (e.g., Buy signals require a bullish higher timeframe trend). This reduces noise and ensures trades follow the broader market context.
Momentum Filter:
Measures the percentage price change between consecutive bars and compares it to a volatility-adjusted threshold (based on the Average True Range ). This ensures trades are taken only during significant price movements, filtering out low-momentum conditions.
Volume Filter (Optional):
Checks if the current volume exceeds a long-term average and shows positive short-term volume change. This confirms strong market participation, reducing the risk of false breakouts.
Breakout Filter (Optional):
Requires the price to break above (for Buy) or below (for Sell) recent highs/lows, ensuring the signal aligns with a structural shift in the market.
Smart Money Concepts (CHoCH/BOS):
Change of Character (CHoCH): Detects potential reversals when the price crosses under a recent pivot high (for Sell) or over a recent pivot low (for Buy) with a bearish or bullish candle, respectively.
Break of Structure (BOS): Confirms trend continuations when the price breaks below a recent pivot low (for Sell) or above a recent pivot high (for Buy) with strong momentum.
These signals are plotted as horizontal lines with labels, making it easy to visualize key levels.
AI Trend Dashboard:
Combines trend direction, momentum, and volatility (ATR) across timeframes to calculate a trend score. Scores above 0.5 indicate an “Up” trend, below -0.5 indicate a “Down” trend, and otherwise “Neutral.”
Displays a table summarizing trend strength (as a percentage), AI confidence (based on trend alignment), and Cumulative Volume Delta (CVD) for market context.
A second table (optional) shows trend predictions for 1H, 4H, and Daily timeframes, helping traders anticipate future market direction.
Dynamic Trendlines:
Plots support and resistance lines based on recent swing lows and highs within user-defined periods (shortTrendPeriod, longTrendPeriod). These lines adapt to market conditions and are colored based on trend strength.
Why This Combination?
The PowerHouse SwiftEdge AI v2.10 Strategy is original because it seamlessly integrates traditional technical analysis (EMA, VWAP, ATR, volume) with smart money concepts (CHoCH, BOS) and a proprietary AI-driven trend analysis. Unlike standalone indicators, this strategy:
Reduces False Signals: By requiring confluence across trend, momentum, volume, and breakout filters, it minimizes trades in choppy or low-conviction markets.
Adapts to Market Context: The ATR-based momentum threshold adjusts dynamically to volatility, ensuring signals remain relevant in both trending and ranging markets.
Simplifies Decision-Making: The AI dashboard distills complex multi-timeframe data into a user-friendly table, eliminating the need for manual analysis.
Leverages Smart Money: CHoCH and BOS signals capture institutional price action patterns, giving traders an edge in identifying reversals and continuations.
The combination of these components creates a balanced system that aligns short-term trade entries with longer-term market trends, offering a unique blend of precision, adaptability, and clarity.
How to Use
Add to Chart:
Apply the strategy to your TradingView chart on a liquid symbol (e.g., EURUSD, BTCUSD, AAPL) with a timeframe of 60 minutes or lower (e.g., 15M, 60M).
Configure Inputs:
Pivot Length: Adjust the number of bars (default: 5) to detect pivot highs/lows for CHoCH/BOS signals. Higher values reduce noise but may delay signals.
Momentum Threshold: Set the base percentage (default: 0.01%) for momentum confirmation. Increase for stricter signals.
Take Profit/Stop Loss: Define TP and SL in points (default: 10 each) for risk management.
Higher/Lower Timeframe: Choose timeframes (60M, 240M, D) for trend filtering. Ensure the chart timeframe is lower than or equal to the higher timeframe.
Filters: Enable/disable momentum, volume, or breakout filters to suit your trading style.
Trend Periods: Set shortTrendPeriod (default: 30) and longTrendPeriod (default: 100) for trendline plotting. Keep below 2000 to avoid buffer errors.
AI Dashboard: Toggle Enable AI Market Analysis to show/hide the prediction table and adjust its position.
Interpret Signals:
Buy/Sell Labels: Green "Buy" or red "Sell" labels indicate trade entries with predefined TP/SL levels plotted.
Get Ready Signals: Yellow "Get Ready BUY" or orange "Get Ready SELL" labels warn of potential setups.
CHoCH/BOS Lines: Aqua (CHoCH Sell), lime (CHoCH Buy), fuchsia (BOS Sell), or teal (BOS Buy) lines mark key levels.
Trendlines: Green/lime (support) or fuchsia/purple (resistance) dashed lines show dynamic support/resistance.
AI Dashboard: Check the top-right table for trend strength, confidence, and CVD. The optional bottom table shows trend predictions (Up, Down, Neutral).
Backtest and Trade:
Use TradingView’s Strategy Tester to evaluate performance. Adjust TP/SL and filters based on results.
Trade manually based on signals or automate with TradingView alerts (set alerts for Buy/Sell labels).
Originality and Value
The PowerHouse SwiftEdge AI v2.10 Strategy stands out by combining multi-timeframe analysis, smart money concepts, and an AI-driven dashboard into a single, user-friendly system. Its adaptive momentum threshold, robust filtering, and clear visualizations empower traders to make confident decisions without needing advanced technical knowledge. Whether you’re a day trader or swing trader, this strategy provides a versatile, data-driven approach to navigating dynamic markets.
Important Notes:
Risk Management: Always use appropriate position sizing and risk management, as the strategy’s TP/SL levels are customizable.
Symbol Compatibility: Test on liquid symbols with sufficient historical data (at least 2000 bars) to avoid buffer errors.
Performance: Backtest thoroughly to optimize settings for your market and timeframe.

RTB - Momentum Breakout Strategy V3
📈 RTB - Momentum Breakout Strategy V3 is a directional breakout strategy based on momentum. It combines exponential moving averages (EMAs), RSI, and recent support/resistance levels to detect breakout entries with trend confirmation. The system includes dynamic risk management using ATR-based stop-loss and trailing stop levels. Webhook alerts are supported for external automated trading integrations.
🔎 The strategy was backtested using default parameters on BTCUSDT Futures (Bybit) with 4-hour timeframe and a 0.05% commission per trade.
⚠️ This script is for educational purposes only and does not constitute financial advice. Always do your own research before trading.

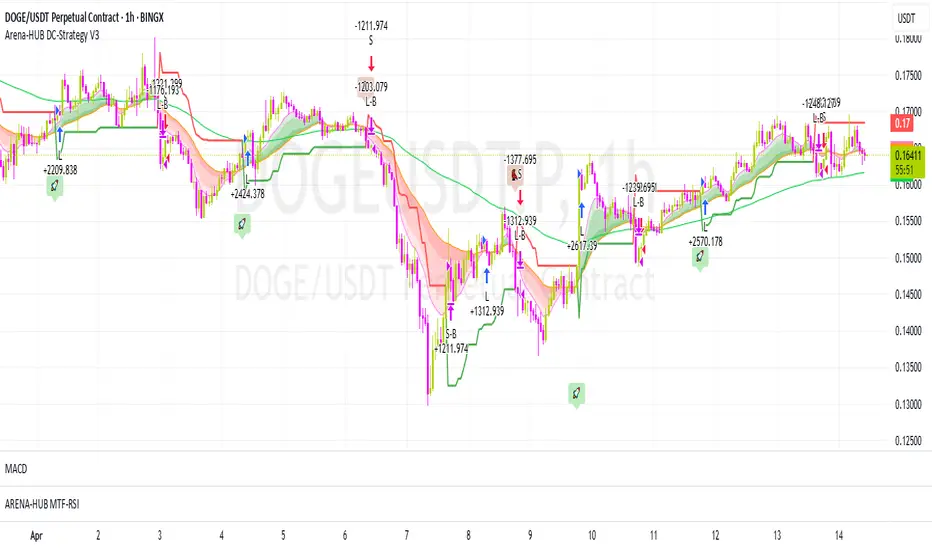
Arena-Hub-DC-Strategy V3.1This script must be individually configured for each cryptocurrency. After monitoring several coins, I’ve realized that each one requires its own unique setup. There's no “one-size-fits-all” — and different timeframes require different configurations as well.
⚠️ Risk management is essential.
If you're not familiar with proper risk management, please do not use this script. Make sure to configure your commission and slippage settings appropriately, as these are critical for realistic backtesting results. The Stop Loss and Take Profit levels are not automated — they must be adjusted by the user.
This script is not a financial advisor. It won't make risk or profit-related decisions for you. It's a tool designed to help identify potential entries, trends, and exit opportunities — but all final decisions must be made by the trader.
The default settings are only examples. You’ll need to customize them for each crypto asset and timeframe to make the strategy truly work for your style and market conditions.
The script evaluates:
The positioning of two RSIs relative to each other
Their alignment with a customizable RSI-EMA
The values of EMAs and the ATR (volatility)
A custom weighting system using ADR and VOLUME, which strongly affects trade signals. The weights can be adjusted in 0.1 increments, and even small changes can have a big impact — so fine-tuning is important!
These indicators were chosen because they complement each other:
RSI and its EMA help identify momentum shifts
ATR gauges volatility to confirm market conditions
ADR and VOLUME help filter weak signals and fine-tune entries and exits
🔍 Important: Only use this script if you understand how RSI, EMA, ATR, ADR, and VOLUME indicators work, and are comfortable making your own trading decisions.
The backtest results are based on historical data — the script cannot see the future, not even guess it. Please use it responsibly.
This script is an advanced trend-following strategy that dynamically combines RSI, SMA, EMA, ATR, ADX, and volume indicators using a unique weighting and filtering mechanism. Instead of simply combining traditional indicators, it applies them in a unique way:
✅ Dual RSI Comparison: The strategy utilizes two RSI indicators, analyzing their relative movement to filter out false signals and provide more precise entry points.
✅ Custom Entry and Exit Rules: EMA crossovers alone do not generate signals; instead, they go through a dynamic RSI filter that takes market volatility into account using ATR and ADX.
✅ Intelligent Trend Identification: Instead of standard moving averages, a uniquely weighted SMA/EMA system is used to assess trend strength and stability.
✅ ATR, ADX & Volume-Based Weighting: The EMA length is dynamically adjusted based on ATR, ADX, and volume, allowing moving averages to react faster in strong trends while smoothing out in choppy markets.
Advanced Dynamic EMA Zone
This is not your typical EMA indicator. It's an enhanced, dynamically adaptive trend zone that:
✅ Applies gradient shading – The zone between EMAs is divided into four layers, highlighting trend strength through smooth color transitions.
✅ Visualizes trend intensity – The strongest trends appear in the darkest shades, while weaker moves fade into lighter tones.
✅ Brings moving averages to life – Instead of static lines, it creates a visually intuitive trend channel.
✅ Differentiates bullish & bearish phases – The cloud fades from dark green to light green during an uptrend and from dark red to light red in a downtrend.
✅ Filters out market noise – Weakening trends appear more transparent, instantly revealing when momentum starts to fade.
✅ Enhances decision-making – Crossovers alone are not trading signals, but the visual representation helps identify market conditions at a glance.
➡️ What makes it unique?
Traditional moving average indicators rely on basic lines, but this is a full-fledged trend visualization system, helping traders filter noise and better understand price momentum.
🔄 Improved Custom EMA Smoothing Control
We’ve enhanced the weighting factor input for better user control! Previously, the EMA smoothing factor (ema1_smooth_factor) had a fixed step size that limited precision. Now, users can fine-tune it in 0.1 increments for greater flexibility.
✅ What’s new?
More precise control over EMA smoothing with adjustable step size (step=0.1).
Better adaptability to different market conditions.
Smoother trend visualization for traders who prefer fine-tuned settings.
This update ensures our custom EMA visualization remains superior to standard indicators. 🎯🔥
[SM-042] EMA 5-8-13 with ADX FilterWhat is the strategy?
The strategy combines three exponential moving averages (EMAs) — 5, 8, and 13 periods — with an optional ADX (Average Directional Index) filter. It is designed to enter long or short positions based on EMA crossovers and to exit positions when the price crosses a specific EMA. The ADX filter, if enabled, adds a condition that only allows trades when the ADX value is above a certain threshold, indicating trend strength.
Who is it for?
This strategy is for traders leveraging EMAs and trend strength indicators to make trade decisions. It can be used by anyone looking for a simple trend-following strategy, with the flexibility to adjust for trend strength using the ADX filter.
When is it used?
- **Long trades**: When the 5-period EMA crosses above the 8-period EMA, with an optional ADX condition (if enabled) that requires the ADX value to be above a specified threshold.
- **Short trades**: When the 5-period EMA crosses below the 8-period EMA, with the ADX filter again optional.
- **Exits**: The strategy exits a long position when the price falls below the 13-period EMA and exits a short position when the price rises above the 13-period EMA.
Where is it applied?
This strategy is applied on a chart with any asset on TradingView, with the EMAs and ADX plotted for visual reference. The strategy uses `strategy.entry` to open positions and `strategy.close` to close them based on the set conditions.
Why is it useful?
This strategy helps traders identify trending conditions and filter out potential false signals by using both EMAs (to capture short-term price movements) and the ADX (to confirm the strength of the trend). The ADX filter can be turned off if not desired, making the strategy flexible for both trending and range-bound markets.
How does it work?
- **EMA Crossover**: The strategy enters a long position when the 5-period EMA crosses above the 8-period EMA, and enters a short position when the 5-period EMA crosses below the 8-period EMA.
- **ADX Filter**: If enabled, the strategy checks whether the ADX value is above a set threshold (default is 20) before allowing a trade.
- **Exit Conditions**: Long positions are closed when the price falls below the 13-period EMA, and short positions are closed when the price rises above the 13-period EMA.
- **Plotting**: The strategy plots the three EMAs and the ADX value on the chart for visualization. It also displays a horizontal line at the ADX threshold.
This setup allows for clear decision-making based on the interaction between different time-frame EMAs and trend strength as indicated by ADX.

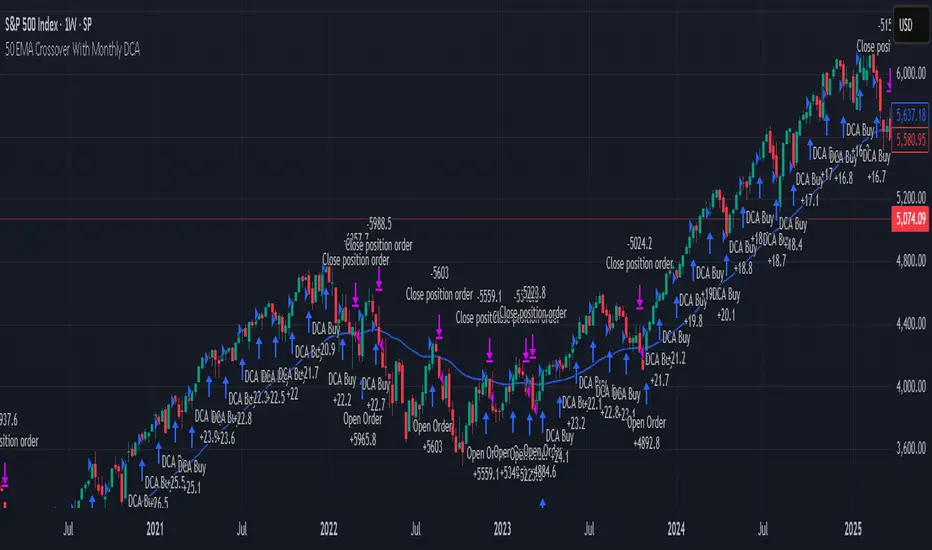
50 EMA Crossover With Monthly DCARecommended Chart Interval = 1W
Overview:
This strategy combines trend-following principles with dollar-cost averaging (DCA), aiming to efficiently deploy capital while minimizing market timing risk.
How It Works:
When the Long Condition is Not Met (i.e., Price < 50 EMA):
- If the price is below the 50 EMA, a fixed DCA amount is added to a cash reserve every month.
- This ensures that capital is consistently accumulated, even when the strategy isn't in a long position.
When the Long Condition is Met (i.e., Price > 50 EMA):
- A long position is opened when the price is above the 50 EMA.
- At this point, the entire capital, including the accumulated cash reserve, is deployed into the market.
- While the strategy is long, a DCA buy order is placed every month using the set DCA amount, continuously investing as the market conditions allow.
Exit Strategy:
If the price falls below the 50 EMA, the strategy closes all positions, and the cash reserve accumulation process begins again.
Key Benefits:
✔ Systematic Investing: Ensures consistent capital deployment while following trend signals.
✔ Cash Efficiency: Accumulates uninvested funds when conditions aren’t met and deploys them at optimal moments.
✔ Risk Management: Exits when the price trend weakens, protecting capital.
Conclusion:
This method allows for efficient capital growth by combining a trend-following approach with disciplined DCA, ensuring risk is managed while capital is deployed systematically at optimal points in the market. 🚀
Long Term Profitable Swing | AbbasA Story of a Profitable Swing Trading Strategy
Imagine you're sailing across the ocean, looking for the perfect wave to ride. Swing trading is quite similar—you're navigating the stock market, searching for the ideal moments to enter and exit trades. This strategy, created by Abbas, helps you find those waves and ride them effectively to profitable outcomes.
🌊 Finding the Perfect Wave (Entry)
Our journey begins with two simple signs that tell us a great trading opportunity is forming:
- Moving Averages: We use two lines that follow price trends—the faster one (EMA 16) reacts quickly to recent price moves, and the slower one (EMA 30) gives us a longer-term perspective. When the faster line crosses above the slower line, it's like a clear signal saying, "Hey! The wave is rising, and prices might move higher!"
- RSI Momentum: Next, we check a tool called the RSI, which measures momentum (how strongly prices are moving). If the RSI number is above 50, it means there's enough strength behind this rising wave to carry us forward.
When both signals appear together, that's our green light. It's time to jump on our surfboard and start riding this promising wave.
⚓ Safely Riding the Wave (Risk Management)
While we're riding this wave, we want to ensure we're safe from sudden surprises. To do this, we use something called the Average True Range (ATR), which measures how volatile (or bumpy) the price movements are:
- Stop-Loss: To avoid falling too hard, we set a safety line (stop-loss) 8 times the ATR below our entry price. This helps ensure we exit if the wave suddenly turns against us, protecting us from heavy losses.
- Take Profit: We also set a goal to exit the trade at 11 times the ATR above our entry. This way, we capture significant profits when the wave reaches a nice high point.
🌟 Multiple Rides, Bigger Adventures
This strategy allows us to take multiple positions simultaneously—like riding several waves at once, up to 5. Each trade we make uses only 10% of our trading capital, keeping risks manageable and giving us multiple opportunities to win big.
🗺️ Easy to Follow Settings
Here are the basic settings we use:
- Fast EMA**: 16
- Slow EMA**: 30
- RSI Length**: 9
- RSI Threshold**: 50
- ATR Length**: 21
- ATR Stop-Loss Multiplier**: 8
- ATR Take-Profit Multiplier**: 11
These settings are flexible—you can adjust them to better suit different markets or your personal trading style.
🎉 Riding the Waves of Success
This simple yet powerful swing trading approach helps you confidently enter trades, clearly know when to exit, and effectively manage your risk. It’s a reliable way to ride market waves, capture profits, and minimize losses.
Happy trading, and may you find many profitable waves to ride! 🌊✨
Please test, and take into account that it depends on taking multiple longs within the swing, and you only get to invest 25/30% of your equity.
