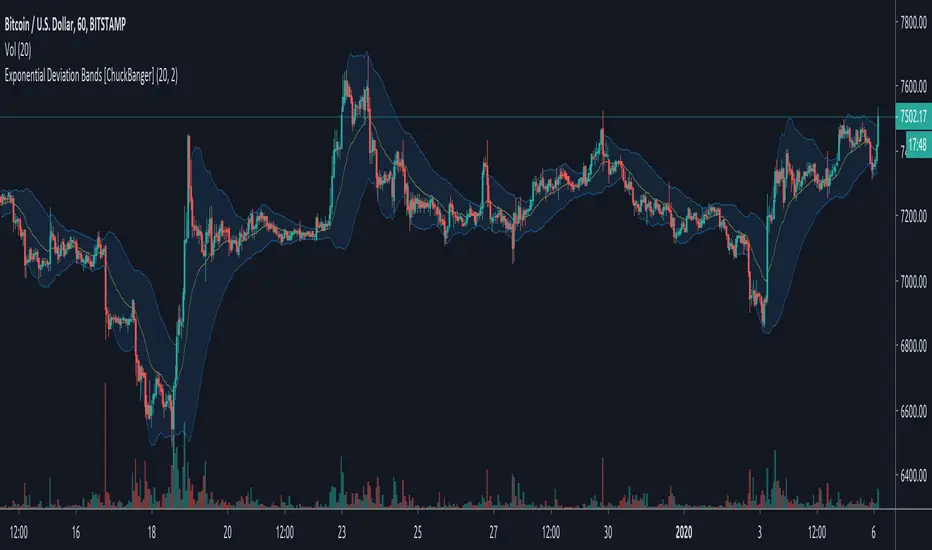
Exponential Deviation Bands [ChuckBanger]This is Exponential Deviation Bands. It is a price band indicator based on exponential deviation rather than the more traditional standard deviation, as you find in the well-known Bollinger Bands calculation. As compared to standard deviation bands, exponential deviation bands apply more weight to recent data and generate fewer breakouts. There fore it is a much better tool to identifying trends.
One strategy on the daily can be
Buy next bar if closing price crosses below the lower bands
Sell if price is equal to the current value of the upper bands
Experimental
(16) DRAGON-X VS-148The Dragon is an experimental indicator that is currently still under development. I called this indicator the Dragon because, not unlike the movie and book; “How to train your Dragon”, you must adjust or dial in this indicator (train it) to get good entry/exit signals out of it, for each individual equity you want to examine. That is not nearly as convenient as all of my other indicators, but the extra work can be worth the effort. The benefits of this indicator are its responsive nature and it forecasting ability. In the inputs the algorithm allows you to select a forecasting option. Forecasting in this instance merely means shifting the resulting indicator projections forward by altering the algorithm to be looser. It can fairly accurately forecast 1 to 3 bars forward. The more forward you set the adjustment the less accurate it becomes. John Ehlers was the first person to transform Dr. Voss’s algorithm into an equity trading indicatory. His observations about forecasting are important. While the Voss filter “can’t it really look into the future, it can provide signals in advance of signals used by other traders – and that may be enough to create a successful trading edge.”
As the image below demonstrates the Dragon does indeed get you into and our of trades in advance of even our best indicator, Genie-Cycles, shown below the Dragon.
The second issue regarding this indicator is, it’s not easy to understand the rational behind it. The Dragon filter is a direct derivative of the Voss Predictive Filter. Dr. Voss describes this filter as “A filter for universal real-time prediction of band-limited signals” This algorithm was developed to provide greater resolution and insight into a wide class of signals generated by deterministic or stochastic systems. It attempts to remove group and phase delays from the Weighted Moving Average output. One of Dr. Voss’s fields of endeavor is working to make MRI images clearer. This is done by extracting the first harmonic of the output using a bandpass filter and then applying a "negative-delay" formula to it. Forecasting financial time series is regarded as one of the most challenging applications of time series prediction due to their dynamic nature.
We have more information on our website describing this indicator as well as three links to reference articles that describe the scientific concept underpinning this indicator.
In the image below, the Dragon Indicator is plotted below the price chart so you can see the correlation between the two. If you examine the last two entry signals you can clearly see that the Dragon flags an entry position very early in the turning point transition shift. Actually, at points in the chart that do not in any way look like the end of the last down leg of the cycle. This get you into a trade before most of the rest of the other market competitors.
We consider the Dragon to still be under development. It requires a narrow band width of input data, for the output to generate reliably accurate signals. Market data has unlimited bandwidth.
Our future development of this indicator will take two center of gravity filters and first narrow that resulting bandwidth by utilizing a pass band filter. We will than use this data as an input to the Voss algorithm. We will advise all of our user when this updated version is available. Currentely this experimental version is only available to our unlimited members.
Access this Genie indicator for your Tradingview account, through our web site. (Links Below) This will provide you with additional educational information and reference articles, videos, input and setting options and trading strategies this indicator excels in.

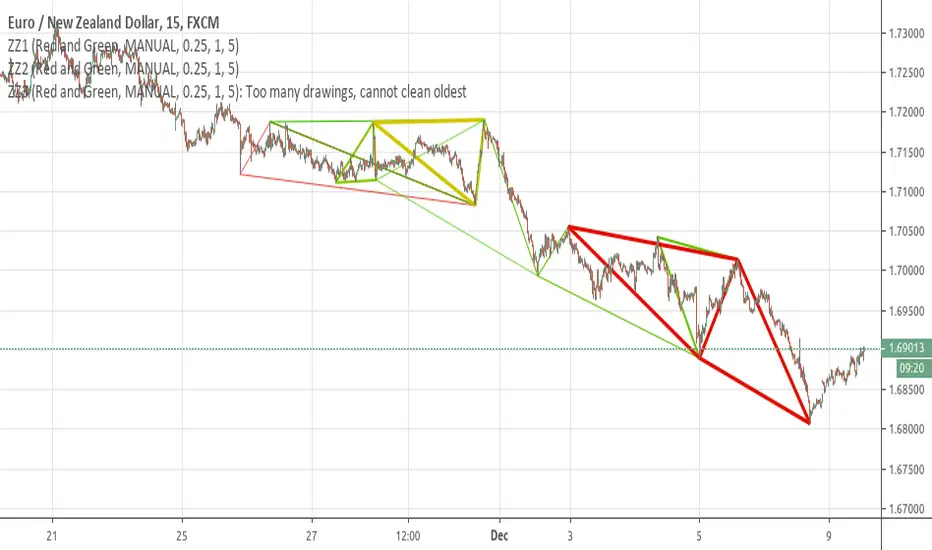
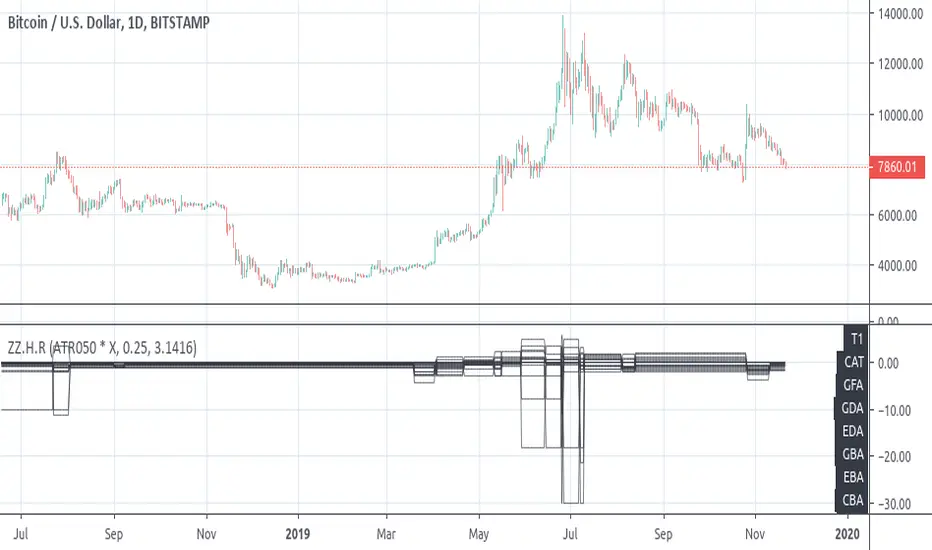
[RS]ZigZag Percent Reversal - Helper - Draw Patterns - Part 3Helper script to draw patterns on chart.
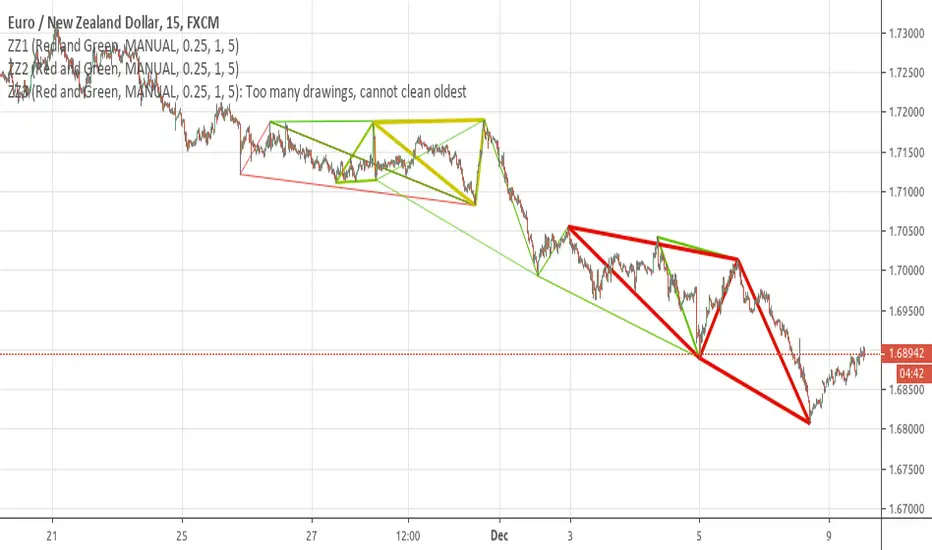
[RS]ZigZag Percent Reversal - Helper - Draw Patterns - Part 2Helper script to display patterns on chart.

[RS]ZigZag Percent Reversal - Helper - Draw Patterns - Part 1Helper script to display patterns on chart.

[RS]Plot in 3DEXPERIMENTAL:
plotting price,time,volume + additional price shift from moving average.

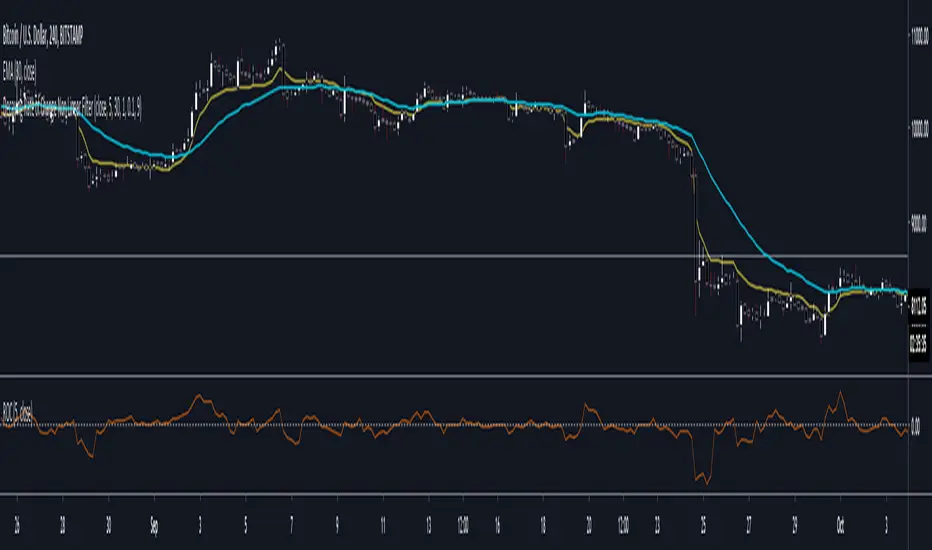
Decaying Rate of Change Non Linear FilterThis is a potential solution to dealing with the inherent lag in most filters especially with instruments such as BTC and the effects of long periods of low volatility followed by massive volatility spikes as well as whipsaws/barts etc.
We can try and solve these issues in a number of ways, adaptive lengths, dynamic weighting etc. This filter uses a non linear weighting combined with an exponential decay rate.
With the non linear weighting the filter can become very responsive to sudden volatility spikes. We can use a short length absolute rate of change as a method to improve weighting of relative high volatility.
c1 = abs(close - close ) / close
Which gives us a fairly simple filter :
filter = sum(c1 * close,periods) / sum(c1,periods)
At this point if we want to control the relative magnitude of the ROC coefficients we can do so by raising it to a power.
c2 = pow(c1, x)
Where x approaches zero the coefficient approaches 1 or a linear filter. At x = 1 we have an unmodified coefficient and higher values increase the relative magnitude of the response. As an extreme example with x = 10 we effectively isolate the highest ROC candle within the window (which has some novel support resistance horizontals as those closes are often important). This controls the degree of responsiveness, so we can magnify the responsiveness, but with the trade off of overshoot/persistence.
So now we have the problem whereby that a highly weighted data point from a high volatility event persists within the filter window. And to a possibly extreme degree, if a reversal occurs we get a potentially large "overshoot" and in a way actually induced a large amount of lag for future price action.
This filter compensates for this effect by exponentially decaying the abs(ROC) coefficient over time, so as a high volatility event passes through the filter window it receives exponentially less weighting allowing more recent prices to receive a higher relative weighting than they would have.
c3 = c2 * pow(1 - percent_decay, periods_back)
This is somewhat similar to an EMA, however with an EMA being recursive that event will persist forever (to some degree) in the calculation. Here we are using a fixed window, so once the event is behind the window it's completely removed from the calculation
I've added Ehler's Super Smoother as an optional smoothing function as some highly non linear settings benefit from smoothing. I can't remember where I got the original SS code snippet, so if you recognize it as yours msg me and I'll link you here.
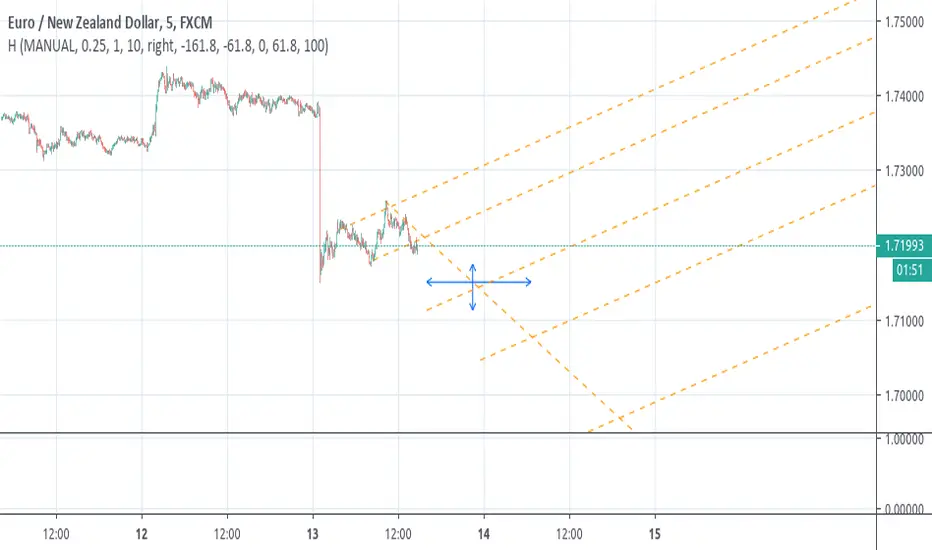
[RS][V4]ZigZag Percent Reversal - Helper - AntiSlopeEXPERIMENTAL:
A helper script to map the Anti derivative slopes.
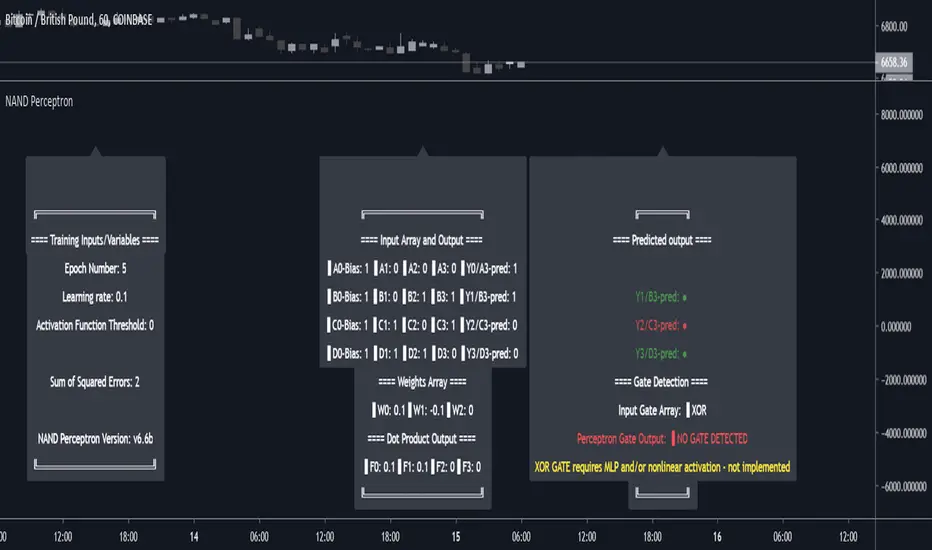
NAND PerceptronExperimental NAND Perceptron based upon Python template that aims to predict NAND Gate Outputs. A Perceptron is one of the foundational building blocks of nearly all advanced Neural Network layers and models for Algo trading and Machine Learning.
The goal behind this script was threefold:
To prove and demonstrate that an ACTUAL working neural net can be implemented in Pine, even if incomplete.
To pave the way for other traders and coders to iterate on this script and push the boundaries of Tradingview strategies and indicators.
To see if a self-contained neural network component for parameter optimization within Pinescript was hypothetically possible.
NOTE: This is a highly experimental proof of concept - this is NOT a ready-made template to include or integrate into existing strategies and indicators, yet (emphasis YET - neural networks have a lot of potential utility and potential when utilized and implemented properly).
Hardcoded NAND Gate outputs with Bias column (X0):
// NAND Gate + X0 Bias and Y-true
// X0 // X1 // X2 // Y
// 1 // 0 // 0 // 1
// 1 // 0 // 1 // 1
// 1 // 1 // 0 // 1
// 1 // 1 // 1 // 0
Column X0 is bias feature/input
Column X1 and X2 are the NAND Gate
Column Y is the y-true values for the NAND gate
yhat is the prediction at that timestep
F0,F1,F2,F3 are the Dot products of the Weights (W0,W1,W2) and the input features (X0,X1,X2)
Learning rate and activation function threshold are enabled by default as input parameters
Uncomment sections for more training iterations/epochs:
Loop optimizations would be amazing to have for a selectable length for training iterations/epochs but I'm not sure if it's possible in Pine with how this script is structured.
Error metrics and loss have not been implemented due to difficulty with script length and iterations vs epochs - I haven't been able to configure the input parameters to successfully predict the right values for all four y-true values for the NAND gate (only been able to get 3/4; If you're able to get all four predictions to be correct, let me know, please).
// //---- REFERENCE for final output
// A3 := 1, y0 true
// B3 := 1, y1 true
// C3 := 1, y2 true
// D3 := 0, y3 true
PLEASE READ: Source article/template and main code reference:
towardsdatascience.com
towardsdatascience.com
towardsdatascience.com
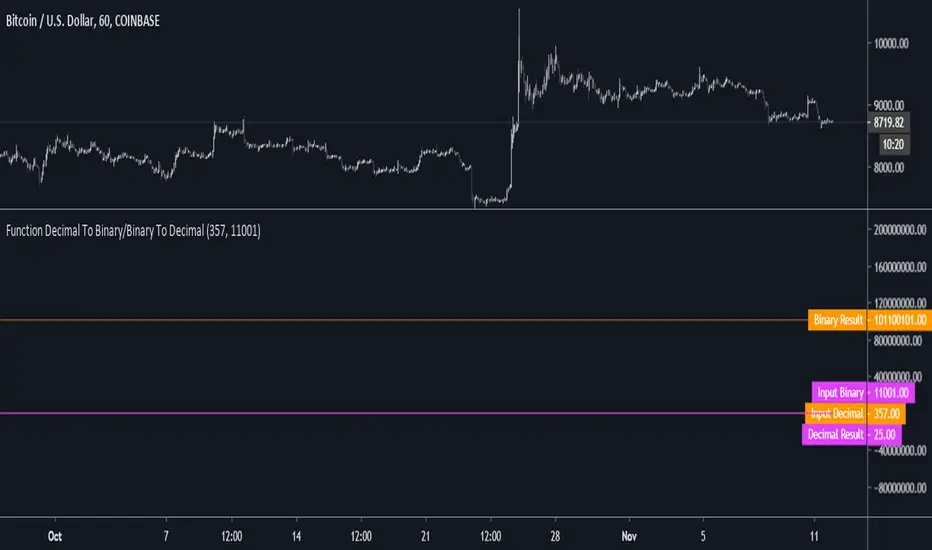
Function Decimal To Binary/Binary To DecimalNOTE: Experimental. Pinescript implementation of Decimal to Binary and Binary to Decimal that is intended for use in the development of a neural network proof of concept.
Intended for use in as subcomponent in the development of a more complex/highly experimental prototype.
Protection/logic for edge cases above 11111111/255 (8bits) is NOT implemented.
Do NOT use this in any trading system or component without edge case testing/unit tests.
// Decimal to Binary, Binary to Decimal Reference:
// diwasfamily.com
// www.wikihow.com
//
// www.khanacademy.org
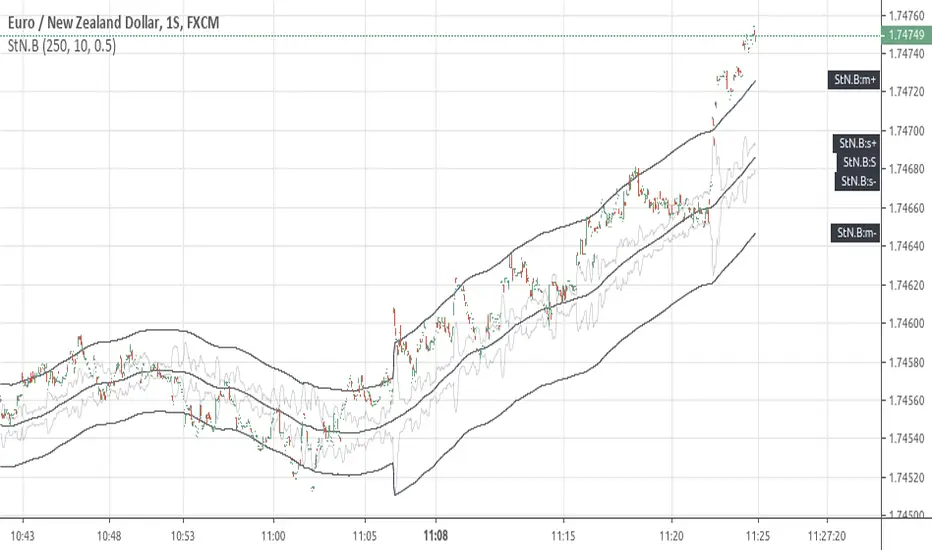
[RS]Signal to Noise BandsEXPERIMENTAL:
Bands using Signal to Noise Calculation.
The bands calculation is similar to bolingers in the aspect that both use standard deviation.
MTF IQ IFM Moving AverageMTF ready adaptive MA using Ehler's IQ IFM ( In Phase - Quadrature Instantaneous Frequency Measurement ).
Ehler's formula is a method of quantitatively measuring the length of a market cycle. In this case it is used to calculate the "optimal" adaptive EMA.
Theoretically the length generated by Ehler's formula could be used in many indicators and it's been placed within it's own function so you should be able to simply copy/paste it. HOWEVER pine will not accept series variables for the length input used in built-in functions. You will have to manually code (or find) a version of your indicator that doesn't use the pine built in.
Options :
type : optionally add volume weighting
range : historical range used in IQ IFM
cycle length mult : method to create faster/slower MAs. eg 0.5 is half the length of a cycle and a faster EMA ie EMA10 vs EMA20
low sat fix : some cryptocurrencies with low satoshi values cause an issue with the calculation, if you get no/nonsensical lines, enable this. Shouldn't affect other instruments, but can be disabled just in case.
MTF options: run the calculation on an alternative timeframe
--------------------------------------
If you find it useful please consider a tip/donation :
BTC - 3BMEXEDyWJ58eXUEALYPadbn1wwWKmf6sA

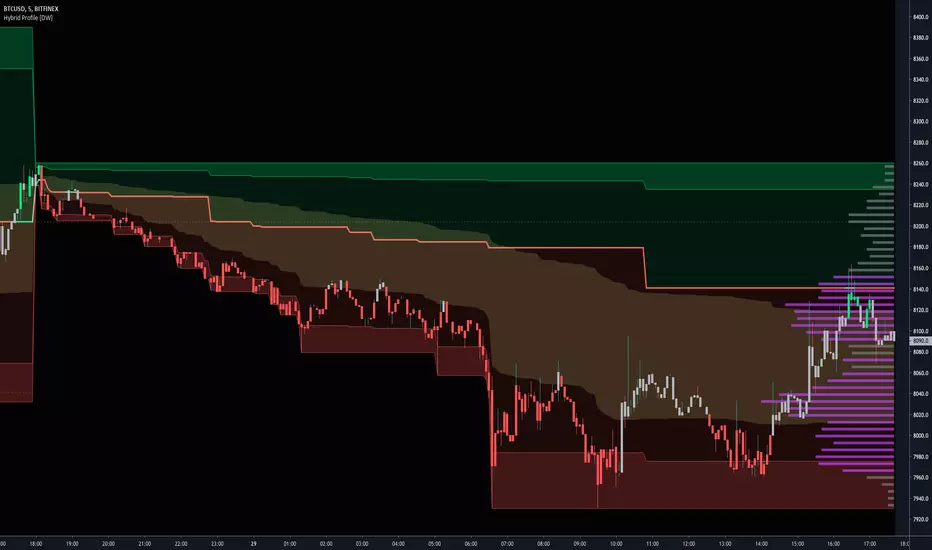
Hybrid Profile [DW]This is an experimental study inspired by J. Peter Steidlmayer's Market Profile tool with an alternative set of calculations for analyzing price action and distribution over a defined interval.
This tool is geared toward finding price reactive points for better entry and exit positions.
In this script, price range over a user defined interval (up to 4000 bars) is divided into 50 sections, then TPOs are counted for each section to generate the distribution histogram. Histogram lines are calculated in real time, and recalculate on each new bar.
Areas of significance are displayed as purple lines in the histogram, making it incredibly simple to identify levels that price will likely react to. The significance sensitivity can be manually adjusted for desired output.
Rather than using POC, I created a series of proprietary calculations to generate what I call the Point Of Focus (POF). This line is similar to POC, but does not always follow the highest count in the distribution.
The POF is designed to experience less whipsaws than POC, which makes trading using the POF much simpler since its value is more consistent. On historical data, price has shown to either revert to or launch from the POF rather frequently.
Unlike a conventional Market Profile, this profile doesn't have a "value area". Instead it has a Mean Value Zone, which is calculated using a series of custom VWAP calculations. The output is similar to VA, but much smoother.
This script has a built in tick volume substitution for charts with no real volume data, making all elements of the script compatible with any cryptocurrency, stock, currency pair, or index you want to analyze.
A bar color scheme is included within this script which can be used to help determine dominant trend and local extremes of the interval.
This tool is not necessarily better or worse than the classic Market Profile, nor is it a replacement for Volume Profile.
However, this is a powerful alternative that can both simplify and improve your technical analysis.
Silicone Re-calibrate ATRInspired by @bitmexstorm study Volatility-calibrated ATR
This study features two different ATR trail derivative concepts-Default one is called- "Silicone", and the alternative is called- "Mercurial. To decrease confusion during backtesting, trails plots with distinct color palette.
Options include the ability to apply a smoothening filter that affects both modes as well as an adaptive/fixed mode for the "Silicone" trail.
Parameters for trail dynamics/behavior is unlocked(!Parameters in publish version is far from optimized! Need serious testing! )
Candle Coloring reflects trail direction.
Feedback on optimal periods and multipliers is needed and appreciated

[RS]Select Sample Average Convergence DivergenceEXPERIMENTAL:
Uses a selective sample average to reflect momentum on volatility range.

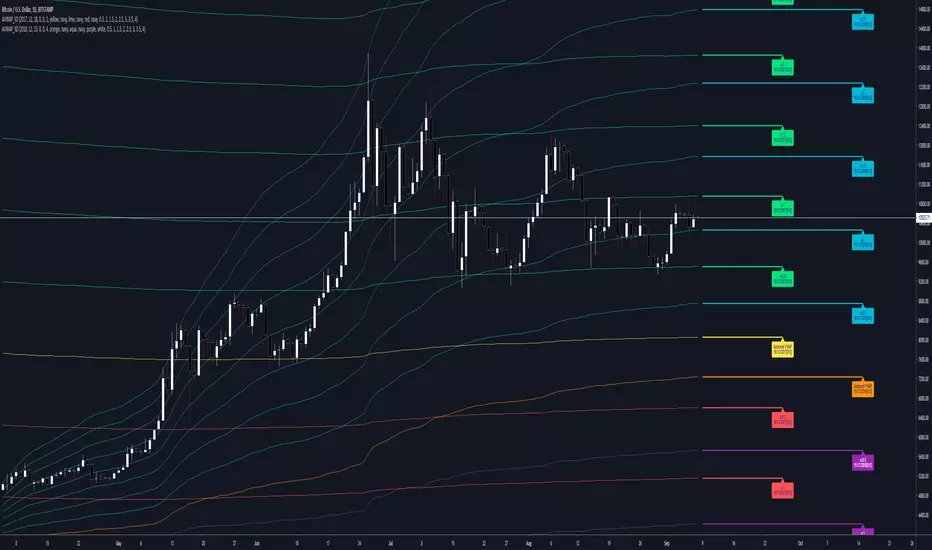
Anchored VWAP & Standard DeviationsCalculates VWAP from a fixed point in time as well as standard deviations.
--------------------------------------
If you find it useful please consider a tip/donation :
BTC - 3BMEXEDyWJ58eXUEALYPadbn1wwWKmf6sA
--------------------------------------
All Time VWAP & Standard DeviationsAll time VWAP and standard deviations.
Either enable "scale price chart only" or disable deviations that go negative in the style options.
--------------------------------------
If you find it useful please consider a tip/donation :
BTC - 3BMEXEDyWJ58eXUEALYPadbn1wwWKmf6sA
--------------------------------------


RSI on the chart [Experimental]This is an experimental work to show RSI on the chart. Feel free to use the code and indicator.
If you find my works useful, please consider a donation
BTC: 19qDW9AShZhBZsGuXcgRzam5Fbpc3EU8EV
ETH: 0x39c8552371b9b7f4e324197af460ba8bc8e18ef9
