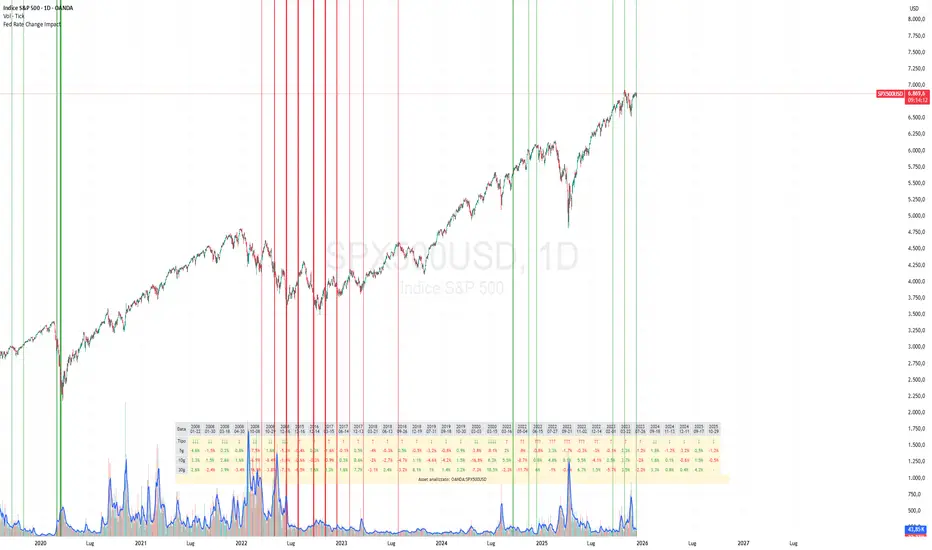
Fed Rate Change Impact📊 Fed Rate Change Impact — Macro Event-Driven Indicator
Fed Rate Change Impact is an advanced indicator designed to analyze the impact of Federal Reserve interest rate changes on financial markets. It integrates event-driven logic with dynamic visualization, percentage diagnostics, and multi-asset selection, offering a clear and customizable view of post-event effects.
🔍 Key Features 📅 Preloaded Fed Events : Includes over 30 historical rate cut (↓) and hike (↑) dates from 2008 to 2024.
📈 Post-Event Analysis : Calculates the percentage change of the selected asset 5, 10, and 30 days after each event.
📌 Vertical Chart Lines : Visually highlights each event directly on the chart, with dynamic coloring (red for hikes, green for cuts).
📋 Diagnostic Table : Displays real-time impact for each event, with color-coded values and a compact layout.
🧠 Interactive Filter: Choose to display only hikes, only cuts, or both.
🧭 Flexible Asset Selection : Analyze the current chart asset, pick from a predefined list, or manually input any ticker via input.symbol().
🎯 Contextual Highlighting : The table highlights the analyzed asset if it matches the active chart symbol.
⚙️ Customizable Parameters lookahead5, lookahead10, lookahead30: Define the time horizon for measuring post-event impact.
eventFilter : Choose which type of events to display.
presetAsset / customAsset : Select or input the asset to analyze.
🧪 Recommended Use Cases Macroeconomic analysis on indices, commodities, crypto, and forex
Studying delayed effects of rate changes on sensitive assets
Building event-driven strategies or diagnostic overlays
Visual backtesting and cross-asset comparison
🧠 Technical Notes The indicator is compatible with overlay=true and works best on Daily timeframe.
The table automatically adapts to the number of events and includes visual padding for improved readability.
All calculations are performed in real time and require no external data.
Federalbank
[Daveatt] BEST Quandl Federal Reserve Economic Dashboard 1.0Hello traders
I hope you're all doing well and the quarantine will soon be over in your respective countries.
We all have strong opinions on how it could have been handled by our respective governments but the facts cannot be contested.
And basically, they acted based on a lot of unknown data. Obviously, we can throw away some conspiracy theories but what's the point really?
Conspiracy theorists never ever ever ever made money - Permabulls did historically.
Fight only for what you can change, in other words, YOURSELF. Those 2 months were tremendous for me to adapt, learn, and pivot my different businesses.
I believe that humans are wired to one thing - transform themselves. You'll never be able to change our governments, the banks, the FED printing money (making it the dollar less and less valuable)
Transforming yourself and your life is the only (and the most powerful) hedge you have
Yes, you didn't ask for it, this is not fair. Life is not fair. Only YOU can make it fair for yourself
That's why I stopped listening to the media, social media and all the news related to COVID
Context
I wanted to play with the new Quandl utility function provided by TradingView
With this dashboard, I tried to build a Quandl dashboard based on the Federal Reserve Economic Data data
I pulled out a few metrics from this Quandl page: www.quandl.com
"Federal Reserve Economic Data" or FRED is a project by the Economic Research Department of the Federal Reserve Bank of St Louis.
FRED collects over 200,000 US and international economic time series, from 69 different sources, on a single website. Data coverage includes all major areas of macroeconomic analysis: growth, inflation, employment, interest rates, exchange rates, production and consumption, income and expenditure, savings and investment, and more.
What can you do with the indicator
First, kudos to Pinecoders . I used his color scale and f_print functions to display those labels at the right.
Script Reference:
You can change from the indicator settings:
- Labels horizontal position
- Labels size (tiny, normal, big, huge)
- Labels colors
Final words
Tough times are ahead as we can see from those numbers.
For those having an online business, it's a fantastic period despite the terrible events. Use it at your advantage to learn and share your vibes and knowledge with your audience
Stay brave,
Dave