Dynamic Fib Zones [By TraderMan]📊 Dynamic Fib Zones — Indicator Overview
This indicator automatically plots dynamic Fibonacci levels and zones on your chart based on recent price action, volume, and trend direction. It helps you identify key support and resistance areas where price may react strongly.
🔍 What Does It Do?
Draws Fibonacci retracement levels dynamically over a specified lookback period.
Highlights zones around these Fibonacci levels to give you a price “buffer area” instead of just a line.
Colors the zones green or red based on volume strength and trend direction to signal potential buying or selling pressure.
Uses EMA (Exponential Moving Average) to detect if the trend is up or down.
Shows labels with Fibonacci % levels and exact price for quick reference.
⚙️ How to Use It?
Set your inputs:
Fibonacci Period: How many bars back the Fibonacci levels are calculated.
EMA Period: For trend detection.
Volume Multiplier: How much volume should exceed average to consider the signal strong.
Level Tolerance and Zone Width: Adjust the sensitivity and size of the price zones.
Interpret zones:
Green zones with high volume and price near Fibonacci level in an uptrend = potential buying area.
Red zones with high volume and price near Fibonacci level in a downtrend = potential selling area.
Gray zones = neutral, no strong signal.
Make your trading decisions:
Consider entering long positions near green zones with confirmation from other indicators or price action.
Consider entering short positions near red zones similarly.
Use zone boundaries as dynamic support/resistance for stop loss or take profit placement.
🚀 Tips for Position Opening
Combine with other confirmation tools (candlestick patterns, RSI, MACD, etc.) to avoid false signals.
Watch volume spikes carefully; strong volume near a Fibonacci zone increases the reliability.
Use the EMA trend filter to avoid trading against the main trend.
🎯 Summary
Dynamic Fib Zones give you a powerful, visual edge by combining Fibonacci, volume, and trend signals — making your entries and exits smarter and more precise!
Happy Trading! 📈✨
Fibonaccitimezone

ZigZag++ FibonacciAuto Fibonacci tools are powerful ways designed to simplify your technical analysis by automatically drawing Fibonacci retracement and extension levels on your chart. This indicator is built to enhance your trading experience with clearer market moves and informative insights.
You can easily spot your waves and patterns when the percentages are moving with you.
Key Features:
Automated Fibonacci Levels: Plots Fibonacci retracement and extension levels based on recent price movements.
Multi-Timeframe Support: This indicator is your versatile companion, offering multi-timeframe functionality. You can seamlessly track Fibonacci levels across different resolutions, providing a comprehensive view of the market.
Two Types of Fibs: Retracement and Timeframe extension Fibonacci levels. Use retracements to identify potential reversal points and extensions to anticipate price targets, giving you a well-rounded perspective on market movements.
Benefits:
Save Time: No more manual Fibonacci drawing; It does this for you in real-time.
Enhanced Analysis: Gain a deeper understanding of potential support, resistance, and price targets.
User-Friendly: Suitable for traders of all levels, this indicator simplifies complex technical analysis.
For the math lovers
I started creating the ZigZag++ based on the MT4 calculation as I found it better performing than the tradingview inbuilt one. I have revised the calculation couple of times and now the final calculation is simple yet more accurate for my analysis.
First, I observe the market direction for the last Depth setting by comparing the rate at which high values reduce and low values increase. When the number of ticks set by Deviation is crossed and the last cross is more than the Backstep candles, then we have our ZigZag points.
These are the points we use in our Fibonacci calculation.
Checkout ZigLib below to use the same logic in your scripts.
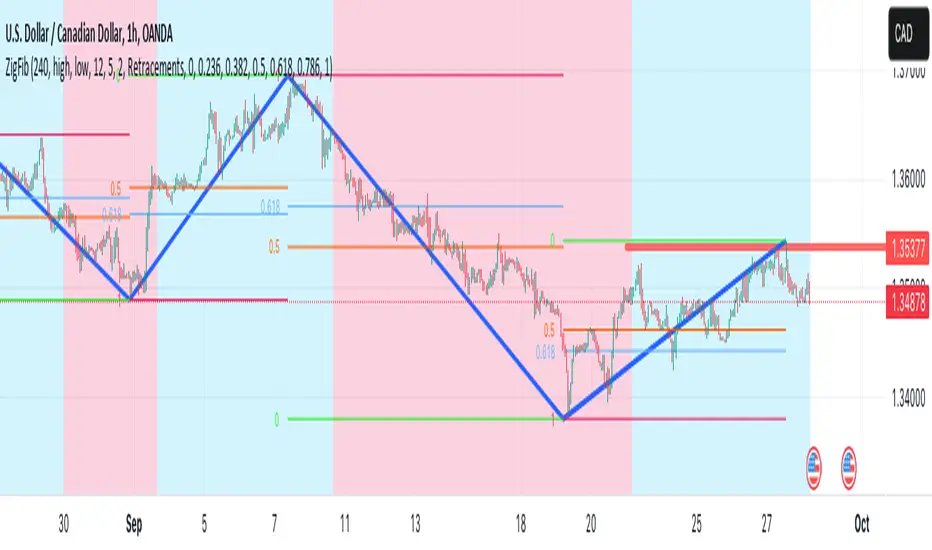
Sample usage
This is a 4 Hour configuration with the default settings.
When the trend reversed, some key points I watch are 0.618 and 0.5. The market retraced back and formed the new point for the next ZigZag line on that level. This market behaviour happens quite often on these Fibonacci points. I would be looking for reversal or a break in this zone to know the next step.
Resources
ZigZag++ Lib by me; for retrieving the line points.
Fibonacci Toolkit by Lux Algo; For drawing the Timeframe Fibs. Very Amazing script.
Auto Fibonacci ComboA combination of Fibonacci indicators including:
1- Moving Auto-calculated Fibo Retracement Levels
2- Dynamic Auto-calculated Fibo Extension Levels
3- Adjustable Auto-calculated Fibo Time Zones
4- ّFlexible Fibo Moving Averages Ribbon
The ribbon consists of 10 moving averages of selected source for different Fibonacci numbers count of bars which could be colorized for a better trend observation. Also the type of the moving averages could be picked up from 6 different types which are:
- SMA (Simple Moving Average)
- EMA (Exponential Moving Average)
- HMA (Hull Moving Average)
- LSMA (Least Squares Moving Average)
- TMA (Triangular Moving Average)
- MAEMA (My Personalized Momentum Adjusted EMA)
I think the latter one makes a nice conjunction with Fibonacci retracements.
Feel free to test the set and send me your thoughts.

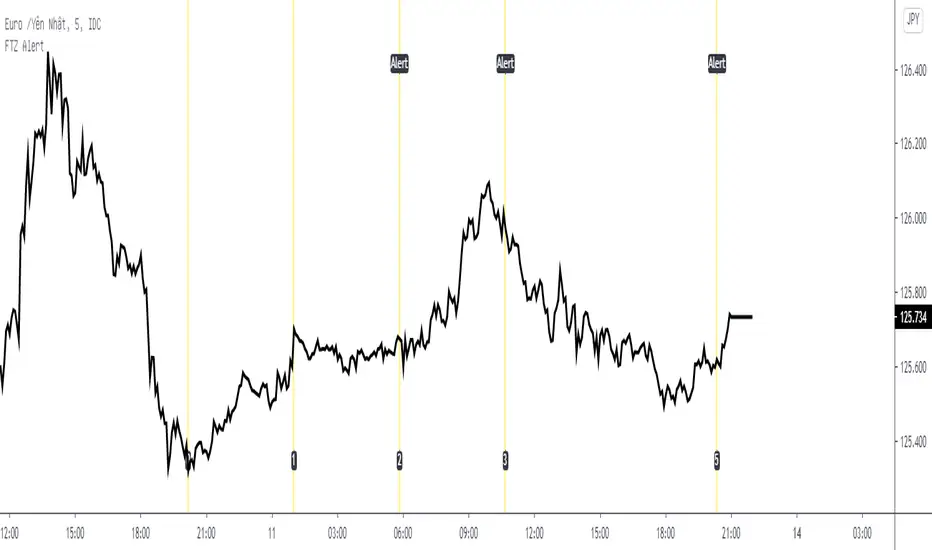
Fib Time Zone with Alert* Fib Time Zone with Alert will draw a series of vertical lines on chart. They are spaced at the Fibonacci intervals of 1, 2, 3, 5, 8, 13, 21, 34, 55 and 89. Trader defined the zero line and the 1 line, then Fib Time Zone with Alert auto draw the rest and display alert when price touch the line.
* Alert condition available in the Create Alert dialog box with title "Fib Time Zone Alert".
* Line 0 was defined by Date, Month, Year, Hour, Minute (use Exchange Timezone).
* Line 1 was defined by number of bars between Line 0 and Line 1.
* Line 2,3,5,8,13,21,34,55 and 89 auto draw.