Fractal Support and Resistance [BigBeluga]🔵 OVERVIEW
The Fractal Support and Resistance indicator automatically identifies high-probability support and resistance zones based on repeated fractal touches. When a defined number of fractal highs or lows cluster around the same price zone, the indicator plots a clean horizontal level and shaded zone, helping traders visualize structurally important areas where price may react.
🔵 CONCEPTS
Fractal Points: Swing highs and lows based on user-defined left and right range (length). A valid fractal forms only when the center candle is higher or lower than its neighbors.
Zone Validation: A level is only confirmed when the price has printed the specified number of fractals (e.g., 3) within a narrow ATR-defined range.
Dynamic Zone Calculation: The plotted level can be based on the average of clustered fractals or on the extreme value (min or max), depending on the user’s choice.
Support/Resistance Zones: Once a zone is validated, a horizontal line and shaded box are drawn and automatically extended into the future until new valid clusters form.
Auto-Clean & Reactivity: Each zone persists until replaced by a new fractal cluster, ensuring the chart remains uncluttered and adaptive.
🔵 FEATURES
Detects swing fractals using adjustable left/right range.
Confirms zones when a defined number of fractals occur near the same price.
Plots horizontal level and shaded box for visual clarity.
Choice between average or min/max logic for level calculation.
Distinct color inputs for support (green) and resistance (orange) zones.
Adaptive auto-extension keeps valid zones projected into the future.
Displays optional triangle markers above/below bars where fractals form.
Clean design optimized for structural S/R analysis.
🔵 HOW TO USE
Use support zones (from low fractals) to look for potential long entries or bounce points .
Use resistance zones (from high fractals) to look for short setups or rejections .
Adjust the Fractals Qty to make zones more or less strict—e.g., 3 for higher reliability, 2 for quicker responsiveness.
Combine with liquidity indicators or break/retest logic to validate zone strength.
Toggle between average and min/max mode to fit your style (average for balance, extremes for aggression).
🔵 CONCLUSION
Fractal Support and Resistance offers a robust way to identify hidden levels that the market respects repeatedly. By requiring multiple fractal confirmations within a zone, it filters out noise and highlights clean structural areas of interest. This tool is ideal for traders who want automatic, adaptive, and reliable S/R levels grounded in raw market structure.
Fractalswing

MTF Fractal Bias Confluence DetectorMTF Fractal Bias Confluence Detector
This indicator, the MTF Fractal Bias Confluence Detector, is based on the idea that the market exhibits fractal behaviour. The origin of the idea traces back to 1963, when Benoit Mandelbrot analyzed the fluctuations in cotton prices over a time series starting in 1900, discovering that price changes exhibited scale-invariant patterns. This means that the curve representing daily price changes mirrored the shape of monthly price changes, highlighting the fractal nature of market behaviour. When applied to swing points across multiple timeframes (MTF), this concept suggests that swing points demonstrate similar patterns regardless of the timeframe being analyzed. These self-similar fractal structures provide traders with insights into market reversals and trends, making them a powerful tool for multi-timeframe analysis.
A Swing Point is made up of three main parts: a move away from the last Break level; forming a peak (pivot point) with a Fakeout of the peak (explained through an example later); and a subsequent move away from it. These swing points recur across all timeframes as part of cyclical momentum patterns, meaning each swing point gives rise to a new cycle of market movement. Due to the fractal nature of the market, larger cycles encompass multiple smaller ones.
The theory behind the Fractal Bias Confluence Detector utilizes the idea that the market movements are fractal in nature and illustrates how such swing points can be identified across MTFs. To do so, we examine the Peak Fakeouts within these cycles, as they form. It is not possible to know in advance how long each of these moves will last, but a Swing Point will often occur with a Peak Fakeout. Therefore, the most critical element is to identify the Peak Fakeout.
The snapshot below captures a Peak Fakeout, as discussed earlier.
Similarly, the following snapshot shows various possible breakdowns of Higher Time Frame (HTF) cycles into smaller Lower Time Frame (LTF) movements. The chart contains a white table(not part of the indicator and shown for illustration purposes only).
To further illustrate. Consider the combination of Time Frames (TF) from the 2nd row (from the above snapshot). Cycle TF (1M), Setup TF (1W), Momentum TF (1D) etc.
Price movements in the 1M TF highlight the direction in which HTF traders are pushing the market. Often, when markets have broken out of a level, they tend to form a peak and can then pull back towards the prior breakout level. Once the pullback is beyond the last breakout level, in the opposite direction, we may say the peak formation is created, and directional bias has changed. This is also called Peak Fakeout. Due to the fractal nature of the market, Swing Points on the HTF will often constitute multiple Swing Points on the LTF, though they are not always in sync. However, after such peak formation, there is a high probability that the price might move away from the peak for at least 1 candle (in the cycle TF). This theory illustrates that once a new cycle is in play, we can then look at 1W (Setup TF) to look for possible in-sync movements, at least within that 1 candle of the HTF. Repeating the same for further lower TFs, we may arrive at a confluence of Fractal Bias and see how the movements in LTF are driven by the HTF momentum.
Another example within the chart:
Note: The above examples are just for illustration purposes, and other permutations and combinations of movements across multiple TFs are also possible.
This indicator aims to help users identify such fractal-bias-confluences, so that they can leverage the fractal nature of the market to get a holistic view. To do so, the indicator displays how the market has moved across multiple time frames, with respect to different historical levels.
Features:
1. The bias summary table
The following snapshot depicts the bias summary table at the bottom right of the chart.
1.1. Workings: The table will display, for various TFs, in the first four (starting from "current" to Prev ) rows, one of the following.
"F/H" , " Acronym for the failed break of the previous high",
"F/L" , " Acronym for the failed break of the previous low",
"B/H" , " Acronym for the break of the previous high",
"B/L" , " Acronym for the break of the previous low",
"IN" , " Acronym for an inside candle (never broke high or low of perv candle)",
"OT" , " Acronym for an outside candle (broke both high and low of previous candle and closing price is in between previous high and low)".
Note: these acronyms are customizable according to the user's choice of terminology in any language, as shown in the snapshot below.
1.1.1 In the above snapshot, the 1st row, called "Current", shows how the current candle is evolving with respect to the previous one. The "previous" row shows how the previous candle closed with respect to the pre-previous one. The next two rows represent the bias of the pre-previous and pre-pre-previous in a similar manner. By default, the bias is updated in real-time, even for the already closed historical candles. For example, if the previous 4H candle closed as a B/H and the current price then comes below the pre-previous 4H candle high, then the bias of the previous candle will get updated to F/H. This informs the user that the break above the pre-previous high has failed. However, the user has the option to turn this off. The information in these four rows shows the user how the market is moving currently and how it evolved before reaching the current price levels.
Note: The calculation done by the indicator is to keep track of how the price is moving with respect to the last candle levels in real-time. This means if the price first goes above the previous high and then goes below the previous low, the indicator is equipped to display what happened in the most recent time. The snapshot below shows the option to turn on/off such updates in the bias summary table.
Note: While the bias summary table is turned on, the user also has the option to turn off Prev and Prev rows, as shown in the snapshot below.
1.1.2 The 2nd to last row, called CL/CS(Consecutive Long/Short), shows whether consecutive (2+) breaks of high/low happened or not in one direction without taking out the previous candle's range in the opposite direction. When conditions are met, it will show the number of times the price has been pushed in one direction (in the above manner), followed by "L" for long and "S" for short, for each TF, for example, "4L". It gets updated in real-time for each push in the same direction. Furthermore, a good analogy of "4L" on an HTF is 4 consecutive Break of Structure (BOS) (in the same direction) on LTF, without a Change of Character (CHoCH). Another example would be Stacey Burke's 3 consecutive rises that can be mapped in the indicator, if the conditions are met for "3L" for a given TF.
1.1.3 The last row, FRC/FGC, stands for the first red/green candle. It shows whether the last candle of a TF has closed as green (i.e., close>open) after posting two red candles (i.e., close

Correct Fractal Swings by CRYPTOFORThis indicator adjusts and enhances the normal 3-fractal swing. The author of this definition, uncle_travis, takes into account swings with the absorption of 3 candles and uses them as structure points.

Swing PointsEnglish:
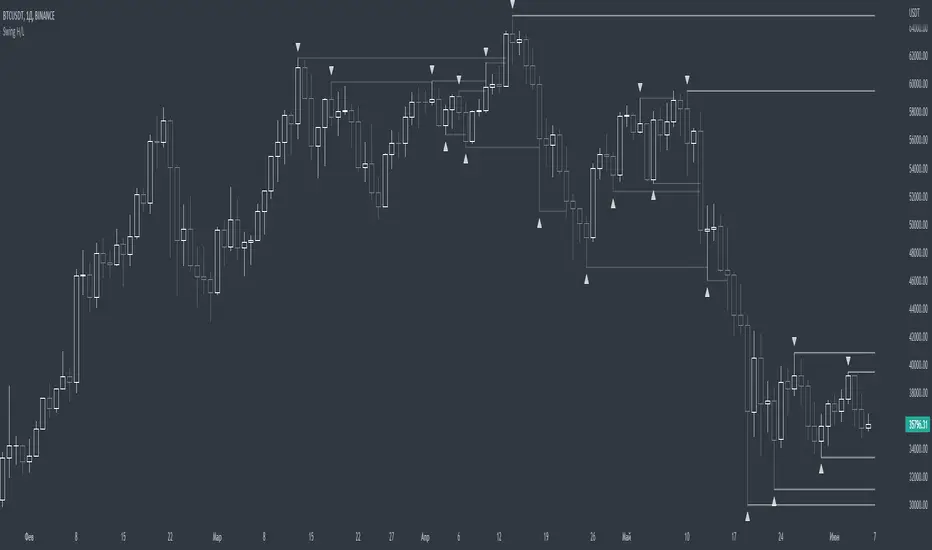
The indicator shows the fractals where stop-losses may be located and can be used to trade from their taking.
You can adjust the length of the fractal (the number of bars with which it is surrounded on both sides, to confirm the validity).
You can also display lines from fractal points for clarity.
To keep the chart clean, you can enable deletion of already taken fractals.
Example of use with deleted fractals and without lines:
Русский:
Индикатор показывает фракталы где могут находиться стоп-лоссы и его можно использовать для торговли от их снятия.
Можно настраивать длину фрактала (количество баров, которыми он окружен с обеих сторон, для подтверждения валидности).
Так же можно выводить линии от фрактальных точек для наглядности.
Для сохранения чистоты графика можно включить удаление уже снятых фракталов.
Пример использования с удалением снятых фракталов и без линий:
Fractals (Expo)
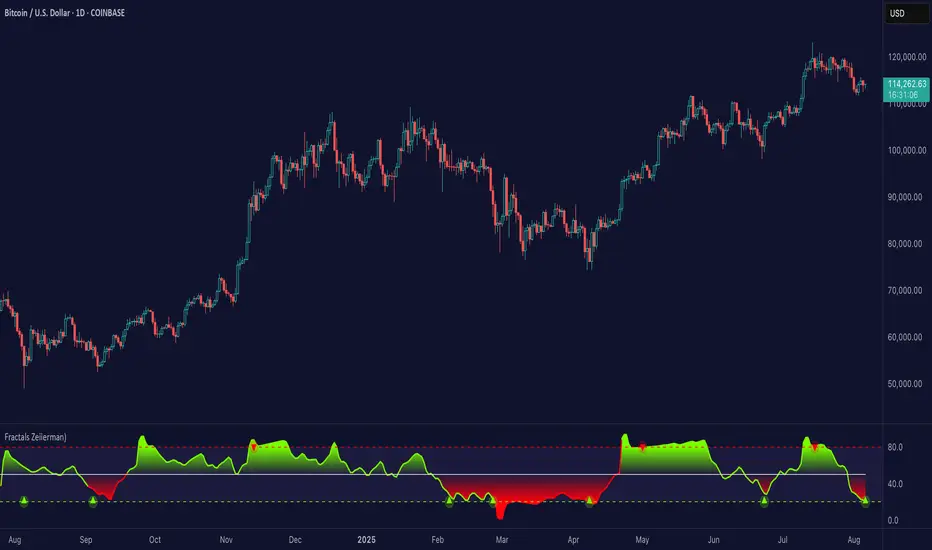
Fractals (Expo) make use of fractals to identify trends and reversals. The indicator is designed to adapt smoothly and quickly to significant price moves in order to identify trend reversals as well as filtering out noise in an established trend. The indicator is simple to use and understand therefore valuable to all trading styles.
The user has the ability to enable a custom input source which gives the user great flexibility and full control over what the calculations should be based on. The default input source is fractals from the swing points of the market.
Real-Time Trend Alerts
No Repainting
Works on any market and in any timeframe
HOW TO USE
Use the indicator to gain insights into trends and trend reversals.
Identify Trends
Identify Trend reversals
Use it as a Trend filter
INDICATOR IN ACTION
Daily Chart
I hope you find this indicator useful , and please comment or contact me if you like the script or have any questions/suggestions for future improvements. Thanks!
I will continually work on this indicator, so please share your experience and feedback as it will enable me to make even better improvements. Thanks to everyone that has already contacted me regarding my scripts. Your feedback is valuable for future developments!
-----------------
Disclaimer
Copyright by Zeiierman.
The information contained in my scripts/indicators/ideas does not constitute financial advice or a solicitation to buy or sell any securities of any type. I will not accept liability for any loss or damage, including without limitation any loss of profit, which may arise directly or indirectly from the use of or reliance on such information.
All investments involve risk, and the past performance of a security, industry, sector, market, financial product, trading strategy, or individual’s trading does not guarantee future results or returns. Investors are fully responsible for any investment decisions they make. Such decisions should be based solely on an evaluation of their financial circumstances, investment objectives, risk tolerance, and liquidity needs.
My scripts/indicators/strategies/ideas are only for educational purposes!
ACCESS THE INDICATOR
• Contact me on TradingView or use the links below
Nandy -Quantified Swing Highs & Lows v.2Uses 3 bar fractals ( Bill Williams - Trading Chaos) and differential standard deviation bands to quantify swing highs and swing lows
