Predicta Futures – Scalping Predictor with Confidence FilterPredicta Futures is an advanced short-term forecasting indicator that combines historical pattern similarity analysis with weighted technical signals to predict price movements 1–10 minutes ahead.
**Core Functionality**
The script scans up to 5,000 historical bars to identify structurally similar price patterns. It aggregates forward outcomes from matched patterns and integrates real-time signals from RSI, MACD, Bollinger Bands, volume momentum, and volatility. A composite confidence score filters signals, displaying only those meeting the user-defined threshold (default ≥68%).
**Key Outputs**
- Buy/sell triangles with text labels
- Dashed projection line to predicted price
- Dotted target and ATR-based stop lines
- Info panel showing forecast direction, confidence %, expected move %, pattern count, order book status, and data access details
**Customization & Performance**
- Execution modes: Fast, Balanced, Accurate
- Adaptive sampling with recency bias option
- Filters for volatility and market hours
- Adjustable weights, lookback period, and prediction horizon
**Use Cases**
Scalping, intraday trading, futures, cryptocurrencies, equities.
*Order book metrics are simulated (platform limitation). Technical analysis tool; not financial advice.*
Futures

Pulsar Trading System-LITE📡 Pulsar Trading System
OVERVIEW
Pulsar is a comprehensive breakout trading system that combines dynamic support/resistance detection, trend filtering, and volume confirmation to identify high-probability entry opportunities. Unlike simple breakout indicators, Pulsar uses multi-timeframe analysis and adaptive ATR-based calculations to filter false signals and provide complete trade management from entry to exit.
WHAT MAKES THIS ORIGINAL
This indicator is unique in its integration of multiple complementary systems:
-Adaptive ATR Zones: Support and resistance levels are not static—they dynamically adjust based on current market volatility (ATR), creating entry zones that expand and contract with market conditions rather than using fixed price levels.
-Multi-Timeframe SuperTrend Filter: The trend filter operates on a higher timeframe than the chart (e.g., 5-minute SuperTrend on a 1-minute chart) to prevent counter-trend trades while maintaining granular entry precision. The visual ribbon with humorous warning text ("🚫 Don't Short - Trend is Your Friend! 📈") provides immediate trend awareness.
-Intelligent Cooldown System: After any trade exit (stop loss or take profit), the system enters a configurable cooldown period, preventing overtrading during choppy or consolidating market conditions—a critical feature often missing in breakout systems.
-Dynamic Trailing Stops: The trailing stop uses ATR multipliers to lock in profits while adapting to volatility, moving only in the favorable direction and never loosening.
-Comprehensive Dashboard: Real-time analysis displays trade status, entry prices, distances to targets in both points and ATR multiples, volume confirmation status, and cooldown countdown.
HOW IT WORKS
Core Detection Logic:
Pulsar identifies breakout opportunities by monitoring price interaction with dynamically calculated support and resistance levels:
Support/Resistance Calculation: Uses ta.lowest() and ta.highest() over a configurable lookback period to identify key levels, then adds ATR-based buffers (0.5 × ATR) to create entry zones.
Breakout Conditions:
Long Entry: Price closes above support buffer AND recent low touched support AND volume exceeds threshold
Short Entry: Price closes below resistance buffer AND recent high touched resistance AND volume exceeds threshold
SuperTrend Filter: A separate higher-timeframe SuperTrend calculation determines overall trend direction. Entries only trigger when breakout direction aligns with SuperTrend (bullish breakout + bullish trend, or bearish breakout + bearish trend).
Volume Confirmation: Current volume must exceed a configurable multiple of the 14-period SMA (default 1.0×) to confirm genuine interest in the breakout.
Cooldown Mechanism: After exit, the system tracks bars elapsed and blocks new signals until the cooldown period completes, preventing rapid-fire entries in ranging markets.
Trade Management:
Stop Loss: Calculated as entry zone ± (ATR × SL Multiplier)
Take Profit 1: Entry zone ± (ATR × TP1 Multiplier)
Take Profit 2: Entry zone ± (ATR × TP2 Multiplier)
Trailing Stop (optional): Updates every bar, moving the stop closer by maintaining distance of (ATR × Trailing Multiplier) from current price, but only in favorable direction
SuperTrend Calculation:
The SuperTrend uses standard methodology:
Upper Band = (High + Low) / 2 + (Multiplier × ATR)
Lower Band = (High + Low) / 2 - (Multiplier × ATR)
Direction changes when price crosses opposite band
The ribbon visualization adds a width offset (ATR × Ribbon Width) to create a filled zone rather than a single line.
HOW TO USE
Setup:
Add Pulsar to your chart (works best on liquid instruments like NQ, ES, CL)
Configure timeframe-specific settings (see recommendations below)
Enable SuperTrend Filter for trend-following mode, or disable for pure breakout mode
Set up alerts for Entry, TP1, TP2, and Stop Loss events
Recommended Settings by Timeframe:
1-Minute Charts:
Lookback Period: 10-15
SuperTrend Timeframe: 5 min
ATR Timeframe: 5 min (for stability)
Cooldown: 8-12 bars
Trailing Stop: Enabled with 0.8-1.0 multiplier
5-Minute Charts:
Lookback Period: 15-20
SuperTrend Timeframe: 15 min
ATR Timeframe: current chart
Cooldown: 5-8 bars
Trailing Stop: Optional
15-Minute+ Charts:
Lookback Period: 20-30
SuperTrend Timeframe: 1 hour
ATR Timeframe: current chart
Cooldown: 3-5 bars
Trailing Stop: Optional
Interpreting Signals:
Long/Short Zone Box: Green (long) or red (short) box appears when breakout conditions are met
Blue Entry Line: Shows your entry price
Red/Orange SL Line: Red = fixed stop, Orange = trailing stop (moves in real-time)
Green TP Lines: TP1 (closer) and TP2 (further) targets
SuperTrend Ribbon: Green = bullish trend (favor longs), Red = bearish trend (favor shorts)
Dashboard Status: Monitor trade state, distances, volume confirmation, and cooldown
Best Practices:
Use SuperTrend Filter: Significantly reduces false signals by avoiding counter-trend trades
Enable Cooldown on Fast Timeframes: Prevents overtrading on 1-5 minute charts
Volume Confirmation is Critical: Don't lower volume multiplier below 0.9 on futures
Use Higher Timeframe ATR: On 1-minute charts, use 5-minute ATR for stability
Avoid Major News Events: Disable during FOMC, NFP, CPI releases
Scale Out Strategy: Consider taking partial profits at TP1, letting remainder run to TP2
Parameter Optimization:
Start conservative and adjust based on results:
Too many stop-outs: Increase SL multiplier or SuperTrend multiplier
Missing good trades: Decrease volume multiplier or cooldown period
Too many false signals: Increase volume multiplier, lookback period, or cooldown
Profits not protected: Enable trailing stop or reduce trailing multiplier
KEY FEATURES
✅ Dynamic ATR-Based Zones: Entry, stop loss, and take profit levels automatically adjust to market volatility
✅ Multi-Timeframe Trend Filter: Uses higher timeframe SuperTrend to eliminate counter-trend trades
✅ Volume Confirmation: Filters low-volume false breakouts
✅ Intelligent Cooldown: Prevents overtrading with configurable post-trade waiting period
✅ Trailing Stop System: Optional dynamic stops that lock in profits using ATR distance
✅ Real-Time Dashboard: 13-row analysis showing trade status, targets, distances, volume, and cooldown
✅ Visual Ribbon Warnings: Humorous trend-following reminders on SuperTrend ribbon
✅ Complete Alert System: Notifications for entries, TP1, TP2, fixed stops, and trailing stops
✅ Customizable Visuals: Adjustable colors, dashboard position, text size, and line lengths
✅ Non-Repainting: Uses lookahead = barmerge.lookahead_off for all multi-timeframe calculations
SETTINGS EXPLAINED
SuperTrend Filter:
Enable: Toggle trend filtering on/off
Timeframe: Higher timeframe for trend analysis (recommended 3-5x chart timeframe)
ATR Period: Period for ATR calculation in SuperTrend (10-14 standard)
Multiplier: Distance from center band (2.5-3.5 for most markets)
Ribbon Width: Visual thickness of trend ribbon (0.2-0.5)
Core Parameters:
Lookback Period: Bars used to identify support/resistance (lower = more sensitive)
ATR Period: Bars for Average True Range calculation (14 is standard)
ATR Timeframe: Use higher timeframe ATR for smoother calculations on fast charts
Volume Multiplier: Required volume vs average (1.0 = average, 1.5 = 50% above average)
TP/SL:
SL Multiplier: Stop loss distance in ATR units (1.0-2.0 typical)
TP1 Multiplier: First target in ATR units (1.5-2.5 typical)
TP2 Multiplier: Second target in ATR units (2.0-3.5 typical)
Trailing Stop:
Enable: Activate dynamic trailing stop
Multiplier: Distance from current price in ATR units (0.8-1.5 typical)
Cooldown:
Enable: Prevent new signals after trade exit
Bars: Number of bars to wait before allowing next trade (higher on fast timeframes)
IMPORTANT NOTES
⚠️ Not a Holy Grail: No indicator is perfect. Pulsar is a tool that requires proper risk management, position sizing, and trading discipline.
⚠️ Backtest First: Test settings on historical data before live trading. Results vary by instrument, timeframe, and market conditions.
⚠️ Market Conditions Matter: Breakout systems perform best in trending markets. Consider reducing size or disabling during known choppy periods.
⚠️ Stop Loss is Mandatory: Always use the provided stop loss levels. Markets can move against you rapidly.
⚠️ Volume Data Required: This indicator requires volume data to function properly. It will display a warning if volume is unavailable.
⚠️ No Repainting: All multi-timeframe calls use non-repainting settings. What you see in real-time is what will be plotted historically.
TECHNICAL SPECIFICATIONS
Version: Pine Script v6
Type: Indicator (overlay = true)
Max Boxes: 500 (for zone visualization)
Max Lines: 500 (for TP/SL levels)
Max Labels: Unlimited (for annotations)
Repainting: None (uses lookahead = barmerge.lookahead_off)
COMPATIBLE INSTRUMENTS
Works best on liquid instruments with reliable volume data:
✅ Futures: NQ, MNQ, ES, MES, YM, MYM, RTY, M2K, CL, GC
✅ Forex: Major pairs (EUR/USD, GBP/USD, etc.)
✅ Stocks: Large-cap stocks with high volume
⚠️ Crypto: Works but requires higher ATR multipliers
❌ Low Volume Stocks: May produce unreliable signals
SUPPORT
For questions, suggestions, or to report issues, please comment below. I actively maintain this indicator and appreciate feedback from the community.
Enjoy trading with Pulsar! 🌟

CB Spot v BN Futs Premium by Chop324Coinbase Spot vs Binance Futures Premium Tracker
What This Indicator Does:
This indicator automatically tracks the price premium or discount between Coinbase spot prices and Binance perpetual futures for any cryptocurrency you're viewing. It works dynamically with whatever ticker you load it on - no manual configuration needed.
How It Works:
The script extracts the base currency from your current chart (BTC, ETH, SOL, etc.) and automatically constructs the corresponding tickers:
Coinbase Spot: COINBASE: USD
Binance Perpetual Futures: BINANCE: USDT.P
It then calculates the simple price difference: Coinbase Spot - Binance Futures
Visual Display:
The premium/discount is plotted as a histogram:
Green columns: Coinbase trading at a premium (higher than Binance)
Red columns: Coinbase trading at a discount (lower than Binance)
Baseline at 0: Represents price parity between exchanges
Why This Matters:
Coinbase premium is a useful market sentiment indicator, particularly for institutional/US retail activity:
Positive premium: Often indicates strong US-based buying pressure
Negative premium: May suggest selling pressure or capital flowing to offshore exchanges
Extreme deviations: Can signal localized supply/demand imbalances or arbitrage opportunities
Usage:
Simply load the indicator on any crypto chart (BTCUSDT, ETHUSDT, SOLUSDT, etc.) and it will automatically display the premium/discount for that asset.
Note: Requires both Coinbase spot and Binance perpetual futures data to be available for the symbol you're viewing.

Live P&L IndicatorThis script gives you a simple, no-nonsense way to see your live profit and loss right on your chart. It stays fixed in the center (slightly offset for balance), updating automatically as price moves — so you always know where you stand without checking your account tab.
You can manually set your entry, clear it, or let the script freeze once your take-profit target is hit — perfect for keeping emotions in check when the trade’s already done its job.
Everything’s built to look clean and professional — no clutter, no distractions, just a sleek overlay.

Crypto Futures Basis Tracker (Annualized)🧩 What is Basis Arbitrage
Basis arbitrage is a market-neutral trading strategy that exploits the price difference between a cryptocurrency’s spot and its futures markets.
When futures trade above spot (called contango), traders can buy spot and short futures, locking in a potential yield.
When futures trade below spot (backwardation), the reverse applies — short spot and go long futures.
The yield earned (or cost paid) by holding this position until expiry is called the basis. Expressing it as an annualized percentage allows comparison across different contract maturities.
⚙️ How the Indicator Works
This tool calculates the annualized basis for up to 10 cryptocurrency futures against a chosen spot price.
You select one spot symbol (e.g., BITSTAMP:BTCUSD) and up to 10 futures symbols (e.g., DERIBIT:BTCUSD07X2025, DERIBIT:BTCUSD14X2025, etc.).
The script automatically computes the days-to-expiry (DTE) and the annualized basis for each future.
A table displays for each contract: symbol, expiry date, DTE, last price, and annualized basis (%) — making it easy to compare the forward curve across maturities.
⚠️ Risks and Limitations
While basis arbitrage is often considered low-risk, it’s not risk-free:
Funding and financing costs can erode returns, especially when borrowing or using leverage.
Exchange or counterparty risk — if one leg of the trade fails (e.g., exchange default, margin liquidation), the hedge breaks.
Execution and timing risk — the basis can tighten or invert before both legs are opened.
Liquidity differences — thin futures may have large bid-ask spreads or slippage.
Use this indicator for analysis and monitoring, not as an automated trading signal.
Disclaimer: Please remember that past performance may not be indicative of future results. Due to various factors, including changing market conditions, the strategy may no longer perform as well as in historical backtesting. This post and the script don't provide any financial advice.

Weekend GapsIdentify unfilled gaps between the close of one candle and the opening of the next. Optimised for weekends by highlighting friday gaps with a triangle and bold horizontal ray. Depending on the price action required to fill it, they are marked in red or green.

MNQ Hybrid Scalper Pro - Advanced NASDAQ Futures Scalping System🎯 Overview
The MNQ Hybrid Scalper Pro is a comprehensive scalping system engineered specifically for NASDAQ futures traders. This indicator implements a modern hybrid approach that combines institutional-grade VWAP analysis with momentum oscillators optimized for the unique volatility characteristics of the NASDAQ market. Developed through extensive research on MNQ/NQ price action patterns, this indicator provides clear, actionable signals while filtering out market noise during high-volatility periods.
✨ Key Features
1. VWAP Foundation
Session-anchored VWAP with automatic reset
Dynamic standard deviation bands (1σ and 2σ)
Color-coded price bars based on VWAP positioning
VWAP test detection with momentum confirmation
2. Optimized Momentum Suite
Fast RSI (7): Aggressive settings (85/15) for quick scalping signals
Scalping MACD (5,13,6): Optimized parameters with SMA option
Quick Stochastic (9,3,3): Tuned for 1-minute chart responsiveness
Divergence Detection: Automated bullish/bearish divergence alerts
3. Multi-Timeframe Trend Filter
Triple EMA system (9, 21, 50) on current and higher timeframes
Trend strength scoring (-3 to +3) for directional bias
Prevents counter-trend trades in strong trending markets
Visual trend alignment indicators
4. Smart Signal Generation
Long Signals: VWAP pullback + RSI oversold + MACD bullish turn + HTF trend alignment
Short Signals: VWAP rally + RSI overbought + MACD bearish turn + HTF trend alignment
Signal cooldown period to prevent overtrading
Session-based filtering for optimal trading windows
5. Risk Management Visualization
Automatic profit target levels (10 & 20 points)
Dynamic stop loss levels (6 & 8 points)
Risk/reward ratio calculation (minimum 1.5:1)
Breakeven level display after 5 points profit
Visual entry, target, and stop lines on chart
6. Session Intelligence
NY opening range highlight (first 30 minutes)
Optimal scalping window shading (9:30-11:30 AM EST)
Major session markers (Asia, Europe, NY)
Session countdown timer
Contract rollover reminders
7. Real-Time Performance Dashboard
Current trend status across timeframes
Signal statistics and win rate tracking
Position relative to VWAP
Momentum indicator status (OB/OS/Neutral)
Volume analysis (relative to 20-period average)
Volatility monitoring with ATR spike detection
8. Professional Alert System
High-probability entry alerts with specific levels
VWAP test notifications with momentum confirmation
Target and stop loss hit alerts
Trend alignment notifications
Comprehensive alert messages with entry, stop, and target prices
📈 How to Use
Optimal Setup:
Timeframe: Best on 1-minute charts (also works on 3-min and 5-min)
Instrument: Optimized for MNQ (Micro E-mini NASDAQ), works with NQ
Session: Most effective during NY session (9:30-11:30 AM EST)
Chart Type: Standard candlestick or bars
Signal Interpretation:
Green Triangle (▲): Long entry signal - all conditions aligned for upward scalp
Red Triangle (▼): Short entry signal - all conditions aligned for downward scalp
DIV Labels: Momentum divergence detected - potential reversal zones
Colored Bars: Green = above VWAP (bullish bias), Red = below VWAP (bearish bias)
Entry Checklist:
Wait for signal arrow to appear
Confirm trend alignment in dashboard (HTF Trend)
Check momentum status isn't extreme
Verify you're within optimal trading window
Enter at market with predetermined stop and target
⚙️ Customization Options
Display Settings:
Toggle individual components on/off
4 color schemes (Professional, Dark, Light, Classic)
Adjustable transparency and visual elements
Dashboard position selection
Signal Settings:
Adjust momentum indicator parameters
Modify risk/reward levels
Configure session filters
Set signal cooldown periods
Advanced Features:
Multi-timeframe period adjustment
Volatility filter sensitivity
Contract type selection (MNQ/NQ)
Alert configuration options
📊 Best Practices
Start in Simulation: Test the indicator in paper trading first
Respect the Trend: Don't fight the higher timeframe trend
Manage Risk: Use the suggested stop losses consistently
Time Your Trades: Focus on the optimal scalping window
Confirm Signals: Best results when multiple confirmations align
⚠️ Important Notes
Supplementary Tool: This indicator supplements but doesn't replace proper market analysis and order flow reading
No Repainting: All signals are confirmed on bar close
Education Required: Understanding of scalping principles recommended
Risk Management: Always use proper position sizing and risk management
Market Conditions: Performance varies with market volatility and conditions
🎓 Educational Value
This indicator serves as an excellent educational tool for:
Learning VWAP-based trading strategies
Understanding momentum indicator optimization
Practicing multi-timeframe analysis
Developing systematic scalping approaches
Risk management visualization
💻 Technical Specifications
Pine Script Version: v6
Calculation Method: Non-repainting, real-time
Performance: Optimized for minimal lag
Compatibility: All TradingView plan levels
Updates: Regularly maintained and improved
🏆 What Makes This Unique
Unlike generic indicators, the MNQ Hybrid Scalper Pro is specifically engineered for NASDAQ futures volatility patterns. It combines institutional trading concepts (VWAP) with retail-friendly visualization and clear signals, bridging the gap between professional and accessible trading tools.
📬 Support & Feedback
Questions, suggestions, or feedback? Leave a comment below or send a private message. Your input helps improve the indicator for the entire community.
CME_MINI:MNQ1!
Disclaimer: This indicator is for educational and informational purposes only. It does not constitute financial advice. Trading futures involves substantial risk of loss and is not suitable for all investors. Past performance is not indicative of future results. Always conduct your own analysis and consult with a qualified financial advisor.

Average Daily Range [Blaz]Version 1.0 – Published October 2025: Initial release
1. Overview & Purpose
The Average Daily Range is an advanced volatility assessment tool designed to give traders a clear, real-time view of the market's expected daily movement. It calculates the average range between daily highs and lows over a user-defined historical period and projects this average onto the current trading session.
By visualising the potential high and low boundaries for the day, this indicator assists in setting realistic profit targets, managing risk effectively, and identifying when price action is becoming overextended relative to its recent volatility profile. It is an essential tool for day traders and swing traders across all markets, including Forex, Stocks, Crypto, Futures, and Commodities.
2. Core Functionality & Key Features
The indicator provides a dynamic, multi-faceted analysis of daily volatility:
Historical ADR Calculation: Automatically computes the Average Daily Range based on the specified number of previous trading days (configurable from 1 to 20).
Real-Time Range Tracking: Monitors and displays the current day's live price range as it develops.
Percentage Used Metric: Shows the percentage of the historical ADR that the current day's range has already consumed, providing an immediate gauge of remaining volatility potential.
Remaining Range Projection: Visually highlights the potential upward and downward movement remaining to meet the average range, displayed as semi-transparent areas on the chart.
Daily Open Reference: Plots customisable vertical separation lines and horizontal price lines at the daily open to clearly anchor the current session's price action.
3. Visual Components & Analytical Insights
A fully configured Average Daily Range setup displays several key analytical components that work together to provide a comprehensive volatility overview.
3.1. Information Table
A highly customizable data table provides a concise summary of all critical metrics at a glance:
Historical Ranges: Displays the individual daily ranges for the selected lookback period.
ADR Value: The calculated average range.
Today's Range: The live, developing range for the current session.
% Used: A colour-coded percentage (turning orange upon exceeding 100% and red upon exceeding 150%) showing how much of the average volatility has been consumed.
3.2. Visual Range Projections
Remaining Range Zones: When the current day's range is below the historical average, semi-transparent zones extend from the current day's extreme high and low, illustrating the additional movement required to reach the ADR. This provides an instant visual cue for potential target zones.
Daily Open Markers: Clean, customisable lines mark the start of each trading day (vertical line) and the daily open price (horizontal line), helping to contextualise intraday price moves.
4. Input Parameters and Settings
4.1. General Settings
Lookback: Set the number of days used to calculate the Average Daily Range (1-20).
Set Alert: Configure alerts to be notified when the current day's range consumes a significant portion (e.g., 100% or more) of the historical ADR.
4.2. Table Customization
Visibility & Style: Toggle the table and historical data on/off. Fully customise the header and body colours, text colours, border style, and font sizes.
Placement & Orientation: Precisely position the table anywhere on the chart (Top/Bottom/Centre, Left/Right) and choose between Horizontal or Vertical layout to best suit your chart layout.
4.3. Visual Style Controls
Remaining Range: Toggle the projection zones on/off and customise their colour and transparency.
Daily Open Markers: Independently control the visibility, colour, style, and width of the daily separation line and the open price line.
5. Protected Logic & Original Design
The Average Daily Range indicator incorporates proprietary logic for efficiently tracking intraday extremes, managing historical data arrays, and dynamically rendering visual elements. The closed-source nature of this tool protects the author's original code structure and optimisation techniques, particularly the real-time area fill projection logic for the remaining daily range and the dynamic table management system. This ensures the indicator remains performant and reliable while being freely accessible to the entire TradingView community.
6. Disclaimer & Terms of Use
This indicator, titled Average Daily Range , has been independently developed by the author. The code and its structural logic are original and were written entirely from scratch to reflect a unique and efficient approach to volatility analysis. The internal mechanics were written from scratch and are not based on any publicly available script or third-party code.
This tool is provided solely for educational and informational purposes. It is not intended as financial advice, investment guidance, or a specific recommendation to buy or sell any financial instrument. The indicator is designed to assist with technical analysis based on volatility but does not guarantee accuracy or profitability.
Trading financial markets involves significant risk, including the possibility of loss of capital. By using this indicator, you acknowledge and accept that you are solely responsible for any decisions you make and for all trading outcomes. No part of this script should be considered a signal or assurance of success in the market.

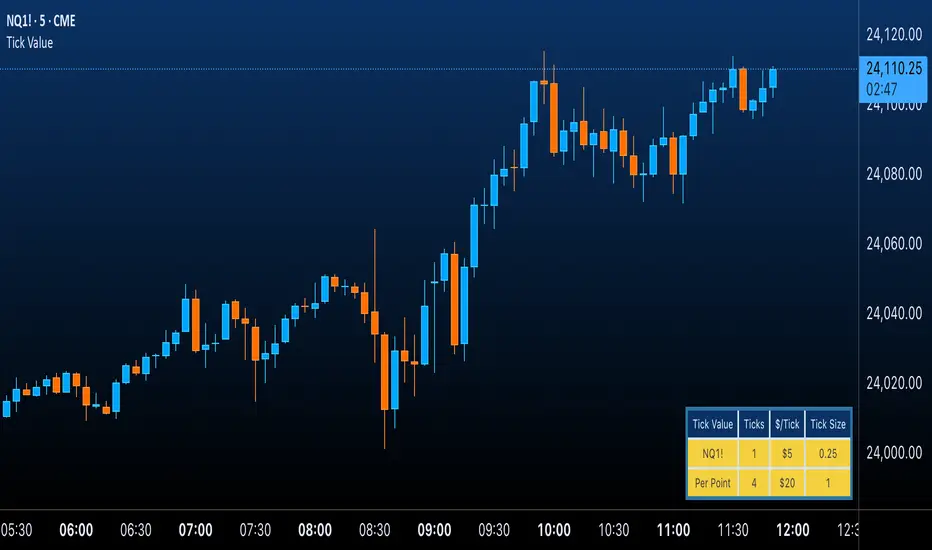
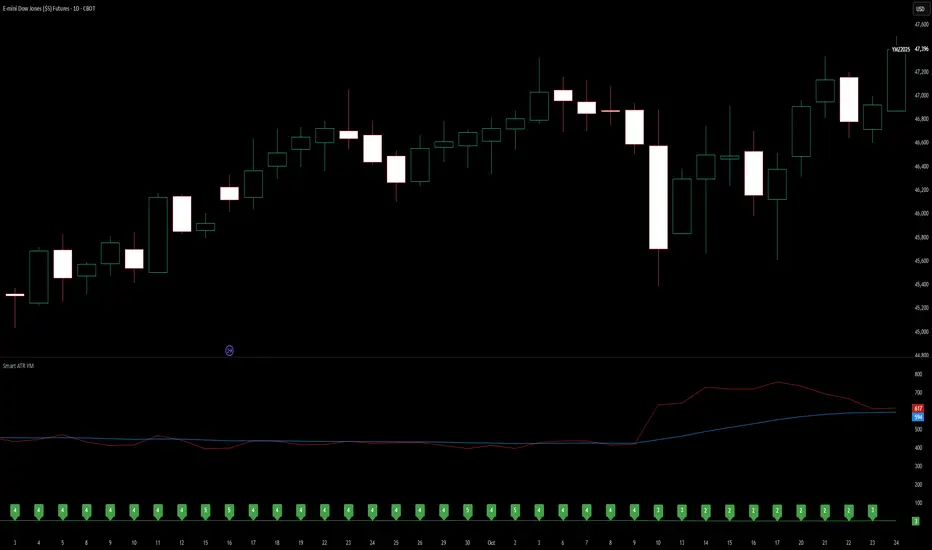
Smart ATR - Position Sizing for YM Dow JonesSmart ATR includes all basic functionality of ATR + an EMA of ATR. The EMA can give you a baseline or long-term perspective of what ATR normally is. The built-in, automatic sizing tool will display a recommended number of contracts each bar, based upon a multiple of the current ATR. Supports fractional tick values for MYM by clicking the down arrow. Supports fractional ATR values, such as 1.5x. Updates contract sizing on each new bar. This indicator will maintain your RR as volatility increases and decreases. Currently only optimized for YM, will publish other versions if there is an interest.
Blick Trades Position Size CalculatorThe Blick Trades Position Size indicator is a comprehensive Position Size Calculator designed for futures traders on TradingView. It automatically detects the asset type (Gold, Nasdaq, or ES futures - both regular and micro contracts) and calculates the optimal number of contracts to trade based on your risk amount and stop loss price.
The indicator features a "Maximize Risk" option that intelligently switches between regular and micro contracts to get as close as possible to your target risk amount, plus support for limit orders with custom entry prices. It displays visual elements on the chart including entry and stop loss lines with live risk calculations, and uses an asset-specific display system so you can control which charts show the indicator (preventing parameter confusion when switching between different futures contracts).
The calculator handles all the complex math automatically - just input your risk amount and stop loss, and it tells you exactly how many contracts to trade while showing your precise dollar risk in real-time.

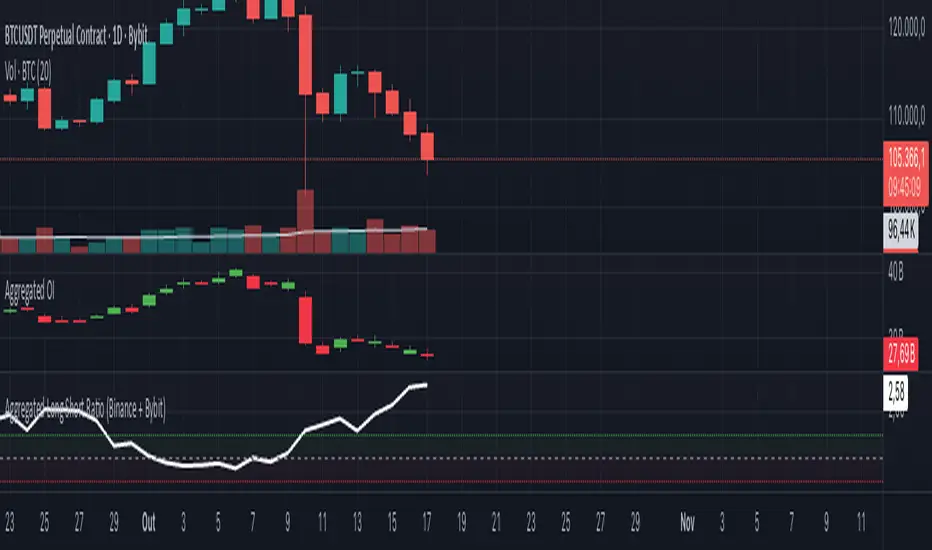
Aggregated Long Short Ratio (Binance + Bybit)This indicator displays the Long/Short Ratio (LSR) from Binance and Bybit exchanges, plus an aggregated average. LSR shows the ratio between traders holding long positions vs short positions.
Settings AvailableExchanges Group:
☑️Show Binance - Display Binance LSR line
☑️ Show Bybit - Display Bybit LSR line
☑️ Show Aggregated LSR - Display combined average
Timeframe - Choose data timeframe (leave empty for chart timeframe)
Visualization Group:
🎨 Binance Color - Default: Yellow
🎨 Bybit Color - Default: Orange
🎨 Aggregated Color - Default: White
📖 How to Read the Indicator
⚠️ CRITICAL: Always analyze LSR together with Open Interest (OI)
Key Levels:
LSR = 1.0 (gray dashed line) = Balance - Equal longs and shorts
LSR > 1.0 = More longs than shorts (bullish sentiment)
LSR < 1.0 = More shorts than longs (bearish sentiment)
Extreme Zones:
LSR > 1.5 (green zone) = Very bullish - Possible market top
LSR < 0.5 (red zone) = Very bearish - Possible market bottom
Why Open Interest Matters:
LSR alone doesn't tell the full story. You MUST check Open Interest:
Rising OI + High LSR (>1.5) = New longs opening → Strong momentum OR potential trap
Rising OI + Low LSR (<0.5) = New shorts opening → Strong momentum OR potential trap
Falling OI + Extreme LSR = Positions closing → Weak signal, avoid trading
Stable OI + Extreme LSR = No new positions → Less reliable signal
💡 Trading Interpretation
⚠️ ALWAYS combine LSR with Open Interest analysis!
Contrarian Strategy (High Leverage Zones):
High LSR (>1.5) + Rising OI → Many new longs → Potential short squeeze OR reversal down
Low LSR (<0.5) + Rising OI → Many new shorts → Potential long squeeze OR reversal up
Trend Confirmation:
Rising LSR + Rising price + Rising OI = Strong bullish trend with new positions
Falling LSR + Falling price + Rising OI = Strong bearish trend with new positions
Weak Signals (Avoid):
Extreme LSR + Falling OI = Positions closing → Low conviction
Extreme LSR + Stable OI = No new money → Wait for confirmation
Divergences:
Price higher highs but LSR falling + Rising OI = Bearish divergence (shorts accumulating)
Price lower lows but LSR rising + Rising OI = Bullish divergence (longs accumulating)
Best Setups:
Reversal: Extreme LSR (>1.5 or <0.5) + Rising OI + Price rejection
Trend: LSR trending with price + Steadily rising OI
Caution: Extreme LSR + Falling OI = Ignore signal
Built-in Alerts
The indicator includes 4 preset alerts:
LSR Crossed Above 1.0 - Market turned bullish
LSR Crossed Below 1.0 - Market turned bearish
LSR Very High - Above 1.5 (possible top)
LSR Very Low - Below 0.5 (possible bottom)
To Set Up Alerts:
Click the "..." on the indicator
Select "Add Alert"
Choose the condition you want
Configure notification method
Best Practices
MANDATORY: Always add Open Interest indicator to your chart alongside LSR
To add OI: Click Indicators → Search "Open Interest" → Add official TradingView OI
Use on perpetual futures charts (symbols ending in .P)
Works best on USDT pairs (BTCUSDT, ETHUSDT, etc.)
Combine LSR + OI + price action + support/resistance levels
Higher timeframes (4h, 1D) give more reliable signals
Don't trade LSR extremes without confirming OI direction
Golden Rule: Rising OI = Strong signal | Falling OI = Weak signal
⚠️ Important Notes
Indicator requires TradingView Premium or above (uses Request library)
Only works on crypto perpetual futures
Data availability depends on exchange API
NA values mean data is not available for that exchange/symbol
Never use LSR without Open Interest context
Aggregated Open Interest Multi-Exchange (USD)This indicator aggregates Open Interest (OI) data from multiple major cryptocurrency exchanges into a single unified view in USD, using data available on TradingView. It automatically adapts to the asset you're viewing on the chart.
Features:
Aggregates OI from 7 major exchanges: Binance, Bybit, OKX, Bitget, Deribit, HTX, and Coinbase
All values converted to USD - unlike native OI which shows contracts/coins
Uses only data available on TradingView platform
Automatically detects the asset from your chart (BTC, ETH, SOL, etc.)
True apples-to-apples comparison across exchanges
Displays as candlesticks showing OI open, high, low, and close
Toggle exchanges on/off individually
Handles different contract types per exchange automatically
Why USD conversion matters:
Traditional OI indicators show values in contracts or crypto units, making it difficult to compare across exchanges. This indicator converts everything to USD, giving you the real dollar value of open positions across all exchanges.
How it works:
Simply add the indicator to any crypto perpetual futures chart. It will automatically fetch and aggregate OI data from all supported exchanges for that asset using TradingView's built-in data feeds, converting everything to USD.
Supported Exchanges:
Binance, Bybit, Bitget, HTX: USDT perpetuals
Deribit: BTC/ETH use USD contracts, others use USDC
OKX: Contract-based (automatically converted)
Coinbase: USDC perpetuals
Perfect for traders who want a comprehensive view of total market Open Interest in USD across exchanges using reliable TradingView data.

Adaptive Trend Breaks Adaptive Trend Breaks
## WHAT IT DOES
This script is a modified and enhanced version of "Trendline Breakouts With Targets" concept by ChartPrime.
Adaptive Trend Breaks (ATB) is a trendline breakout system optimized for scalping liquid futures contracts. The indicator automatically draws dynamic support and resistance trendlines based on pivot points, then generates trade signals when price breaks through these levels with confirmation filters. It includes automated target and stop-loss placement with real-time P&L tracking in dollars.
## HOW IT WORKS
**Trendline Detection Method:**
The indicator uses pivot high/low detection to identify significant price turning points. When a new pivot forms, it calculates the slope between consecutive pivots to draw dynamic trendlines. These lines extend forward based on the established trend angle, creating actionable support and resistance zones.
**Band System:**
Around each trendline, the script creates a "band" using a volatility-adjusted calculation: `ATR(14) * 0.2 * bandwidth multiplier / 2`. This adaptive band accounts for current market conditions - wider during volatile periods, tighter during quiet markets.
**Breakout Logic:**
A breakout signal triggers when:
1. Price closes beyond the trendline + band zone
2. Volume exceeds the 20-period moving average by your set multiplier (default 1.2x)
3. Price is within Regular Trading Hours (9:30-16:00 EST) if session filter enabled
4. Current ATR meets minimum volatility threshold (prevents trading dead markets)
**Target & Stop Calculation:**
Upon breakout confirmation:
- **Entry**: Trendline breach point
- **Target**: Entry ± (bandwidth × target multiplier) - default 8x for quick scalps
- **Stop**: Entry ± (bandwidth × stop multiplier) - default 8x for 1:1 risk/reward
- Multipliers adjust automatically to market volatility through the ATR-based band
**P&L Conversion:**
The script converts point movements to dollars using:
```
Dollar P&L = (Price Points × Contract Point Value × Quantity)
```
For example, a 10-point NQ move with 2 contracts = 10 × $20 × 2 = $400
## HOW TO USE IT
**Setup:**
1. Select your instrument (NQ/ES/YM/RTY) - point values auto-configure
2. Set contract quantity for accurate dollar P&L
3. Choose pivot period (lower = more signals but more noise, default 5 for scalping)
4. Adjust bandwidth multiplier if trendlines are too tight/loose (1-5 range)
**Filters Configuration:**
- **Volume Filter**: Requires breakout volume > moving average × multiplier. Increase multiplier (1.5-2.0) for higher conviction trades
- **Session Filter**: Enable to trade only RTH. Disable for 24-hour trading
- **ATR Filter**: Prevents signals during low volatility. Increase minimum % for more active markets only
**Risk Management:**
- Set target/stop multipliers based on your risk tolerance
- 8x bandwidth = approximately 1:1 risk/reward for most liquid futures
- Enable trailing stops for trend-following approach (moves stop to protect profits)
- Adjust line length to see targets further into the future
**Statistics Table:**
- Choose timeframe to analyze: all-time, today, this week, custom days
- Monitor win rate, profit factor, and net P&L in dollars
- Track long vs short performance separately
- See real-time unrealized P&L on active trades
**Reading Signals:**
- **Green triangle below bar** = Long breakout (resistance broken)
- **Red triangle above bar** = Short breakout (support broken)
- **White dashed line** = Entry price
- **Orange line** = Take profit target with dollar value
- **Red line** = Stop loss with dollar value
- **Green checkmark (✓)** = Target hit, winning trade
- **Red X (✗)** = Stop hit, losing trade
## WHAT IT DOES NOT DO
**Limitations to Understand:**
- Does not predict future trendline formations - it reacts to breakouts after they occur
- Historical trendlines disappear after breakout (not kept on chart for clarity)
- Requires sufficient volatility - may not signal in extremely quiet markets
- Volume filter requires exchange volume data (not available on all symbols)
- Statistics are indicator-based simulations, not actual trading results
- Does not account for slippage, commissions, or order fills
## BEST PRACTICES
**Recommended Settings by Market:**
- **NQ (Nasdaq)**: Default settings work well, consider volume multiplier 1.3-1.5
- **ES (S&P 500)**: Slightly slower, try period 7-8, volume 1.2
- **YM (Dow)**: Lower volatility, reduce bandwidth to 1.5-2
- **RTY (Russell)**: Higher volatility, increase bandwidth to 3-4
**Risk Management:**
- Never risk more than 2-3% of account per trade
- Use contract quantity calculator: Max Risk $ ÷ (Stop Distance × Point Value)
- Start with 1 contract while learning the system
- Backtest your specific timeframe and instrument before live trading
**Optimization Tips:**
- Increase pivot period (7-10) for fewer but higher-quality signals
- Raise volume multiplier (1.5-2.0) in choppy markets
- Lower target/stop multipliers (5-6x) for tighter profit taking
- Use trailing stops in strong trending conditions
- Disable session filter for overnight gaps and Asia session moves
## TECHNICAL DETAILS
**Key Calculations:**
- Pivot Detection: `ta.pivothigh(high, period, period/2)` and `ta.pivotlow(low, period, period/2)`
- Slope Calculation: `(newPivot - oldPivot) / (newTime - oldTime)`
- Adaptive Band: `min(ATR(14) * 0.2, close * 0.002) * multiplier / 2`
- Breakout Confirmation: Price crosses trendline + 10% of band threshold
**Data Requirements:**
- Minimum bars in view: 500 for proper pivot calculation
- Volume data required for volume filter accuracy
- Intraday timeframes recommended (1min - 15min) for scalping
- Works on any timeframe but optimized for fast execution
**Performance Metrics:**
All statistics calculate based on indicator signals:
- Tracks every signal as a trade from entry to TP/SL
- P&L in actual contract dollar values
- Win rate = (Winning trades / Total trades) × 100
- Profit factor = Gross profit / Gross loss
- Separates long/short performance for bias analysis
## IDEAL FOR
- Futures scalpers and day traders
- Traders who prefer visual trendline breakouts
- Those wanting automated TP/SL placement
- Traders tracking performance in dollar terms
- Multiple timeframe analysis (compare 1min vs 5min signals)
## NOT SUITABLE FOR
- Swing trading (targets too close)
- Stocks/forex without modifying point values
- Extremely low timeframes (<30 seconds) - too much noise
- Markets without volume data if using volume filter
- Illiquid contracts (signals may not execute at shown prices)
---
**Settings Summary:**
- Core: Period, bandwidth, extension, trendline style
- Filters: Volume, RTH session, ATR volatility
- Risk: R:R ratio, target/stop multipliers, trailing stop
- Display: Stats table position, size, colors
- Stats: Timeframe selection (all-time to custom days)
**License:** This indicator is published open-source under Mozilla Public License 2.0. You may use and modify the code with proper attribution.
**Disclaimer:** This indicator is for educational purposes. Past performance does not guarantee future results. Always practice proper risk management and test thoroughly before live trading.
---
## CREDITS & ATTRIBUTION
This script builds upon the "Trendline Breakouts With Targets" concept by ChartPrime with significant enhancements:
**Major Improvements Added:**
- **Futures-Specific Calculations**: Automated dollar P&L conversion using actual contract point values (NQ=$20, ES=$50, YM=$5, RTY=$50)
- **Advanced Statistics Engine**: Comprehensive performance tracking with customizable timeframe analysis (today, week, month, custom ranges)
- **Multi-Layer Filtering System**: Volume confirmation, RTH session filter, and ATR volatility filter to reduce false signals
- **Professional Trade Management**: Enhanced visual trade tracking with separate TP/SL lines, dollar value labels, and optional trailing stops
- **Optimized for Scalping**: Faster pivot periods (5 vs 10), tighter bands, and reduced extension bars for quick entries
Original trendline detection methodology by ChartPrime - used with modification under Mozilla Public License 2.0.

CISD & OB [BLAZ]Version 1.0 – Published October 2025: Initial release
1. Overview & Purpose
The CISD & OB indicator identifies and plots Order Blocks (OB) and Changes in State of Delivery (CISD) on price charts using a strict rule-based approach designed to highlight structural turning points and continuation zones in price action. It automatically detects these formations when price creates confirmed swing highs or lows, followed by opposing directional moves that break predefined structural levels.
Detection logic is consistently applied across all market conditions, allowing the indicator to identify areas where notable price reactions or liquidity shifts have occurred. These levels are plotted as horizontal lines on the chart and are updated in real time to reflect the latest structural developments, helping traders visualise potential reversal or continuation zones.
The methodology used in this indicator represents the author's specific approach to Order Block and CISD identification, incorporating custom criteria for swing validation and confirmation logic that differ from standard implementations. Detection operates entirely mechanically, without discretionary intervention, to ensure consistency and objectivity across use cases. This indicator functions on all standard timeframes and supports multiple asset classes, including Forex, Stocks, Cryptocurrencies, Futures, and Commodities.
The indicator is unique in its ability to apply detection logic to a custom timeframe, enabling multi-timeframe structural analysis without switching charts. Let’s begin by explaining key terminologies based on the author’s perception to aid in understanding the functionality of the indicator.
2. Order Block (OB)
An Order Block is identified when price creates a swing high or swing low followed by a directional move that closes beyond the open of the opposing candle(s) structure.
2.1. For bearish Order Blocks:
Price must form a confirmed swing high (higher than surrounding candles).
A subsequent bearish candle must close below the open of the bullish candle(s) that created the swing high.
2.2. For bullish Order Blocks:
Price must form a confirmed swing low (lower than surrounding candles).
A subsequent bullish candle must close above the open of the bearish candle(s) that created the swing low.
The indicator only validates Order Blocks where the structural formation meets minimum swing criteria and the confirming move demonstrates sufficient momentum beyond the identified level.
3. Change in State of Delivery (CISD)
A CISD occurs when a valid Order Block forms in the opposite direction to the previously confirmed Order Block, indicating a potential shift in market structure.
3.1. Formation criteria:
A bullish CISD forms when a valid bullish Order Block is detected after the most recent confirmed structure was a bearish Order Block.
A bearish CISD forms when a valid bearish Order Block is detected after the most recent confirmed structure was a bullish Order Block.
Each CISD represents the first opposing Order Block in a sequence, distinguishing it from continuation Order Blocks that follow in the same direction.
The indicator tracks the sequence of Order Block formations to automatically classify each new structure as either a CISD (directional change) or continuation Order Block based on the preceding confirmed structure.
4. Detection Logic & Visual Management
The indicator continuously scans price action in real time, validating only those patterns that meet predefined technical thresholds. Once a structure is confirmed, it is plotted as a horizontal line extending from the origin candle’s open to the confirming close.
To maintain chart clarity, the script integrates automatic display management, limiting the number of plotted lines according to user-defined settings. Independent styling options are available for bullish and bearish structures, including colour, width, and line thickness. CISD and OB structures are styled separately to provide a clear distinction between reversal and continuation events.
Developing structures appear as dotted potential horizontal lines until they are validated, at which point they transition to solid lines. The indicator also allows users to restrict visibility of plotted lines above a selected timeframe, ensuring that higher timeframe charts remain clean and readable.
If configuration settings conflict, such as incompatible timeframe or visibility filters, the indicator displays on-chart warning messages to guide users in adjusting their setup appropriately.
The indicator supports multi-timeframe plotting capability, allowing structures identified on higher timeframes to be visualised directly on the active lower timeframe chart. This feature allows traders to observe how market structures align across multiple timeframes, providing greater confirmation of overall trend direction, reinforcing analytical confidence through cross‑timeframe confluence, and ensuring short‑term decisions remain aligned with the prevailing market context.
Traders can configure alerts to receive notifications when new CISD or OB structures are confirmed. Alerts are fully customisable via the indicator input settings and can be defined by direction (bullish/bearish) and pattern type (OB or CISD).
5. Usage Instructions
5.1. Alert Setup:
Enable "Set Alert?" toggle in indicator settings.
Configure alert preferences for specific pattern types.
On the chart, click the three dots menu beside the indicator's name or press Alt + A.
Select "Add Alert" and click “Create” to activate the alert.
Alerts trigger when new patterns are confirmed.
5.2. Display Controls:
Use "Bullish Lines" and "Bearish Lines" toggles to show/hide patterns by direction.
Adjust line quantity settings (1-25) to control how many patterns display simultaneously.
Enable “Timeframe” to apply detection logic to a higher timeframe of choice, displaying CISD and OB patterns directly on the active chart.
5.3. Visibility Filter:
Use “Show below” to limit indicator visibility to specific timeframes. When enabled, the indicator hides automatically on any timeframe equal to or higher than the selected setting.
5.4. Appearance Customisation:
Toggle “CISD” or “OB” on/off to show or hide individual pattern types.
Modify colours and line widths independently for bullish and bearish structures.
The “Show potential line” option displays developing patterns as dotted horizontal lines until confirmed.
5.5. Warning Message:
Enable “Show warning messages” to display on‑chart guidance for conflicting or invalid configurations.
Choose the preferred message box position and colour styling for readability.
6. Protected Logic & Original Design
This indicator has been developed from the ground up using proprietary algorithms and a custom structural classification logic derived from original research into Order Block and CISD identification methods. The internal mechanics, including real-time pre-confirmation logic, multi-timeframe adaptation, directional classification sequencing, and automated display management, are not based on any publicly available script or third-party resource.
7. Disclaimer
This indicator is provided for educational and analytical purposes only. It does not constitute financial advice, investment recommendations, or trading signals. All trading and investment decisions remain solely the responsibility of the user.
Trading financial instruments involves substantial risk of loss. Past performance of any trading methodology or indicator does not guarantee future results. Users should conduct their own research and consider consulting with qualified financial professionals before making trading decisions.
The indicator's pattern detection is based on technical analysis principles and should be used as part of a comprehensive trading approach. No trading tool can guarantee profitable outcomes or eliminate market risk.
By using this indicator, users acknowledge they understand these risks and accept full responsibility for their trading decisions and outcomes.

Futures Day Trading Key Levels by Dhawal Ranka
Hey everyone, thank you for using this script, let me know in the comments how you feel about it!
What this script does:
This indicator renders one consolidated map of intraday reference levels for futures (e.g., ES, NQ, GC, CL). It is session-aware and draws:
- Previous ETH day High/Low/Close
- Previous RTH High/Low/Close (built from your RTH session)
- Today’s developing RTH High/Low and Mid
- Overnight (ON) session High/Low
- Opening Range (first N minutes of RTH): OR High/Low
- VWAP (day-anchored) with optional ±σ bands
- Floor Pivots (PP/R1/S1/R2/S2) from prior ETH daily bar
- ADR projections (Up/Down) using a configurable lookback and anchor
- Settlement: prior official settlement and today’s projected settle (with manual override)
- Weekly/Monthly context: prior W/M High/Low/Close and current W/M Open
- Minimal right-edge text tags (instead of big boxes) that sit on the price scale line and auto-pack when levels coincide
All lines extend across the chart to make confluence obvious without clutter.
How it works (methods & calculations)
Sessions
The script exposes two user sessions and a time zone:
RTH (e.g., 09:30–16:00 America/New_York)
ON (e.g., 18:00–09:29 America/New_York)
Session membership is computed with time(timeframe, session, tz) != 0.
RTH H/L/C (prev) are aggregated intrabar: on RTH start we seed H/L; while inRTH we update; on RTH end we store the close.
Previous Day (ETH) levels
request.security(syminfo.tickerid, "D", high /low /close ) supplies PDH/PDL/PDC on the continuous ETH daily.
Opening Range
On RTH start we mark orStartTime.
While RTH is active and elapsed time < N minutes, we track the running high/low.
When elapsed ≥ N minutes, we freeze OR High/Low.
VWAP & ±σ bands (intraday)
Day-anchored VWAP uses ta.vwap(hlc3).
Bands: standard deviation of (close − vwap) from day start, accumulated inline:
stdev = sqrt( mean(dev^2) − mean(dev)^2 )
Bands = vwap ± k * stdev (user multiplier).
Floor Pivots (classic)
Using prior ETH daily H/L/C:
PP = (H + L + C) / 3
R1 = 2*PP − L, S1 = 2*PP − H
R2 = PP + (H − L), S2 = PP − (H − L).
ADR projections
Daily range series rng = request.security(..., "D", high - low).
ADR = SMA(rng, L) (default L=14).
Anchor is user-selectable: today’s open or yesterday’s close.
Projections: ADR Up = anchor + ADR/2, ADR Down = anchor − ADR/2.
Settlement
Prev Settle defaults to prior ETH daily close but can be overridden manually for markets where official settlement differs from feed close.
Today Projected Settle uses the current ETH daily close value.
Weekly / Monthly context
Prior W/M H/L/C from "W"/"M" with , plus current W/M Open.
Rendering & label logic (originality)
Lines are persistent: each named level owns one line object that is updated, not re-created—keeps resource use low and avoids “too many plots”.
Right-edge labels are text-only (no box) placed at x = bar_index + offset and yloc.price.
When multiple levels share (almost) the same price, labels are packed side-by-side using a small bucketing algorithm:
Prices are bucketed within ±½ tick.
Each label gets a position index inside its bucket; the final x-offset = baseOffset + index*step + priority.
Priorities nudge important tags (e.g., Settle/RTH levels) closer to the price scale so they remain readable.
Why this is published & what’s original
It’s not a simple mashup: the script’s utility is the session-aware aggregation, the OR timing logic, the intraday σ calculation around VWAP, the line-persistence manager, and the label packing with priorities that keeps the right edge readable even when many levels coincide.
The closed-source protection covers the packing/priority scheme and the persistent object management that make it practical on busy futures charts without hitting Pine limits.
How to use
Set your sessions & time zone
Choose RTH/ON session windows (the defaults match CME equity index futures) and the time zone of your charting workflow.
Toggle components
Enable only the layers you need (e.g., VWAP bands off if you want a cleaner chart).
Opening Range length (minutes) is adjustable.
Settlement
If your broker/feed’s daily close isn’t the official settlement, enter a manual settle value for the prior day.
Read the right edge
Labels sit on the price scale line. When two labels share the same price, they appear side-by-side rather than overlapping.
Timeframes & symbols
Designed for intraday futures on 1–30m. Works on other symbols/timeframes but intent is day trading.
Inputs (summary)
Sessions/TZ: RTH window, ON window, time zone
Today: RTH H/L/Mid, ON H/L, OR (minutes)
VWAP: on/off, ±σ bands, multiplier
Pivots: PP/R1/S1/R2/S2 (ETH)
ADR: lookback, anchor (open vs. prev close)
Settlement: show prev/proj, manual override
Weekly/Monthly: prior H/L/C + current open
Style: line transparency; right-edge tag size, base offset, and step; optional inline labels
Limitations & notes
“Prev Settle” equals the prior daily close unless overridden.
Session definitions matter: if your exchange hours differ, set your own RTH/ON windows.
No alerts are included to minimize plot count and keep performance high (you can add alert conditions on any level in a private copy).
Disclaimer
For educational purposes only; not financial advice. Futures trading involves significant risk.
Versioning
This script will be maintained under a single publication using Update (no minor forks). Major changes will be documented in the Change Log section of the script description.

RTH & ETH High/Low (Today & Prev)RTH and ETH High Low Indicator. This draws a line for the ETH and RTH highs and lows for todays session and yesterdays session. it allows you to toggle off any of the 8 potential levels as well as change the colour of the 8 levels. WIP

BOCS Channel Scalper Indicator - Mean Reversion Alert System# BOCS Channel Scalper Indicator - Mean Reversion Alert System
## WHAT THIS INDICATOR DOES:
This is a mean reversion trading indicator that identifies consolidation channels through volatility analysis and generates alert signals when price enters entry zones near channel boundaries. **This indicator version is designed for manual trading with comprehensive alert functionality.** Unlike automated strategies, this tool sends notifications (via popup, email, SMS, or webhook) when trading opportunities occur, allowing you to manually review and execute trades. The system assumes price will revert to the channel mean, identifying scalp opportunities as price reaches extremes and preparing to bounce back toward center.
## INDICATOR VS STRATEGY - KEY DISTINCTION:
**This is an INDICATOR with alerts, not an automated strategy.** It does not execute trades automatically. Instead, it:
- Displays visual signals on your chart when entry conditions are met
- Sends customizable alerts to your device/email when opportunities arise
- Shows TP/SL levels for reference but does not place orders
- Requires you to manually enter and exit positions based on signals
- Works with all TradingView subscription levels (alerts included on all plans)
**For automated trading with backtesting**, use the strategy version. For manual control with notifications, use this indicator version.
## ALERT CAPABILITIES:
This indicator includes four distinct alert conditions that can be configured independently:
**1. New Channel Formation Alert**
- Triggers when a fresh BOCS channel is identified
- Message: "New BOCS channel formed - potential scalp setup ready"
- Use this to prepare for upcoming trading opportunities
**2. Long Scalp Entry Alert**
- Fires when price touches the long entry zone
- Message includes current price, calculated TP, and SL levels
- Notification example: "LONG scalp signal at 24731.75 | TP: 24743.2 | SL: 24716.5"
**3. Short Scalp Entry Alert**
- Fires when price touches the short entry zone
- Message includes current price, calculated TP, and SL levels
- Notification example: "SHORT scalp signal at 24747.50 | TP: 24735.0 | SL: 24762.75"
**4. Any Entry Signal Alert**
- Combined alert for both long and short entries
- Use this if you want a single alert stream for all opportunities
- Message: "BOCS Scalp Entry: at "
**Setting Up Alerts:**
1. Add indicator to chart and configure settings
2. Click the Alert (⏰) button in TradingView toolbar
3. Select "BOCS Channel Scalper" from condition dropdown
4. Choose desired alert type (Long, Short, Any, or Channel Formation)
5. Set "Once Per Bar Close" to avoid false signals during bar formation
6. Configure delivery method (popup, email, webhook for automation platforms)
7. Save alert - it will fire automatically when conditions are met
**Alert Message Placeholders:**
Alerts use TradingView's dynamic placeholder system:
- {{ticker}} = Symbol name (e.g., NQ1!)
- {{close}} = Current price at signal
- {{plot_1}} = Calculated take profit level
- {{plot_2}} = Calculated stop loss level
These placeholders populate automatically, creating detailed notification messages without manual configuration.
## KEY DIFFERENCE FROM ORIGINAL BOCS:
**This indicator is designed for traders seeking higher trade frequency.** The original BOCS indicator trades breakouts OUTSIDE channels, waiting for price to escape consolidation before entering. This scalper version trades mean reversion INSIDE channels, entering when price reaches channel extremes and betting on a bounce back to center. The result is significantly more trading opportunities:
- **Original BOCS**: 1-3 signals per channel (only on breakout)
- **Scalper Indicator**: 5-15+ signals per channel (every touch of entry zones)
- **Trade Style**: Mean reversion vs trend following
- **Hold Time**: Seconds to minutes vs minutes to hours
- **Best Markets**: Ranging/choppy conditions vs trending breakouts
This makes the indicator ideal for active day traders who want continuous alert opportunities within consolidation zones rather than waiting for breakout confirmation. However, increased signal frequency also means higher potential commission costs and requires disciplined trade selection when acting on alerts.
## TECHNICAL METHODOLOGY:
### Price Normalization Process:
The indicator normalizes price data to create consistent volatility measurements across different instruments and price levels. It calculates the highest high and lowest low over a user-defined lookback period (default 100 bars). Current close price is normalized using: (close - lowest_low) / (highest_high - lowest_low), producing values between 0 and 1 for standardized volatility analysis.
### Volatility Detection:
A 14-period standard deviation is applied to the normalized price series to measure price deviation from the mean. Higher standard deviation values indicate volatility expansion; lower values indicate consolidation. The indicator uses ta.highestbars() and ta.lowestbars() to identify when volatility peaks and troughs occur over the detection period (default 14 bars).
### Channel Formation Logic:
When volatility crosses from a high level to a low level (ta.crossover(upper, lower)), a consolidation phase begins. The indicator tracks the highest and lowest prices during this period, which become the channel boundaries. Minimum duration of 10+ bars is required to filter out brief volatility spikes. Channels are rendered as box objects with defined upper and lower boundaries, with colored zones indicating entry areas.
### Entry Signal Generation:
The indicator uses immediate touch-based entry logic. Entry zones are defined as a percentage from channel edges (default 20%):
- **Long Entry Zone**: Bottom 20% of channel (bottomBound + channelRange × 0.2)
- **Short Entry Zone**: Top 20% of channel (topBound - channelRange × 0.2)
Long signals trigger when candle low touches or enters the long entry zone. Short signals trigger when candle high touches or enters the short entry zone. Visual markers (arrows and labels) appear on chart, and configured alerts fire immediately.
### Cooldown Filter:
An optional cooldown period (measured in bars) prevents alert spam by enforcing minimum spacing between consecutive signals. If cooldown is set to 3 bars, no new long alert will fire until 3 bars after the previous long signal. Long and short cooldowns are tracked independently, allowing both directions to signal within the same period.
### ATR Volatility Filter:
The indicator includes a multi-timeframe ATR filter to avoid alerts during low-volatility conditions. Using request.security(), it fetches ATR values from a specified timeframe (e.g., 1-minute ATR while viewing 5-minute charts). The filter compares current ATR to a user-defined minimum threshold:
- If ATR ≥ threshold: Alerts enabled
- If ATR < threshold: No alerts fire
This prevents notifications during dead zones where mean reversion is unreliable due to insufficient price movement. The ATR status is displayed in the info table with visual confirmation (✓ or ✗).
### Take Profit Calculation:
Two TP methods are available:
**Fixed Points Mode**:
- Long TP = Entry + (TP_Ticks × syminfo.mintick)
- Short TP = Entry - (TP_Ticks × syminfo.mintick)
**Channel Percentage Mode**:
- Long TP = Entry + (ChannelRange × TP_Percent)
- Short TP = Entry - (ChannelRange × TP_Percent)
Default 50% targets the channel midline, a natural mean reversion target. These levels are displayed as visual lines with labels and included in alert messages for reference when manually placing orders.
### Stop Loss Placement:
Stop losses are calculated just outside the channel boundary by a user-defined tick offset:
- Long SL = ChannelBottom - (SL_Offset_Ticks × syminfo.mintick)
- Short SL = ChannelTop + (SL_Offset_Ticks × syminfo.mintick)
This logic assumes channel breaks invalidate the mean reversion thesis. SL levels are displayed on chart and included in alert notifications as suggested stop placement.
### Channel Breakout Management:
Channels are removed when price closes more than 10 ticks outside boundaries. This tolerance prevents premature channel deletion from minor breaks or wicks, allowing the mean reversion setup to persist through small boundary violations.
## INPUT PARAMETERS:
### Channel Settings:
- **Nested Channels**: Allow multiple overlapping channels vs single channel
- **Normalization Length**: Lookback for high/low calculation (1-500, default 100)
- **Box Detection Length**: Period for volatility detection (1-100, default 14)
### Scalping Settings:
- **Enable Long Scalps**: Toggle long alert generation on/off
- **Enable Short Scalps**: Toggle short alert generation on/off
- **Entry Zone % from Edge**: Size of entry zone (5-50%, default 20%)
- **SL Offset (Ticks)**: Distance beyond channel for stop (1+, default 5)
- **Cooldown Period (Bars)**: Minimum spacing between alerts (0 = no cooldown)
### ATR Filter:
- **Enable ATR Filter**: Toggle volatility filter on/off
- **ATR Timeframe**: Source timeframe for ATR (1, 5, 15, 60 min, etc.)
- **ATR Length**: Smoothing period (1-100, default 14)
- **Min ATR Value**: Threshold for alert enablement (0.1+, default 10.0)
### Take Profit Settings:
- **TP Method**: Choose Fixed Points or % of Channel
- **TP Fixed (Ticks)**: Static distance in ticks (1+, default 30)
- **TP % of Channel**: Dynamic target as channel percentage (10-100%, default 50%)
### Appearance:
- **Show Entry Zones**: Toggle zone labels on channels
- **Show Info Table**: Display real-time indicator status
- **Table Position**: Corner placement (Top Left/Right, Bottom Left/Right)
- **Long Color**: Customize long signal color (default: darker green for readability)
- **Short Color**: Customize short signal color (default: red)
- **TP/SL Colors**: Customize take profit and stop loss line colors
- **Line Length**: Visual length of TP/SL reference lines (5-200 bars)
## VISUAL INDICATORS:
- **Channel boxes** with semi-transparent fill showing consolidation zones
- **Colored entry zones** labeled "LONG ZONE ▲" and "SHORT ZONE ▼"
- **Entry signal arrows** below/above bars marking long/short alerts
- **TP/SL reference lines** with emoji labels (⊕ Entry, 🎯 TP, 🛑 SL)
- **Info table** showing channel status, last signal, entry/TP/SL prices, risk/reward ratio, and ATR filter status
- **Visual confirmation** when alerts fire via on-chart markers synchronized with notifications
## HOW TO USE:
### For 1-3 Minute Scalping with Alerts (NQ/ES):
- ATR Timeframe: "1" (1-minute)
- ATR Min Value: 10.0 (for NQ), adjust per instrument
- Entry Zone %: 20-25%
- TP Method: Fixed Points, 20-40 ticks
- SL Offset: 5-10 ticks
- Cooldown: 2-3 bars to reduce alert spam
- **Alert Setup**: Configure "Any Entry Signal" for combined long/short notifications
- **Execution**: When alert fires, verify chart visuals, then manually place limit order at entry zone with provided TP/SL levels
### For 5-15 Minute Day Trading with Alerts:
- ATR Timeframe: "5" or match chart
- ATR Min Value: Adjust to instrument (test 8-15 for NQ)
- Entry Zone %: 20-30%
- TP Method: % of Channel, 40-60%
- SL Offset: 5-10 ticks
- Cooldown: 3-5 bars
- **Alert Setup**: Configure separate "Long Scalp Entry" and "Short Scalp Entry" alerts if you trade directionally based on bias
- **Execution**: Review channel structure on alert, confirm ATR filter shows ✓, then enter manually
### For 30-60 Minute Swing Scalping with Alerts:
- ATR Timeframe: "15" or "30"
- ATR Min Value: Lower threshold for broader market
- Entry Zone %: 25-35%
- TP Method: % of Channel, 50-70%
- SL Offset: 10-15 ticks
- Cooldown: 5+ bars or disable
- **Alert Setup**: Use "New Channel Formation" to prepare for setups, then "Any Entry Signal" for execution alerts
- **Execution**: Larger timeframes allow more analysis time between alert and entry
### Webhook Integration for Semi-Automation:
- Configure alert webhook URL to connect with platforms like TradersPost, TradingView Paper Trading, or custom automation
- Alert message includes all necessary order parameters (direction, entry, TP, SL)
- Webhook receives structured data when signal fires
- External platform can auto-execute based on alert payload
- Still maintains manual oversight vs full strategy automation
## USAGE CONSIDERATIONS:
- **Manual Discipline Required**: Alerts provide opportunities but execution requires judgment. Not all alerts should be taken - consider market context, trend, and channel quality
- **Alert Timing**: Alerts fire on bar close by default. Ensure "Once Per Bar Close" is selected to avoid false signals during bar formation
- **Notification Delivery**: Mobile/email alerts may have 1-3 second delay. For immediate execution, use desktop popups or webhook automation
- **Cooldown Necessity**: Without cooldown, rapidly touching price action can generate excessive alerts. Start with 3-bar cooldown and adjust based on alert volume
- **ATR Filter Impact**: Enabling ATR filter dramatically reduces alert count but improves quality. Track filter status in info table to understand when you're receiving fewer alerts
- **Commission Awareness**: High alert frequency means high potential trade count. Calculate if your commission structure supports frequent scalping before acting on all alerts
## COMPATIBLE MARKETS:
Works on any instrument with price data including stock indices (NQ, ES, YM, RTY), individual stocks, forex pairs (EUR/USD, GBP/USD), cryptocurrency (BTC, ETH), and commodities. Volume-based features are not included in this indicator version. Multi-timeframe ATR requires higher-tier TradingView subscription for request.security() functionality on timeframes below chart timeframe.
## KNOWN LIMITATIONS:
- **Indicator does not execute trades** - alerts are informational only; you must manually place all orders
- **Alert delivery depends on TradingView infrastructure** - delays or failures possible during platform issues
- **No position tracking** - indicator doesn't know if you're in a trade; you must manage open positions independently
- **TP/SL levels are reference only** - you must manually set these on your broker platform; they are not live orders
- **Immediate touch entry can generate many alerts** in choppy zones without adequate cooldown
- **Channel deletion at 10-tick breaks** may be too aggressive or lenient depending on instrument tick size
- **ATR filter from lower timeframes** requires TradingView Premium/Pro+ for request.security()
- **Mean reversion logic fails** in strong breakout scenarios - alerts will fire but trades may hit stops
- **No partial closing capability** - full position management is manual; you determine scaling out
- **Alerts do not account for gaps** or overnight price changes; morning alerts may be stale
## RISK DISCLOSURE:
Trading involves substantial risk of loss. This indicator provides signals for educational and informational purposes only and does not constitute financial advice. Past performance does not guarantee future results. Mean reversion strategies can experience extended drawdowns during trending markets. Alerts are not guaranteed to be profitable and should be combined with your own analysis. Stop losses may not fill at intended levels during extreme volatility or gaps. Never trade with capital you cannot afford to lose. Consider consulting a licensed financial advisor before making trading decisions. Always verify alerts against current market conditions before executing trades manually.
## ACKNOWLEDGMENT & CREDITS:
This indicator is built upon the channel detection methodology created by **AlgoAlpha** in the "Smart Money Breakout Channels" indicator. Full credit and appreciation to AlgoAlpha for pioneering the normalized volatility approach to identifying consolidation patterns. The core channel formation logic using normalized price standard deviation is AlgoAlpha's original contribution to the TradingView community.
Enhancements to the original concept include: mean reversion entry logic (vs breakout), immediate touch-based alert generation, comprehensive alert condition system with customizable notifications, multi-timeframe ATR volatility filtering, cooldown period for alert management, dual TP methods (fixed points vs channel percentage), visual TP/SL reference lines, and real-time status monitoring table. This indicator version is specifically designed for manual traders who prefer alert-based decision making over automated execution.

BOCS AdaptiveBOCS Adaptive Strategy - Automated Volatility Breakout System
WHAT THIS STRATEGY DOES:
This is an automated trading strategy that detects consolidation patterns through volatility analysis and executes trades when price breaks out of these channels. Take-profit and stop-loss levels are calculated dynamically using Average True Range (ATR) to adapt to current market volatility. The strategy closes positions partially at the first profit target and exits the remainder at the second target or stop loss.
TECHNICAL METHODOLOGY:
Price Normalization Process:
The strategy begins by normalizing price to create a consistent measurement scale. It calculates the highest high and lowest low over a user-defined lookback period (default 100 bars). The current close price is then normalized using the formula: (close - lowest_low) / (highest_high - lowest_low). This produces values between 0 and 1, allowing volatility analysis to work consistently across different instruments and price levels.
Volatility Detection:
A 14-period standard deviation is applied to the normalized price series. Standard deviation measures how much prices deviate from their average - higher values indicate volatility expansion, lower values indicate consolidation. The strategy uses ta.highestbars() and ta.lowestbars() functions to track when volatility reaches peaks and troughs over the detection length period (default 14 bars).
Channel Formation Logic:
When volatility crosses from a high level to a low level, this signals the beginning of a consolidation phase. The strategy records this moment using ta.crossover(upper, lower) and begins tracking the highest and lowest prices during the consolidation. These become the channel boundaries. The duration between the crossover and current bar must exceed 10 bars minimum to avoid false channels from brief volatility spikes. Channels are drawn using box objects with the recorded high/low boundaries.
Breakout Signal Generation:
Two detection modes are available:
Strong Closes Mode (default): Breakout occurs when the candle body midpoint math.avg(close, open) exceeds the channel boundary. This filters out wick-only breaks.
Any Touch Mode: Breakout occurs when the close price exceeds the boundary.
When price closes above the upper channel boundary, a bullish breakout signal generates. When price closes below the lower boundary, a bearish breakout signal generates. The channel is then removed from the chart.
ATR-Based Risk Management:
The strategy uses request.security() to fetch ATR values from a specified timeframe, which can differ from the chart timeframe. For example, on a 5-minute chart, you can use 1-minute ATR for more responsive calculations. The ATR is calculated using ta.atr(length) with a user-defined period (default 14).
Exit levels are calculated at the moment of breakout:
Long Entry Price = Upper channel boundary
Long TP1 = Entry + (ATR × TP1 Multiplier)
Long TP2 = Entry + (ATR × TP2 Multiplier)
Long SL = Entry - (ATR × SL Multiplier)
For short trades, the calculation inverts:
Short Entry Price = Lower channel boundary
Short TP1 = Entry - (ATR × TP1 Multiplier)
Short TP2 = Entry - (ATR × TP2 Multiplier)
Short SL = Entry + (ATR × SL Multiplier)
Trade Execution Logic:
When a breakout occurs, the strategy checks if trading hours filter is satisfied (if enabled) and if position size equals zero (no existing position). If volume confirmation is enabled, it also verifies that current volume exceeds 1.2 times the 20-period simple moving average.
If all conditions are met:
strategy.entry() opens a position using the user-defined number of contracts
strategy.exit() immediately places a stop loss order
The code monitors price against TP1 and TP2 levels on each bar
When price reaches TP1, strategy.close() closes the specified number of contracts (e.g., if you enter with 3 contracts and set TP1 close to 1, it closes 1 contract). When price reaches TP2, it closes all remaining contracts. If stop loss is hit first, the entire position exits via the strategy.exit() order.
Volume Analysis System:
The strategy uses ta.requestUpAndDownVolume(timeframe) to fetch up volume, down volume, and volume delta from a specified timeframe. Three display modes are available:
Volume Mode: Shows total volume as bars scaled relative to the 20-period average
Comparison Mode: Shows up volume and down volume as separate bars above/below the channel midline
Delta Mode: Shows net volume delta (up volume - down volume) as bars, positive values above midline, negative below
The volume confirmation logic compares breakout bar volume to the 20-period SMA. If volume ÷ average > 1.2, the breakout is classified as "confirmed." When volume confirmation is enabled in settings, only confirmed breakouts generate trades.
INPUT PARAMETERS:
Strategy Settings:
Number of Contracts: Fixed quantity to trade per signal (1-1000)
Require Volume Confirmation: Toggle to only trade signals with volume >120% of average
TP1 Close Contracts: Exact number of contracts to close at first target (1-1000)
Use Trading Hours Filter: Toggle to restrict trading to specified session
Trading Hours: Session input in HHMM-HHMM format (e.g., "0930-1600")
Main Settings:
Normalization Length: Lookback bars for high/low calculation (1-500, default 100)
Box Detection Length: Period for volatility peak/trough detection (1-100, default 14)
Strong Closes Only: Toggle between body midpoint vs close price for breakout detection
Nested Channels: Allow multiple overlapping channels vs single channel at a time
ATR TP/SL Settings:
ATR Timeframe: Source timeframe for ATR calculation (1, 5, 15, 60, etc.)
ATR Length: Smoothing period for ATR (1-100, default 14)
Take Profit 1 Multiplier: Distance from entry as multiple of ATR (0.1-10.0, default 2.0)
Take Profit 2 Multiplier: Distance from entry as multiple of ATR (0.1-10.0, default 3.0)
Stop Loss Multiplier: Distance from entry as multiple of ATR (0.1-10.0, default 1.0)
Enable Take Profit 2: Toggle second profit target on/off
VISUAL INDICATORS:
Channel boxes with semi-transparent fill showing consolidation zones
Green/red colored zones at channel boundaries indicating breakout areas
Volume bars displayed within channels using selected mode
TP/SL lines with labels showing both price level and distance in points
Entry signals marked with up/down triangles at breakout price
Strategy status table showing position, contracts, P&L, ATR values, and volume confirmation status
HOW TO USE:
For 2-Minute Scalping:
Set ATR Timeframe to "1" (1-minute), ATR Length to 12, TP1 Multiplier to 2.0, TP2 Multiplier to 3.0, SL Multiplier to 1.5. Enable volume confirmation and strong closes only. Use trading hours filter to avoid low-volume periods.
For 5-15 Minute Day Trading:
Set ATR Timeframe to match chart or use 5-minute, ATR Length to 14, TP1 Multiplier to 2.0, TP2 Multiplier to 3.5, SL Multiplier to 1.2. Volume confirmation recommended but optional.
For Hourly+ Swing Trading:
Set ATR Timeframe to 15-30 minute, ATR Length to 14-21, TP1 Multiplier to 2.5, TP2 Multiplier to 4.0, SL Multiplier to 1.5. Volume confirmation optional, nested channels can be enabled for multiple setups.
BACKTEST CONSIDERATIONS:
Strategy performs best during trending or volatility expansion phases
Consolidation-heavy or choppy markets produce more false signals
Shorter timeframes require wider stop loss multipliers due to noise
Commission and slippage significantly impact performance on sub-5-minute charts
Volume confirmation generally improves win rate but reduces trade frequency
ATR multipliers should be optimized for specific instrument characteristics
COMPATIBLE MARKETS:
Works on any instrument with price and volume data including forex pairs, stock indices, individual stocks, cryptocurrency, commodities, and futures contracts. Requires TradingView data feed that includes volume for volume confirmation features to function.
KNOWN LIMITATIONS:
Stop losses execute via strategy.exit() and may not fill at exact levels during gaps or extreme volatility
request.security() on lower timeframes requires higher-tier TradingView subscription
False breakouts inherent to breakout strategies cannot be completely eliminated
Performance varies significantly based on market regime (trending vs ranging)
Partial closing logic requires sufficient position size relative to TP1 close contracts setting
RISK DISCLOSURE:
Trading involves substantial risk of loss. Past performance of this or any strategy does not guarantee future results. This strategy is provided for educational purposes and automated backtesting. Thoroughly test on historical data and paper trade before risking real capital. Market conditions change and strategies that worked historically may fail in the future. Use appropriate position sizing and never risk more than you can afford to lose. Consider consulting a licensed financial advisor before making trading decisions.
ACKNOWLEDGMENT & CREDITS:
This strategy is built upon the channel detection methodology created by AlgoAlpha in the "Smart Money Breakout Channels" indicator. Full credit and appreciation to AlgoAlpha for pioneering the normalized volatility approach to identifying consolidation patterns and sharing this innovative technique with the TradingView community. The enhancements added to the original concept include automated trade execution, multi-timeframe ATR-based risk management, partial position closing by contract count, volume confirmation filtering, and real-time position monitoring.

Rylan Trades ToolkitStay ahead of the market with this all-in-one levels indicator.
It automatically plots key opens (Midnight, Day Session, Week, Month, Quarter, Year, or custom time) plus previous Highs and Lows from multiple timeframes.
Customize your style, width, and extensions, while the indicator keeps charts clean by auto-replacing old lines as new periods begin.
Trade smarter, cut through the noise, and focus only on the levels that matter most.
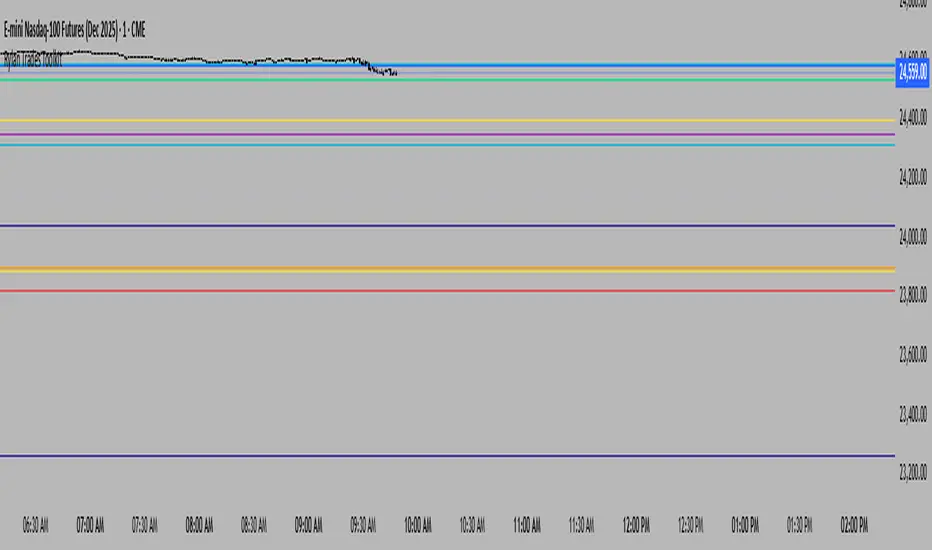
FlowSpike ES — BB • RSI • VWAP + AVWAP + News MuteThis indicator is purpose-built for E-mini S&P 500 (ES) futures traders, combining volatility bands, momentum filters, and session-anchored levels into a streamlined tool for intraday execution.
Key Features:
• ES-Tuned Presets
Automatically optimized settings for scalping (1–2m), daytrading (5m), and swing trading (15–60m) timeframes.
• Bollinger Band & RSI Signals
Entry signals trigger only at statistically significant extremes, with RSI filters to reduce false moves.
• VWAP & Anchored VWAPs
Session VWAP plus anchored VWAPs (RTH open, weekly, monthly, and custom) provide high-confidence reference levels used by professional order-flow traders.
• Volatility Filter (ATR in ticks)
Ensures signals are only shown when the ES is moving enough to offer tradable edges.
• News-Time Mute
Suppresses signals around scheduled economic releases (customizable windows in ET), helping traders avoid whipsaw conditions.
• Clean Alerts
Long/short alerts are generated only when all conditions align, with optional bar-close confirmation.
Why It’s Tailored for ES Futures:
• Designed around ES tick size (0.25) and volatility structure.
• Session settings respect RTH hours (09:30–16:00 ET), the period where most liquidity and institutional flows concentrate.
• ATR thresholds and RSI bands are pre-tuned for ES market behavior, reducing the need for manual optimization.
⸻
This is not a generic indicator—it’s a futures-focused tool created to align with the way ES trades day after day. Whether you scalp the open, manage intraday swings, or align to weekly/monthly anchored flows, FlowSpike ES gives you a clear, rules-based signal framework.

Futures Playbook: VWAP + OR + Cross-Asset TellsFutures Playbook: VWAP + OR + Cross-Asset Tells (with Trade Messages + Coach Panel)
This all-in-one futures trading toolkit combines Opening Range (OR) levels, VWAP, and cross-asset signals to help traders quickly read intraday structure, manage execution, and filter noise.
Core Features
• Opening Range (OR):
• Customizable OR window with High/Low and Midpoint.
• Automatic shading of the OR zone.
• VWAP & Bands:
• Built-in or session-anchored VWAP.
• Optional standard deviation bands for context.
• Cross-Asset Tells:
• Live reads on US 10Y yield, DXY, Crude, and Gold.
• Regime detection: rates risk, USD strength, energy softness, and real-rate easing.
• Confirmations:
• Volume vs. moving average filter.
• Cumulative delta with smoothing.
• ATR-based chop filter to avoid low-quality trends.
Trade Messages + Coach Panel
• Trade Messages (labels): Automatic on-chart prompts for OR completion, VWAP reclaim/loss, long/short setups, and EU close flows.
• Coach Panel (table): Real-time dashboard with regime context, directional bias, execution notes, risk reminders, and key levels (ORH, ORL, VWAP).
Alerts
• OR breakout (long/short with confirmations).
• VWAP reclaim or loss.
• 10Y yield crossing risk threshold.
Use Case
Designed for futures traders and scalpers who rely on VWAP + OR dynamics and need cross-asset confirmation before committing to trades. Great for structuring entries, managing risk, and filtering market noise throughout the session.

NDX Ladder → Adjusted to Active Ticker (5s & 10s)This indicator allows you to a grid of NDX levels directly on the NQ! (E-mini NASDAQ 100 Futures) chart, automatically adjusting for the spread between NDX and NQ1!. This is particularly useful for traders who perform technical analysis on SPX but execute trades on NQ1!.
Features:
Renders every 5 and 10 points steps of the NDX in your current chart.
The script adjusts these levels in real-time based on the current spread between NDX and NQ / MNQ
Plots updated horizontal lines that move with the spread

Futures Tick & Point Value [BoredYeti]Futures Tick & Point Value
This utility displays tick size, dollars per tick, and (optionally) a per-point row for the current futures contract.
Features
• Hardcoded $/tick map for common CME/NYMEX/CBOT/COMEX contracts
• Automatic fallback using pointvalue * mintick for any other symbol
• Table settings: adjustable position, text size, customizable colors
• Optional “Per Point” row showing ticks and $/point
Notes
• Contract specs can vary by broker/exchange and may change over time. Always confirm with official specifications.
• Educational tool only; not financial advice.