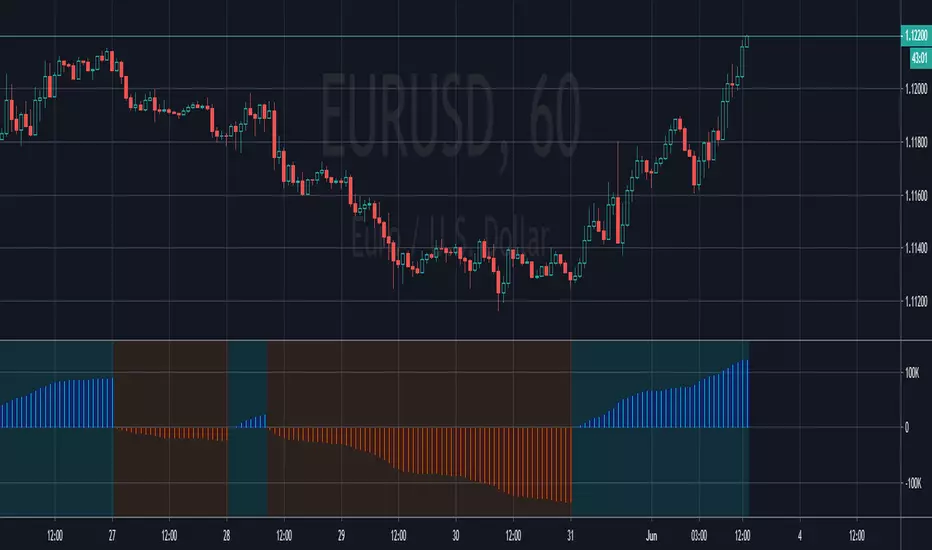
Open Interest Exponential Ease of MovementModified Ease of Movement :
* Open Interests used on Futures instead of Volume (Includes Bitcoin)
* Exponential Moving Average used instead of Simple Moving Average
* Division Number cancelled. (Division Number gives wrong signals inside strong trends.)
NOTE : This code is open source under the MIT License. If you have any improvements or corrections to suggest, please send me a pull request via the github repository github.com
Stay tuned. Best regards !
Futures
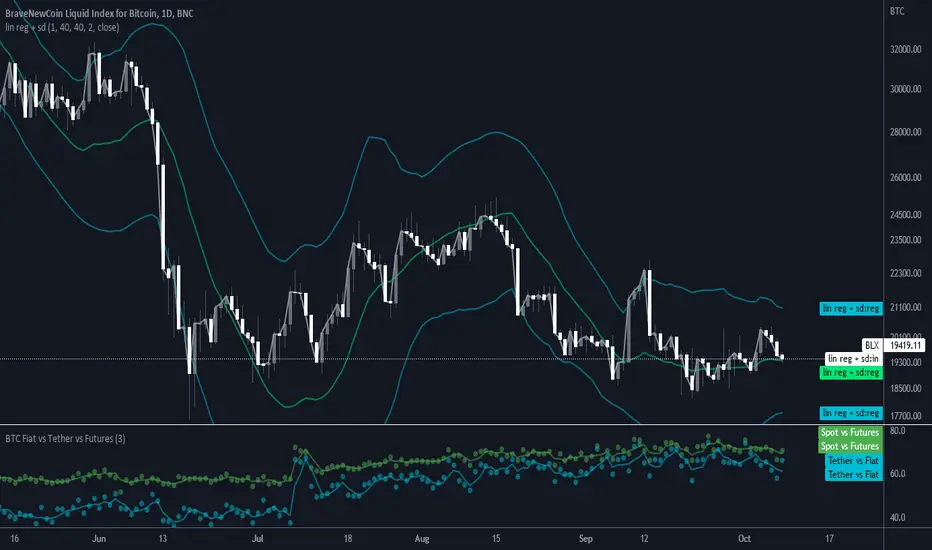
BTC Volume Fiat vs Tether vs FuturesFutures = BYBIT+ BITMEX
Fiat = KRAKEN + BITSTAMP + BITFLYER + COINBASE
Tether = HITBTC + HUOBI + BINANCE + BITFINEX
Spot = Fiat + Tether
Tether vs Fiat = 100 * Tether / (Tether + Fiat)
Spot vs Futures = 100 * Spot / (Spot + Futures)
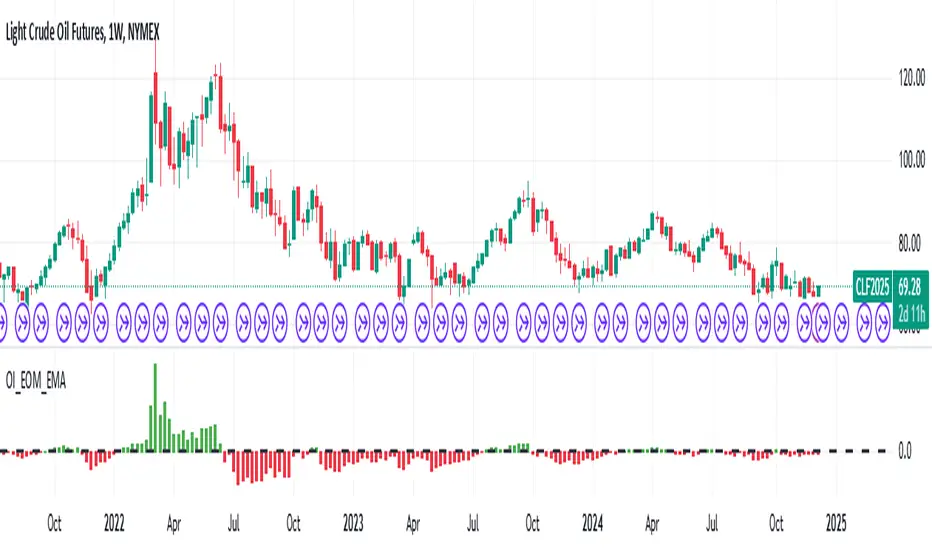
Open Interest Money Flow Index (OIMFI)CAUTION : This system was inspired from seiglerj' s "Money Flow Index " script. Open Interests are used instead of volume.
What is the Money Flow Index ( MFI )?
The Money Flow Index ( MFI ) is a technical oscillator that uses price and volume for identifying overbought or oversold conditions in an asset. It can also be used to spot divergences which warn of a trend change in price. The oscillator moves between 0 and 100.
Unlike conventional oscillators such as the Relative Strength Index ( RSI ), the Money Flow Index incorporates both price and volume data, as opposed to just price. For this reason, some analysts call MFI the volume-weighted RSI .
What Does the Money Flow Index ( MFI ) Tell You?
One of the primary ways to use the Money Flow Index is when there is a divergence. A divergence is when the oscillator is moving in the opposite direction of price. This is a signal of a potential reversal in the prevailing price trend.
For example, a very high Money Flow Index that begins to fall below a reading of 80 while the underlying security continues to climb is a price reversal signal to the downside. Conversely, a very low MFI reading that climbs above a reading of 20 while the underlying security continues to sell off is a price reversal signal to the upside.
Traders also watch for larger divergences using multiple waves in the price and MFI . For example, a stock peaks at $10, pulls back to $8, and then rallies to $12. The price has made two successive highs, at $10 and $12. If MFI makes a lower higher when the price reaches $12, the indicator is not confirming the new high. This could foreshadow a decline in price.
The overbought and oversold levels are also used to signal possible trading opportunities. Moves below 10 and above 90 are rare. Traders watch for the MFI to move back above 10 to signal a long trade, and to drop below 90 to signal a short trade.
Other moves out of overbought or oversold territory can also be useful. For example, when an asset is in an uptrend, a drop below 20 (or even 30) and then a rally back above it could indicate a pullback is over and the price uptrend is resuming. The same goes for a downtrend. A short-term rally could push the MFI up to 70 or 80, but when it drops back below that could be the time to enter a short trade in preparation for another drop .
Reference : www.investopedia.com
WARNING :
** Since each instrument in the list has its own unique contract data, you must first enter its name to display it. I recommend you to select OANDA from the markets. Finally, when the COT reports are issued, it may repaints. However, this repaint is usually close to closing or after close .(When COT reports are so sharp ) So use this script only 1W ( 1 week ) or 1 M ( 1 month ) timeframe.
** This data is taken to Tradingview with the help of Quandl. This is a very low possibility, but the system will not work if there is a malfunction.
FEATURES :
*** Working with all futures (Including : Bitcoin )
*** If you dont work with "Futures" , you can select "Others" from switchable menu and use volume for all instruments.
*** New generation elegant design used : Adaptive coloring Overbought - Oversold Levels according to the closing price.
NOTE : This code is open source under the MIT License. If you have any improvements or corrections to suggest, please send me a pull request via the github repository github.com
Stay tuned. Best wishes !

NCTA Cycle FinderCycle Finder
The NCTA Cycle Finder is one of three technical indicators that are part of the Profit Flow Analytics.
New Cycle Trading and Analytics is a group of traders creating market analytics for traders. The objective is to take complex combinations of multiple technical pattern indicators and present to the trader a simple, single entry signal.
The NCTA Cycle Finder is designed to identify the beginning of new, trending cycles. It is excellent in short 1, 3, and 5 minute timeframes for futures traders and short term options traders. Longer timeframes such as the 5, 10, and 30 minute timeframes work well for options traders.
This indicator consists of a simple, single entry indicator designed to provide an entry very close to the shift on the intra-day cycle. It provides a warning that a cycle shift may be coming by printing a grey bar. Bars above the zero line imply a possible new long cycle developing. Grey bars below the zero line imply a possible new short cycle is developing.
Once the indicator has confirmed a new cycle is developing, a dark blue or red bar will print. Dark blue above the zero line is the trader’s signal to go long. A dark red signal below the zero line is the traders signal to go short. The indicator is designed to filter out false signals and provide the trader with an optimum timing of capturing an entry/exit very close to the beginning / ending of a cycle.
Using the NCTA Cycle Finder, the Profit Flow Oscillator, and Trend Consensus indicators together, offers traders an opportunity to lock in profits and enter the same trending cycle more than one time. This is an excellent opportunity to open trend continuation trades. The NCTA Cycle Finder is excellent when used across more than one timeframe to confirm alignment. For example, monitoring the 5 minute signals and confirming alignment with the 1 minute chart improves the probability of entering a profitable trade.
HOW TO USE: Use the grey bar prints to be ready for a signal and the possible direction. Go long when a blue bar appears and go short when a red bar appears. The print of these signals very closely identify the beginning of a new cycle
The NCTA Cycle Finder, which is part of the Profit Flow Analytics set of indicators, is traded in a live trading room every market day, hosted by our friends at Options Money Maker.
To learn more about the NCTA Cycle Finder and the other two indicators, which are part of Profit Flow Analytics, use the following link:
www.newcycletrading.com
NQZ2019
SP:SPX

Weiss Wave Open Interest BarsFirstly :
LazyBear ' s "Weiss Wave " codes are used for open interests.
Original Weiss Wave Volume :
Let's start :
Open Interest vs. Volume: An Overview
Volume and open interest are two key measurements that describe the liquidity and activity of contracts In the options and futures markets. However, their meanings and applications are different. Volume refers to the number of contracts traded in a given period, while open interest denotes the number of active contracts.
Volume
Trading volume measures the number of options or futures contracts being exchanged between buyers and sellers, identifying the level of activity for that particular contract. For every buyer, there is a seller, and the transaction itself counts toward the daily volume.
Open Interest
Open interest indicates the number of options or futures contracts that are held by traders and investors in active positions. These positions have not been closed out, expired, or exercised. Open interest decreases when holders and writers of options (or buyers and sellers of futures) close out their positions. To close out positions, they must take offsetting positions or exercise their options. Open interest increases once again when investors and traders open new long positions or writers/sellers take on new short positions. Open interest also increases when new options or futures contracts are created.
Options or futures contract trading volume can only increase while open interest can either increase or decrease. While trading volume indicates the number of contracts that have been bought or sold, open interest identifies the number of contracts that are currently held.
Reference : www.investopedia.com
*** Worked to define all futures . You can look them in codes (between line : 13 to line 94 )
** CAUTION 1 : Since each instrument in the list has its own unique contract data, you must first enter its name to display it. I recommend you to select OANDA from the markets. Finally, when the COT reports are issued, it may repaints. However, this repaint is usually close to closing or after close .(When COT reports are so sharp ) So use this script only 1W ( 1 week ) or 1 M ( 1 month ) timeframe.
** CAUTION 2 : This data is taken to Tradingview with the help of Quandl. This is a tremendous possibility, but the system will not work if there is a malfunction.
Best regards.

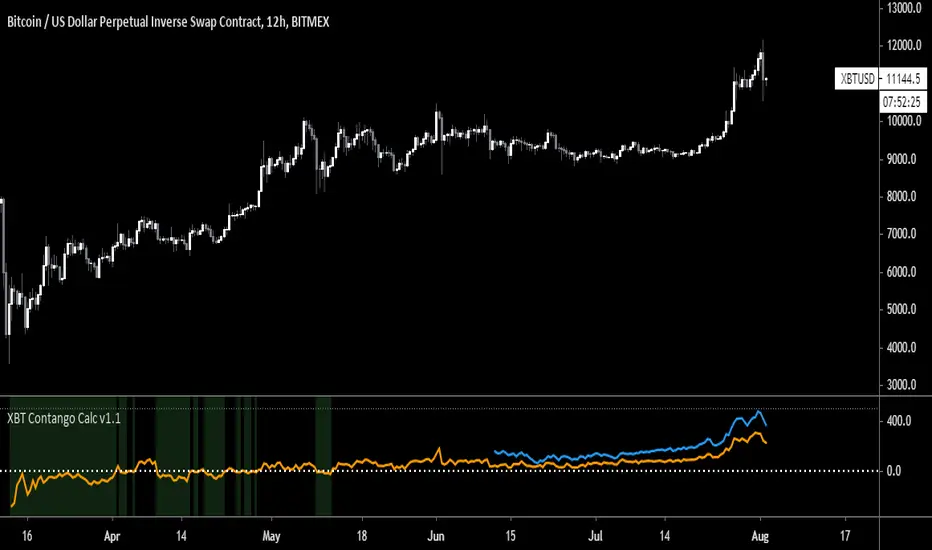
XBT Contango Calculator v1.1
This indicator measures value of basis (or spread) of current Futures contracts compared to spot. The default settings are specifically for Bitmex XBTU19 and XBTZ19 futures contracts. These will need to be updated after expiration. Also, it seems that Tradingview does not keep charts of expired contracts. If anyone knows how to import data from previous expired contracts, please let me know. This historical data could be valuable for evaluating previous XBT futures curves.
Also, VERY important to understand is this indicator only works with Spot Bitcoin charts (XBTUSD, BTCUSD, etc). If you add this to any other asset chart, it would not be useful (unless you changed settings to evaluate a different Futures product).
Contango and Backwardation are important fundamental indicators to keep track of while trading Futures markets. For a better explanation, Ugly Old Goat had done several medium articles on this. Please check out link below for his latest article on the subject...
uglyoldgoat.com
Notes on chart above should explain most of what you need to know on to use this indicator. The zero line is the spot price on the chart, so a positive value means Futures are trading at a premium (or in Contango). You can set a value of extreme Contango which will give an alert as red background (default setting is +$500). Green background will appear when Futures are trading at a discount to spot (Backwardation).
Hope some people get some use out of this. This is my first attempt at coding anything, so any feedback would be greatly appreciated!
BTC Donations: 3CypEdvBcvVHbqzHUt1FDiUG53U7pYWviV
E-MINI FUTURE BUY/SELL ARROW SIGNALS INDICATOR E-MINI FUTURE BUY/SELL ARROW SIGNALS INDICATOR
✅ Works for Daily charts and Intraday charts
✅ Good to short-term and medium-term scalping
✅ Analyzes E-Mini Futures Trend in real time
✅ Generates Buy, Sell signals
✅ Trending Indicator

Oil Pit VWAPOil future traders commonly watch the pit session VWAP (9:00am to 2:30pm). The Oil Pit VWAP indicator overlays the VWAP from 9-2:30 (using hlc3) onto any futures asset, but its probably only useful for oil...

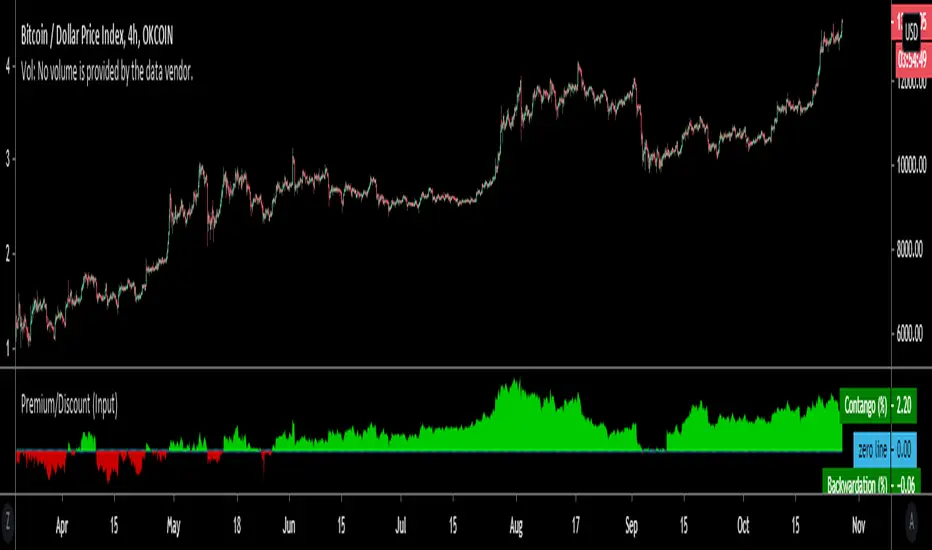
Premium/Discount (Input)Used to show Contango or Backwardation in futures contracts vs spot price. You can input your own tickers so can technically can be used to compare anything.
* In this example I'm showing Okex Quarterly contract vs Okex spot index price because it showcases it better.
* If you are using this after 2019 the default setting will not work because I set it to Bitmex which does not currently have a "current contract in front" ticker available.
It should be fairly self explanatory, but just ask below if you have any questions.
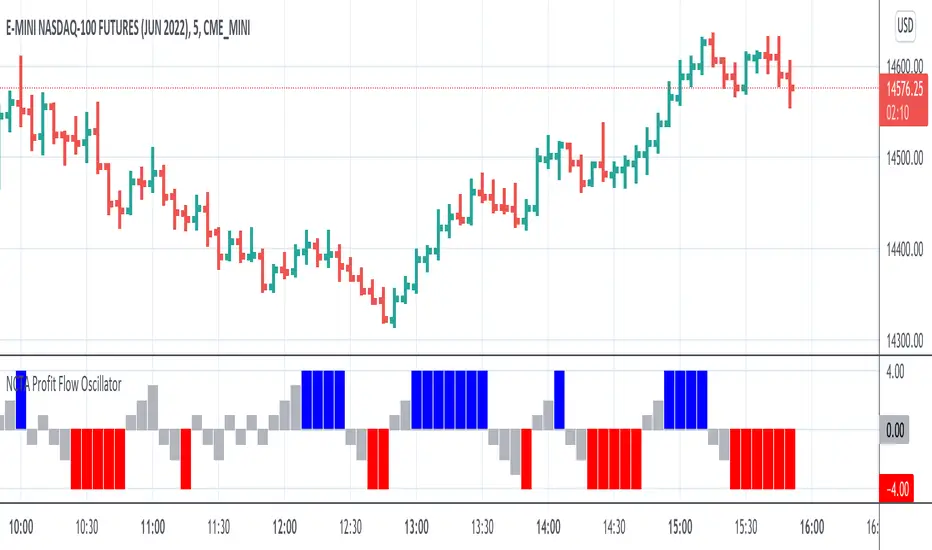
NCTA Profit Flow OscillatorProfit Flow Oscillator
The Profit Flow Oscillator is one of two technical pattern indicators that are part of the Profit Flow Analytics.
New Cycle Trading and Analytics is a group of traders creating market analytics for traders. The objective is to take complex combinations of multiple technical pattern indicators and present to the trader a simple, single signal entry.
The Profit Flow Oscillator is excellent in short 1, 3, and 5 minute timeframes for futures traders and short term options traders. Longer timeframes such as the 5, 10, and 30 minute timeframes work well for options traders.
The Profit Flow Oscillator consists of a simple, single entry indicator designed to provide an entry very close to the shift on the intra-day cycle. It is designed to filter out false signals and provide the trader with an optimum timing of an entry.
HOW TO USE: Go long when a blue bar appears and go short when a red bar appears. These prints very closely identify the beginning of a new cycle
The Profit Flow Oscillator, which is part of the Profit Flow Analytics set of indicators, is traded in a live trading room every market day, hosted by our friends at Options Money Maker.
To learn more and to get a free trial of the Profit Flow Oscillator, use the following link:
www.newcycletrading.com
NQU2019
SP:SPX
NCTA Trend ConsensusTrend Consensus Indicator
The Trend Consensus Indicator is one of two technical pattern indicators that are part of the Profit Flow Analytics.
New Cycle Trading and Analytics is a group of traders creating market analytics for traders. The objective is to take complex combinations of multiple technical pattern indicators and present to the trader a simple, single signal entry.
The Trend Consensus Indicator is excellent in short 1, 3, and 5 minute timeframes for futures traders and short term options traders. Longer timeframes such as the 5, 10, and 30 minute timeframes work well for options traders.
The Trend Consensus Indicator consists of a simple, single entry indicator designed to provide an entry very close to the shift on the intra-day cycle. It is designed to filter out false signals and provide the trader with an optimum timing of an entry. The signal consists of an early indication of a possible entry followed by a confirming/entry signal. It is very simple to monitor and recognize the entry.
HOW TO USE: Go long when a dark blue bar appears as long as there is at least one light or dark blue bar immediately preceding it. Go short when a dark red bar appears as long as there is at least one light or dark red bar immediately preceding it.
The Trend Consensus Indicator, which is part of the Profit Flow Analytics set of indicators, is traded in a live trading room every market day, hosted by our friends at Options Money Maker.
To learn more and to get a free trial of the Trend Consensus Indicator, as part of the Profit Flow Analytics use the following link:
www.newcycletrading.com
NQU2019
SP:SPX


Futures DeltaTakes Most Advanced futures contract and minuses Perp spot.
Unfortunately I need to manually update the contract so drop me a note when there is a new one.
Filb

Commercial / Open Interest-Buschi
English:
Another view the Commitment of Traders (CoT) data
Since the Commercials are often a good indicator for future market movements, I tampered a little bit with their positioning (long or short) in relation to the open interest to visualize some kind of "commercial buying (long) or selling (short) power". It's definitely nothing more than work in progress, but I decided to publish it anyway. Critical comments are mostly welcome.
Deutsch:
Ein weiterer Blick auf die Commitment of Traders (CoT) Daten
Da die Commercials häufig ein guter Indikator für zukünftige Marktbewegungen sind, habe ich ein wenig mit ihrer Positionierung (long oder short) im Verhältnis zum Open Interest herumgebastelt, um eine Art von "kommerzieller Kauf- (long) oder Verkaufs-Kraft" abzubilden. Es ist momentan noch im absoluten Teststadium, aber ich habe mich dazu entschlossen, es trotzdem zu veröffentlichen. Kritische Anmerkungen sind sehr willkommen.

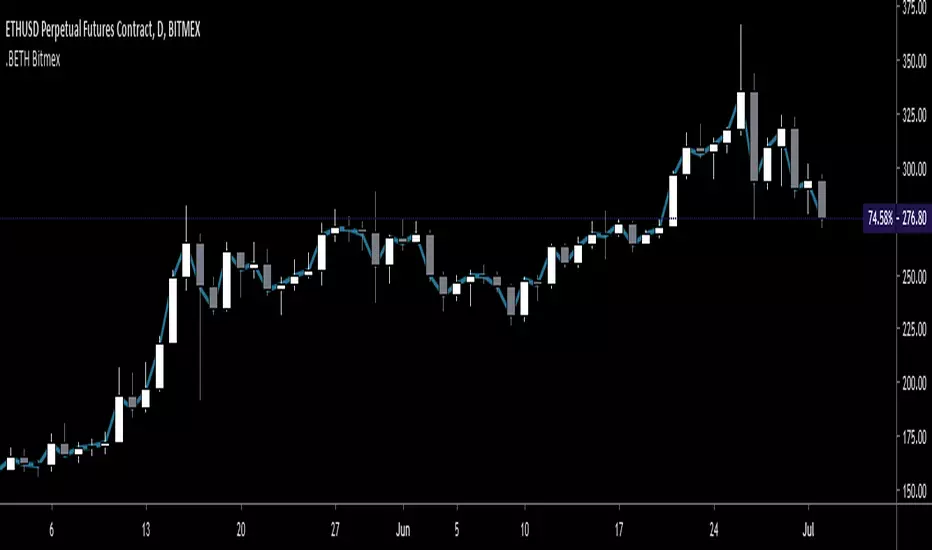
.BETH Ethereum Price Index - for BitMEX - Gyro.BETH script as seen on the BitMEX built-in chart.
This is not created by, authorized by or in any type of affiliation with BitMEX whatsoever.
This is not financial advice. Use at your own risk.
Tips are appreciated if you find this useful:
3BMEXty68scwEPfGGb4zkS23JdBCi3vtkh
See my other scripts for .BXBT!
Thanks
CME & XBT - BTC Futures Settlement DatesHi everyone
This in an indicator inspired by Scarrff
I added the XBT quarterly and yearly settlement dates
Enjoy
David

Bitmex BTC Perps vs Futures
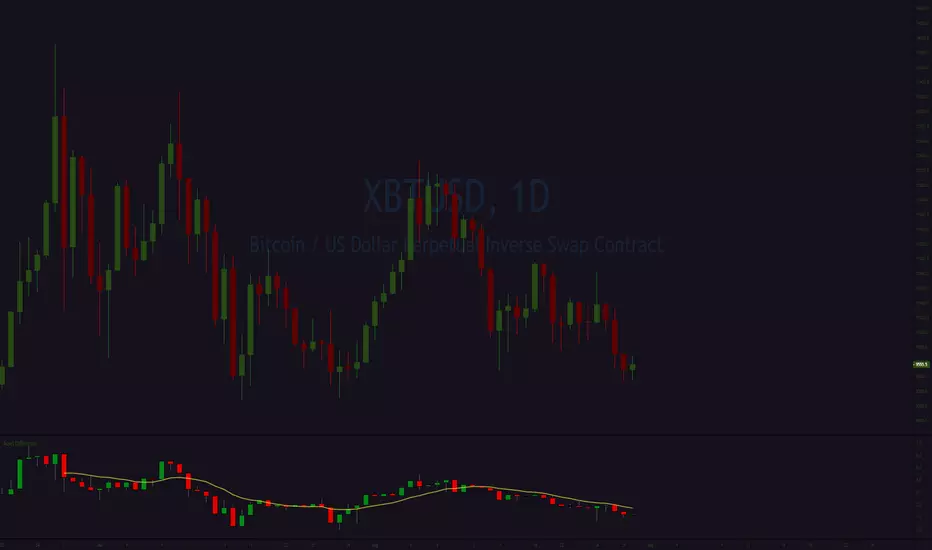
This chart is specifically designed to overlay XBTUSD, Bitmex Perpetual Inverse Swap contracts, so as to have a quick reference of the correlation between Futures and Perpetuals on the Bitmex exchange. Algos keep everything pretty close, but discrepancies can be gleaned if one is looking closely enough. Very basic script, but makes things a little more convenient than what I was using for this before. Publishing because, why not? A Premiums indicator would complement this script nicely.

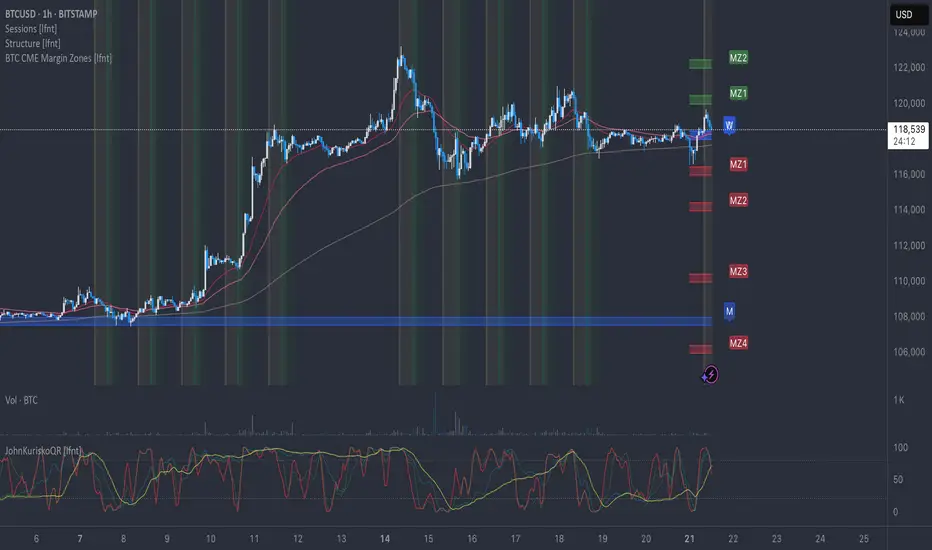
BTC CME Margin Zones [lfnt]This script calculates specific price zones based on the
- daily, weekly and monthly open and the
- daily maintenance margins of CME BTC futures contracts.
Futures - Measure and compare volatility in USDThis is a dirty fix.
Dollar value (syminfo.pointvalue) is wrong in Tradingview for the below listed futures, where the price is in quarters of cents.
For example ZC (Corn) says syminfo.pointvalue = 5000 (syminfo.mintick = 0.13), which gives you (with ATR = 6) volatility of $30,000 (6 * 5000) instead of the correct $300.
For all other futures I used the default syminfo.pointvalue.
Feel free to correct me, if I am wrong regarding the syminfo.pointvalue error.
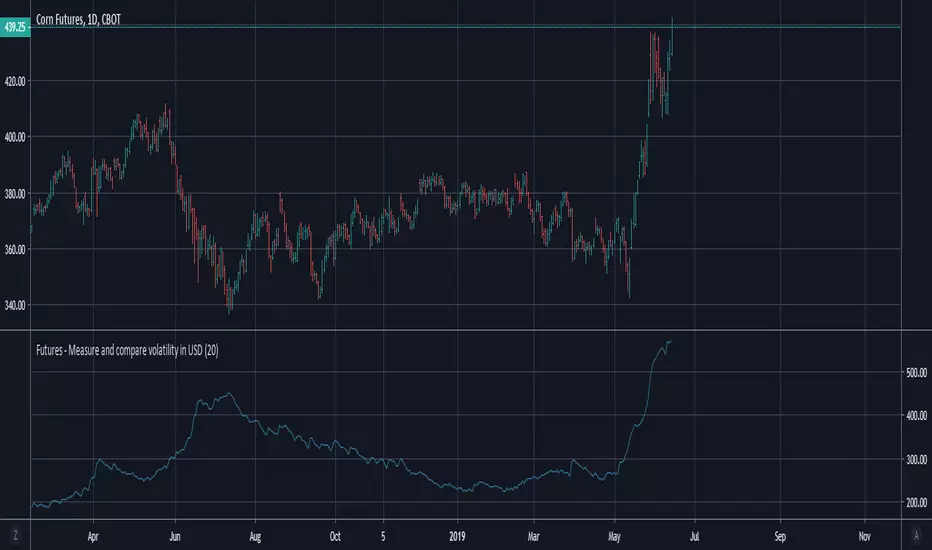
Futures - Measure and compare volatility in USDDollar value (syminfo.pointvalue) is wrong in Tradingview for the below listed futures, where the price is in quarters of cents. So this is a dirty fix.
For example ZC (Corn) says syminfo.pointvalue = 5000 (syminfo.mintick = 0.13), which gives you (ATR = 6) volatility 30,000 USD instead of the correct 300 USD.
For all other futures is used the default syminfo.pointvalue.

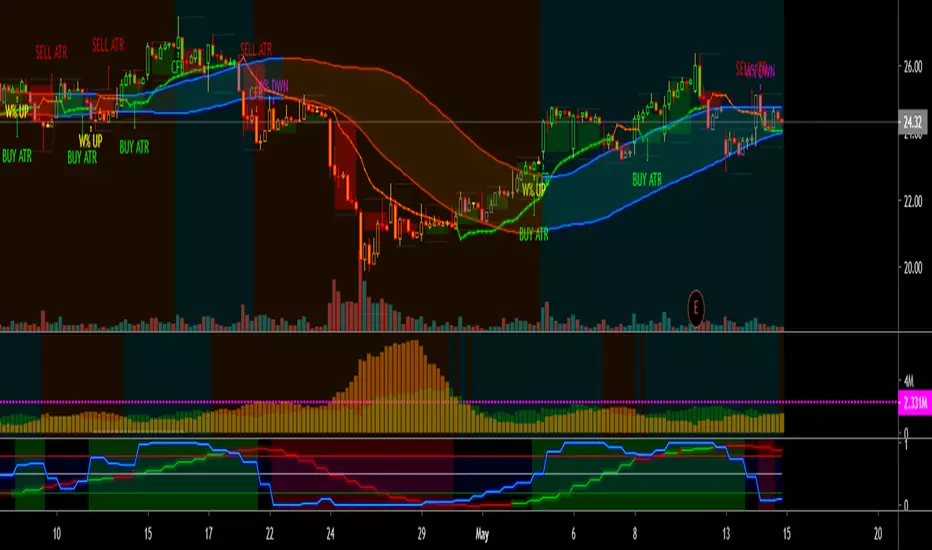
PpSignal ATR MA Band V2.1this indicator is based on the idea of acceleration bands, only that the algorithmic calculation is totally different and more accurate
ATR or accelerator Bands Quick Summary
Breakout outside ATR bands suggest a beginning of a strong rally or a sell-off.
Closing inside the bands afterward signals about the end of a rally or a sell-off.
The idea behind Acceleration Bands indicator
Acceleration Bands principal use is in finding the acceleration in currency pair price and benefit as long as this acceleration preserves.
How to trade with AB indicator
2 consecutive closes outside Acceleration Bands suggest an entry point in the direction of the breakout. Then position is kept till the first close back inside the Bands.
this indicator also shows us the trend, using CFB as a signal.
It also uses W% smoothing, when the CFB trend, the W% and the escape of the bands going to the same side is a strong signal of purchase or sale.
You may find other alarms within the indicator such as: W% signal
escape from the price of the bands.
price entry to the bands
bollinger bans stop, can be used as SL.
and a mobile average based on ATR.
You can to combine this indicator with:
related pre indicators
PpSignal Volume Profilethis indicator shows us the strength of the volume. green is buy signal an orange is sell signal.
The yellow signal is the net volueme. Net volume is a technical indicator calculated by subtracting a security's uptick volume by its downtick volume over a specified period of time.
when the volume buy is greater than the volume of sell the background change to aqua color. When the sell volume is greater than the buy volume, the background is painted orange ...