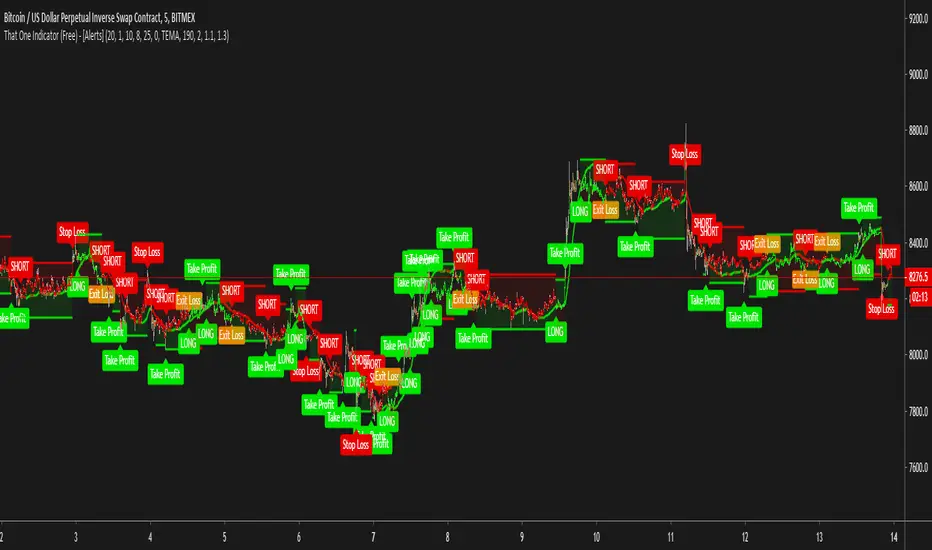
That One Indicator (Free) - [ALERTS]This script comes with the following indicators:
Bollinger Bands
Stochastic
Moving Average Trend Confirmation Filter (EMA, SMA)
Long/Short Alerts
Stop Loss Alerts
And a few more indicators in the back-end to increase accuracy
This script works really well as a scalper on lower Time Frames as well as on higher Time Frames. Besides that you can also trade it on pretty much any coin or asset.
This script is not repainting. We advise to use alerts on “Once Per Bar Close” .
If you’d like to automate this script you can do that by using AutoView, ProfitView, ProfitTrailer, CryptoHopper etc.
Alerts are set very clearly as Long and Short to avoid confusion.
A new script is being published soon with a lot more functionality, which includes noise filtering, all MA Types, RSI and other types of volatility measurements to filter out “less profitable” trades.
Feel free to leave a comment and share it with your friends.
Gold
Gold Indy by TheorisThis indicator show possibility zone
High possibility for buy - Green zone
Medium possibility for buy - Pale Green zone
High possibility for sell - Red zone
Medium possibility for sell - Pink zone
Other colors - no signal.
Let 's try to use any timeframe / Trend timeframe.
which one is match for your symbols
concept from : RSI/Sto ...

CS Signals Lite (read the description)CoinStudio Signals Lite displays long and short entries.
Additionally, the Full version supports custom alerts based on the signals.
To get access to the full version and alerts, please message me for an invite.
The signals work for any asset (crypto, stocks, gold , silver , etc.).
In principle, the signals work for every time-frame but depending on the asset some work better than others.
However, daily and 4hr usually give the best results.

CS Signals Full (read the description)CoinStudio Signals Full displays long and short entries and allows to set custom alerts based on them.
The signals work for any asset (crypto, stocks, gold, silver, etc.).
In principle, the signals work for every time-frame but depending on the asset some work better than others.
However, daily and 4hr usually give the best results.
To enable this script, please head to our Discord and ask for an invite:
discord.gg

Various Volume RSI (UNLIMITED)RSI displaying multiple currencies together (arbitrary input version)
forex or cryptcurrencies...economic index or metal or energy...and more...
複数の通貨をまとめて表示するRSIです。(任意入力版)
外国為替や暗号通貨...経済指数・金属・エネルギー...その他を表示できます。
同時に多通貨を監視することで見えてくるものがあります。
詳細、購入などはこちらにて
note.mu

Asset Correlation Tool v3, improvedI found this useful tool among the indicators but it wasn't doing the correlation study correctly.
Everything in markets, with only a few exceptions, are rising in value over time and therefore trended to time. The simplest method I found is to use link relative or first difference detrending, before calculating a correlation between assets.
I also updated it to include more assets, to use the latest Cryptocap indices like BTC.D/ETH.D/TOTAL2 and the top 100 crypto index CIX100. I improved the colour schemes, too
Included in the source code are some other ideas like the FRED:M1 and FRED:M2 (only on daily charts), the Yuan/Yen/EUR/USD, etc. There's lots of scope for correlating unrelated markets.
I'll keep updating it as I use it to find truly correlated assets. Some kind of signal line of known correlations, to subtract from the baseline fuzz of market activity.
Any improvements are most welcome; I'm a novice at best at statistics and build on others' work.
- mabonyi

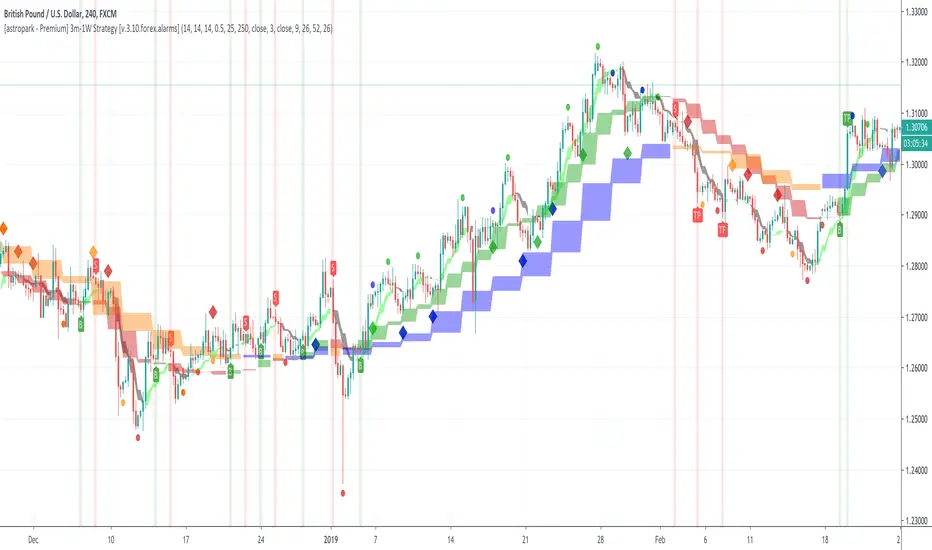
[astropark - Premium] Long-Short Strategy V3-FOREX [Alarms]This indicator is not holy grail , but it is an amazing trend finder and works nicely between 3m and 1W timeframes on FOREX :)))
With this indicator you can enjoy its trading signal and set the alarms you need!
In fact, if you want to set alerts on both buy, sell, take profit and stop-loss signals you must use this not-strategy indicator version!
This indicator is the non-strategy version of this one:
HOW TO USE THIS INDICATOR
Buy/Long when you see a green "B" label on the chart at best price you can, you have time till next candle's open price , trying to buy as low as possible near the green cloud or below it. Green cloud acts like a moving support for price, so use it for more buys/longs. The bigger the cloud, the stronger the bull-trend and so the support.
Sell/Short when you see a red "S" label on the chart at best price you can, you have time till next candle's open price , trying to sell as high as possible near the red cloud or over it. Red cloud acts like a moving resistance for price, so use it for more sells/shorts. The bigger the cloud, the stronger the bear-trend and so the resistance.
This indicator suggests some TP (Take Profit) for both longs (in green color) and shorts (in red color): you can start (at least partially!) closing the current trade (eventually you start new longs/shorts at cloud touch if you are a bold trader!).
Keep in mind that the lower the timeframe you work on, the easier is the trend to change rapidly, so always set a -2% / -5% stop-loss on trades and follow the trend with a nice trailing stop strategy.
Of course, as said at the beginning, this indicator suggests some TPs (Take Profits) for both longs (in green color) and shorts (in red color) operations: when you see a TP, you can start (at least partially!) taking profits over the current trade and move stop-loss higher (at least at break-even).
This is a premium indicator , so send me a private message in order to get access to this script.
Do you like my free scripts? Offer me a coffee, a beer, a pizza or whatever :)
BTC jar: 1K5kuYQPEqoNo6GRmJbHWMPmqwKM5S3oRR
ETH jar: 0x091b541a6dd6fe08c4e7bd909baafb2fce9b975e
LTC jar: LSVoAChsZrVsvbNyUfdpxtFpDAUSaUTUig
XRP jar: (XRP deposit tag) 103997763 (XRP deposit address) rEb8TK3gBgk5auZkwc6sHnwrGVJH8DuaLh
PS: Do you need a customization or do you need a dev who implements your strategy? send me a private message ;-)
Gold24fx IndicatorGold24fx
Class : hybrid – trend oscillator
Trading type : scalping
Time frame : 5 min
Purpose : detection of optimal buy entry points
Level of aggressiveness : high
Indicator « Gold24fx » was developed for scalping trading in Gold market. It can be used to define optimal buy entry points when the bullish sentiments prevail.
Indicator « Gold24fx » is based on unique author algorithm. It allows to provide quantitative assessments of current market sentiments as well as to visualize them. Also «Gold24fx» can detect divergences between current market price and fair value of the Gold for a specific moment of time. Local undervaluation of the Gold is a reason to generate a buy signal in situation when market is controlled by the bulls.
Thus Indicator «Gold24fx» provides sufficient data to the trader for the successful trading in the Gold market.
Structure of the indicator
Indicator consists of the following elements:
- Market sentiments curve – is presented with 3 color gammas: blue color (bullish sentiments are dominating), red color (bearish sentiments are dominating), green color (flat is present in the market),
- Red cross on the curve – a signal in favor of contraindications for buy trades. Can be related with bearish sentiments in the market or local overbought of the Gold;
- Green triangle on the curve – is a buy signal for short term Gold trades. It appears when the bullish market sentiments are prevail and asset is temporarily undervalued.
Rules of trading
Rules of trading are very simple. Blue color of the curve evidences in favor of bullish market sentiments. When the buy signal appears (green triangle on the curve) long position in Gold should be opened.

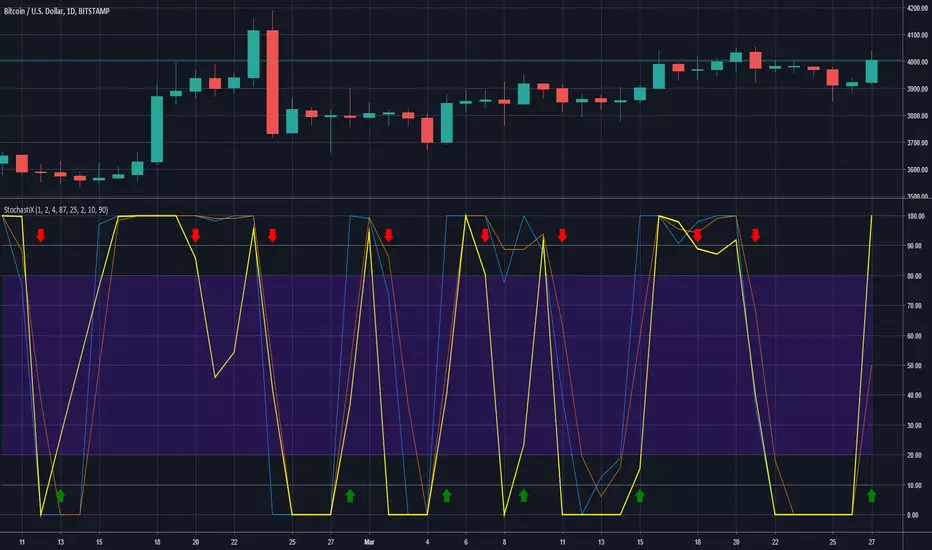
StochastiXThere ya go!!! You actually came to the best indicator there is out there. I hope you enjoy it. If you have any questions just hit me on the chat and i will answer you the best i can. Have a good one ;)
Intelligent Supertrend (AI) - Buy or Sell SignalIntroduction
This indicator uses machine learning (Artificial Intelligence) to solve a real human problem.
The artificial intelligence that operates this Supertrend was created by an algorithm that tests every single combination of input values across the entire chart history of an instrument for maximum profitability in real-time.
The Supertrend is one of the most popular indicators on the planet, yet no one really knows what input values work best in combination with each other. A reason for this is because not one set of input values is always going to be the best on every instrument, time-frame, and at any given point in time.
The "Intelligent Supertrend" solves this problem by constantly adapting the input values to match the most profitable combination so that no matter what happens, this Supertrend will be the most profitable.
Indicator Utility
The Intelligent Supertrend does not change what has already been plotted and does not repaint in any way which means that it is fully functional for trading in real-time.
Ultimately, there are no limiting factors within the range of combinations that have been programmed. The Supertrend will operate normally but will change input values according to what is currently the most profitable strategy.
Input Values
While a normal Supertrend would include two user-defined input values, the Intelligent Supertrend automates the input values according to what is currently the most profitable combination.
Additional Tools
The Optimised Supertrend is a tool that can be used to visual what input values the Supertrend AI is currently using. Additional tools to back-test this indicator will be added to this product soon.
For more information on how this indicator works, view the documentation here:
www.kenzing.com
For more information on the Supertrend view these fun facts:
www.marketcalls.in

Scalp God (top and bottom finder) (SATURN)I am very happy to present the Tradingview community the first of my new line of powerful indicators.
This is the SCALP GOD. It will clearly label market tops and bottoms for you, if you are scalping and looking to open or close a position this indicator will mark the local highs and lows for you. Or if you are a swing trader this can also give good signals as this indicator works on any pair and any timeframe! When you see the chart turning green you know for sure that a market top is forming, if the chart is turning red you know for sure a market bottom is forming. It is sometimes the absolute top or bottom and sometimes just an important local top or bottom. PM me if you find a better top & bottom indicator because I am trying to make this better than everything out there.
It absolutely can not repaint under any circumstances.
There are a few inputs for you to think about here:
-First is the length, this just decides how many previous bars to consider, making it longer will focus on more historical information while making shorter will make it focus on what has recently happened. 12 seems to be a good value, but it's not as important as the next two options.
-Next is the threshold value, setting it very low will mean that signals will get triggered very quickly, while a higher threshold will take more movement to trigger.
-Last and most important is the sensitivity value. A lower value here will make the signals much more sensitive and therefore able to flip and trigger faster. A higher sensitivity value will make the signals less sensitive and harder to flip, meaning that it will only look for movements that agree with the longer term trend. This is great for swing traders and scalpers that go with the trend.
-There is also a smoothening option, this will make it so the signals don't come on and off so much. Sometimes this will not be good for timing, but other times it will be a more certain signal for traders specifically looking for where the top or bottom ends.
It gets better because I added several of these indicators into one script, so if there is a particular set of sensitivities and thresholds that you like you can look at them all on the same chart without opening so many copies of this. To turn on an additional copy just check the "Sensitivity # On" box.
Everyone can try this for free for 3 days and after that it will be 0.025 BTC for lifetime use and this will include all future updates to this project. This is Project Saturn and this is the first indicator from a new series of indicators that will be coming out over the next year.
Hopefully this makes a lot of you rich! I'm very excited to see all of the uses people make with it.
Happy trading & good health!

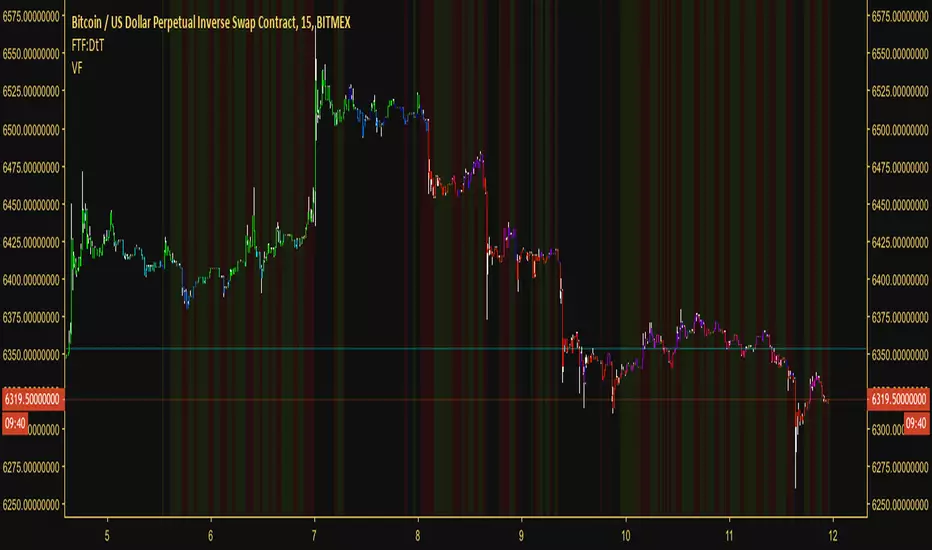
Volatility FilterOver the past few weeks (as of today, which is: 12th of October 2018) there has been little to no volatility in most of the major cryptocurrencies. What volatility does come in comes and goes very quickly. It's difficult to discern good and bad moments to be in a trade. As a result I decided to create a volatility filter based on Hurst exponent market phases, Bollinger Band width, moving averages, volume and the average true range. The results are the above.
You can use this indicator against any asset or within any market. It actually reaps excellent results against the DJI and XAUUSD One of my suggested uses for it is if you're scalping, only enter a position when there is volatility (when there's no background color present). If you're swinging, only enter a position when there's low volatility (when the red background color is present).
Another way to use it (although this isn't intended, just incidental) is to take a position in the direction of the first bar after the red background has gone/after low volatility has passed. So if we get a declining candle when we exit a low volatility zone, short. Otherwise long. This is the experimental side of it though.
However, this indicator won't tell you what direction to trade in, so in order to get use from it I suggest having a trend filter and a trigger. Luckily these two things are in most traders' arsenal. If not, take a look at my other script which is a timelessly brilliant trigger for buying and selling:
Something else to consider is that the volatility is relative. If we go through a period of incredibly high volatility then afterwards we can sometimes expect the volatility filter to plot a red background even though there is still acceptable volatility left in the market. The volatility at that point is much less than the volatility beforehand.
With all that said, this easy-to-read tool will help you avoid flat periods when scalping and, conversely, help you determine good times to enter a swing trade. For those who had difficulty trading the markets as of late due to volatility, this indicator is perfect for you
Access to the filter is provided for 10$, payable in most low-transaction-fee cryptocurrencies. Access is limited to 250 customers. For more information message me through TradingView or message @overttherainbow through Telegram.
Have a nice day and good luck trading.
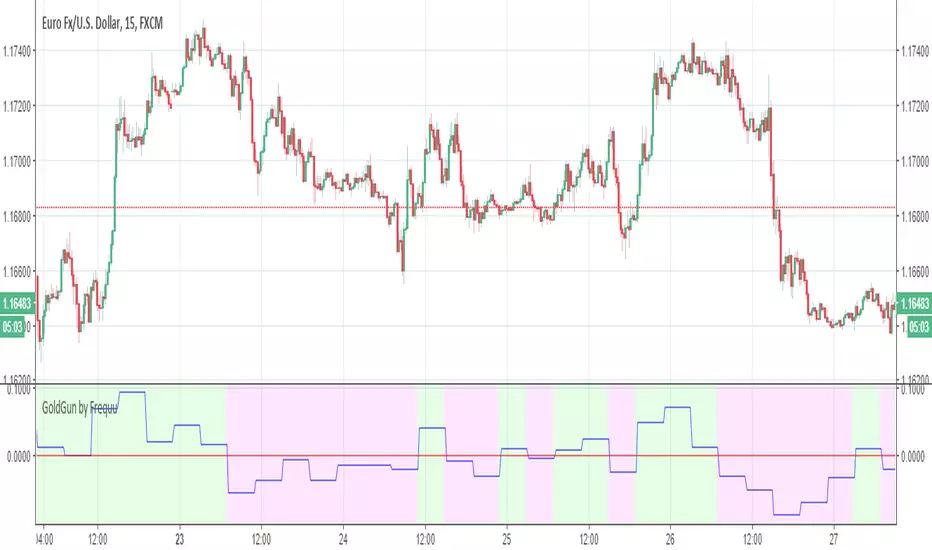
GoldGun by Frequu
Hi, I would like to present you the best script for manual / automatic trading
NO REPAINT
ALERT FIX
ALERT NO DOUBLE!
- ALL PAIR STOX (over 90%)
- GOLD (80-85%)
- and more more more ..
Script i`m testing on 1BROKER, binance and pepperstone, working brilliant !
Gap finder (gold minds)This tool highlights where gaps happens and outlines in the chart where the gap zones are. If there is a gap up there is a green line, a gap down it is red. The gap zone is highlighted in blue. You can choose the size of your gap with the input menu to the desired size. Feel free to ask comment below. Made for the Gold Minds group

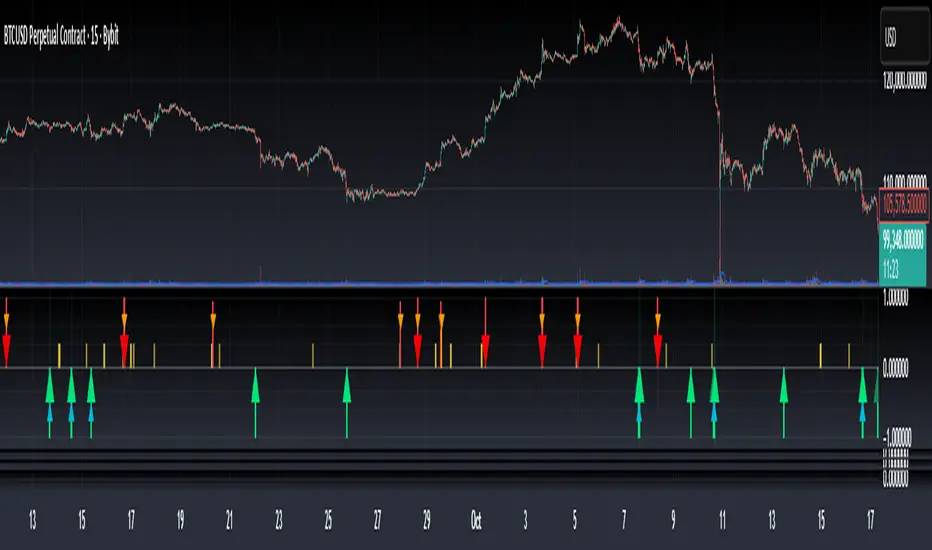
Bottom & Top Finder v3.0Bottom & Top Finder v3.0 is a proprietary multi-component oscillator designed to identify potential market reversals and extreme price conditions. The indicator analyzes momentum, volatility, and price behavior to generate bullish and bearish signals with strength classification.
█ OVERVIEW
Each signal is classified into three strength levels (Weak, Medium, Strong) allowing traders to prioritize high-conviction setups.
Signal Classification:
• Strong signals (±1.0): High conviction setups with multiple confirmations
• Medium signals (±0.6): Moderate conviction with key component alignment
• Weak signals (±0.33): Early warnings or preliminary indications
█ KEY FEATURES
Smart Signal Management
The indicator includes an intelligent system that allows signal sequences to complete naturally while preventing excessive noise. Unlike traditional cooldown systems that block all signals during a cooldown period, this implementation allows consecutive signals during a "run" and only applies cooldown after the signal run ends. This ensures complete multi-bar patterns are captured while preventing rapid flip-flopping.
Advanced Filtering System
Three optional filters allow adaptation to different market conditions:
• Volume Confirmation Filter: Validates signals against recent volume activity across a configurable lookback period. Checks if any bar in the lookback window exceeded average volume by the specified multiplier.
• Trend Alignment Filter: Four operational modes including With Trend, Counter Trend, Statistical Distance, or Off. The anomaly mode uses calculations to identify signals only at statistical extremes rather than simple directional bias.
• Signal Type Selection: Enable or disable weak, medium, and strong signals independently based on your trading style and risk tolerance.
Comprehensive Alert System
Ten distinct alert conditions cover every use case. Alerts include price level and timestamp, and are ready for webhook integration with automated trading systems.
█ HOW TO USE
Basic Setup
1 — Add "Bottom & Top Finder v3.0" to your chart in a separate indicator pane
2 — Optionally add "Bottom & Top Finder v3.0 - Chart Labels" for on-chart visual markers
3 — Configure lookback periods (defaults work well for most timeframes)
4 — Enable or disable signal strengths based on your trading style
5 — Apply filters as needed to reduce noise in your specific market
Signal Interpretation
Histogram magnitude indicates signal conviction. Multiple signal types can fire simultaneously and are aggregated into the composite score.
Alert Configuration
Set up alerts through TradingView's standard alert system using the built-in alert conditions. Choose from individual signal types (for specific setups) or aggregate alerts (for broader monitoring).
Recommended Approach
• Combine indicator signals with price action and support/resistance analysis
• Use strong signals for entries, weaker signals for early warnings or exits
• Enable filters when trading liquid markets with reliable volume data
• Adjust cooldown period based on timeframe: lower for active trading, higher for swing setups
• Start with default settings and adjust based on backtesting results
█ SETTINGS
Lookback Settings
• Main Lookback Period: Primary calculation period for most components (default: 21). Lower values increase sensitivity, higher values smooth signals.
• Range Lookback: Extended lookback for range high/low analysis (default: 50). Affects extreme condition detection.
Signal Settings
• Enable Weak Signals: Toggle weak signal detection (default: on)
• Enable Medium Signals: Toggle medium signal detection (default: on)
• Enable Strong Signals: Toggle strong signal detection (default: on)
Filter Settings
• Enable Volume Filter: Require volume confirmation (default: off)
• Volume Lookback: Period to check for volume spikes (default: 30)
• Volume Spike Multiplier: Threshold above average volume (default: 1.3x)
• Trend Filter Mode: Off, With Trend, Counter Trend, or Anomaly (default: off)
• Trend SMA Period: Moving average period for trend calculations (default: 50)
• Anomaly Threshold: Minimum statistical deviation for anomaly mode (default: 1.5)
Display Settings
• Show Composite Histogram: Toggle main histogram display (default: on)
• Show Signal Bars: Toggle triangle markers in indicator pane (default: on)
• Show RSI Reference: Overlay normalized RSI for context (default: off)
█ TIMEFRAME CONSIDERATIONS
The indicator works on any timeframe from 1-minute to monthly charts. However, optimal performance requires timeframe-appropriate configuration:
Shorter Timeframes (1m-15m)
Consider reducing main lookback period for increased responsiveness. Volume filter may be less reliable in some markets during low-liquidity sessions.
Medium Timeframes (1H-4H)
Default lookback periods are optimized for these timeframes. Volume and trend filters provide good noise reduction.
Longer Timeframes (1D+)
Consider increasing lookback periods for smoother signals. Filters are highly effective at these timeframes.
█ BEST PRACTICES
Risk Management
This indicator is a technical analysis tool designed to identify potential reversal zones and does not guarantee profitable trades. Users should:
• Understand that signals indicate potential setup zones, not guaranteed outcomes
• Employ proper position sizing and risk management on every trade
• Combine indicator signals with their own analysis and trading strategy
• Paper trade and backtest thoroughly before live implementation
• Never risk more than they can afford to lose
Signal Context
Indicator signals should be evaluated within broader market structure. Consider:
• Proximity to key support and resistance levels
• Overall trend direction and strength
• Market volatility and liquidity conditions
• Confluence with other technical indicators or patterns
• Fundamental factors that may override technical signals
█ NOTES
• All signals use confirmed bar data and do not repaint
• The cooldown system tracks top and bottom signals independently
• Multiple signal types can fire simultaneously; the composite score aggregates them
• Anomaly mode measures standard deviation magnitude, not just directional bias
• Volume filter checks any bar in the lookback period, not just the current bar
• Strong signals require more confirmations than medium or weak signals
Top Finder 1.1Top Finder is an automated cryptocurrency signals and analysis tool which uses a complex algorithm involving multiple indicators, trends, and cross-overs including proprietary formulas developed in-house to predict the top or near top price of cryptocurrencies. It also works well on stocks, gold, oil and forex, even soybeans!
Top Finder is the sister indicator to Bottom Finder (check my other scripts).
Signal strength is represented by height/color of the signal. (Taller signal = stronger signal).

Bottom Finder 2.2Release 2.2
Bottom Finder is an automated cryptocurrency signals and analysis tool which uses a complex algorithm involving multiple indicators, trends, and cross-overs including proprietary formulas developed in-house to predict the bottom price of cryptocurrencies. It also works well on stocks, gold, oil and forex!
Future updates will be included onto this script.
Tip #1: In a bear market, the Half height (fuchsia colored) signals should be ignored by the risk averse trader. In a bull market feel free to buy on both the signals.
Tip #2: In a bear market, use a smaller percent gain instead of TSSL to set your exit targets. In a bull do the opposite, using TSSL (or method of your choice) to exit.

Bottom Finder 2.1Release 2.1 Final!
Bottom Finder is an automated cryptocurrency signals and analysis tool which uses a complex algorithm involving multiple indicators, trends, and cross-overs including proprietary formulas developed in-house to predict the bottom price of cryptocurrencies. It also works well on stocks, gold, oil and forex!

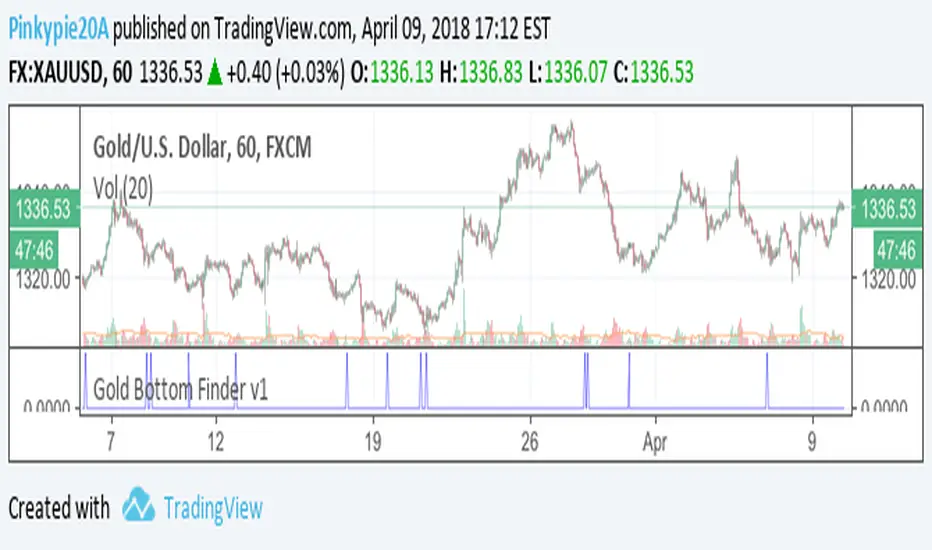
Gold Bottom Finder v1For the gold bugs, Bottom Finder Gold edition v1 script. If you would like to try it out, please post your access requests below.
min_Crypto_Thesis_indicator_MoriceauThis indicator is for minute candlestick and this back test work perfectly with Bitcoin and Gold.
The indicator tells you when you need to buy and sell your position. The backtest work at 86% of the last year.

Tick Tick BoomThis is THE tick tick boom method from the GOLD MINDS group!
When we enter a trade the line changes color.
If your charts are not in UTC time then you can adjust the UTC offset time. If your charts are in UTC-9 then set this to 9, if you are in UTC+1 set this to -1, if your charts are un UTC then set this to 0.
I noticed daily pivots, support, and resistance levels are pretty useful targets here. Uncheck the box if you would like to see the levels.
Many thanks to Dimitri Wallace!

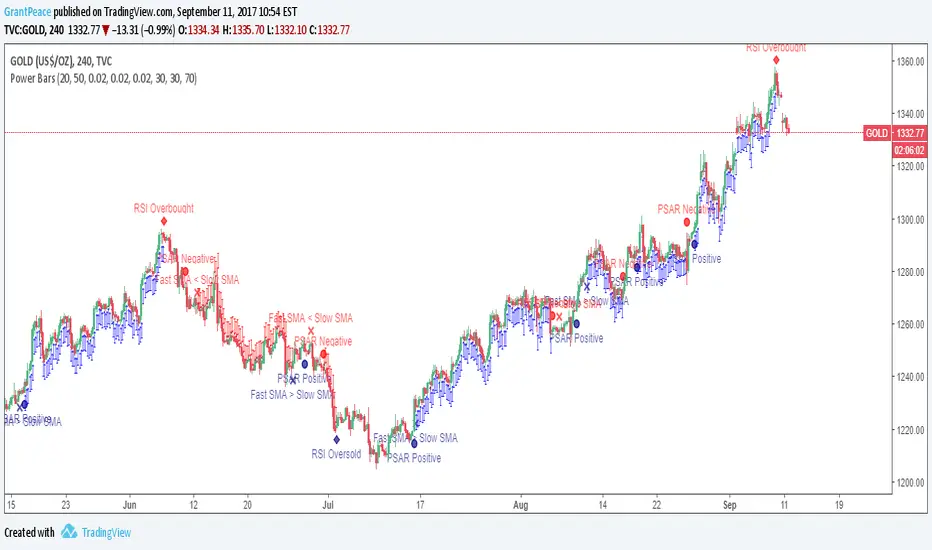
Power Bars This is the latest and greatest of technical analysis .
Values for your favourite indicators can easily be changed to customise your strategy.
When an indicator becomes bullish or bearish , a notification appears on the bar.
When all indicators align, Power Bars show up. Red Power Bars are bearish , blue Power Bars are bullish.
This is what the bars look like close-up.
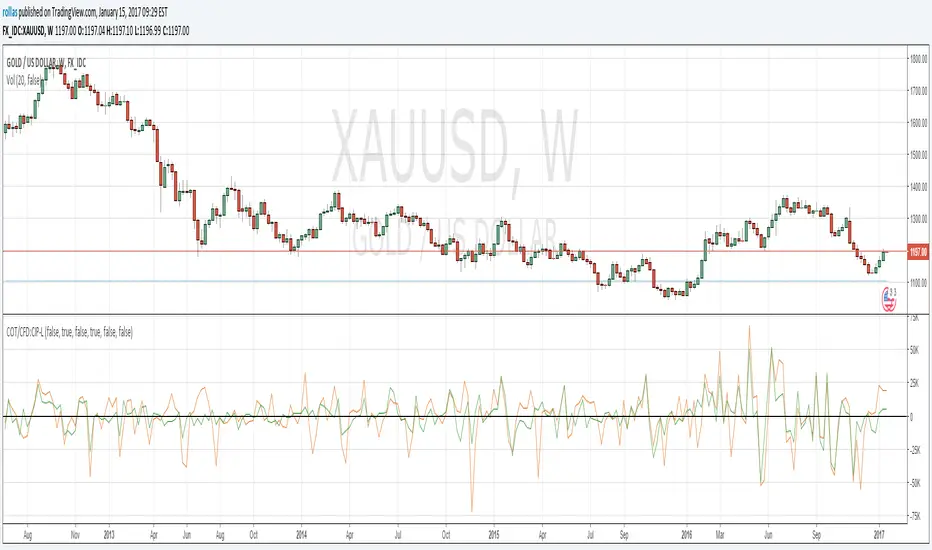
COT/CFD:CIP-LThe Commitments of Traders (COT) reports provide traders positions at the close of Tuesday's trading session. Reports show how many long and how many short contracts do traders of each category hold. This version covers the change in positions (CIP) in legacy format for CFD's. Default is Futures only. You can include Options from the input menu. From the style menu you can turn on or off different trader groups data. As the original data is weekly, charts will only work at weekly and upper time frames.