Higher High Lower Low Higher High Lower Low 🦉{Phanchai} — TradingView Description
Structure detector with dynamic Support/Resistance, customizable labels, and ready-made alerts (Pine v6).
This script marks market structure turning points — HH (Higher High), HL (Higher Low), LH (Lower High), LL (Lower Low) — and builds segmented Support/Resistance lines from those turns. Labels and colors are fully customizable and the script ships with multiple alert conditions.
What it does
Detects swing pivots using left/right bar windows, then classifies each confirmed swing as HH/HL/LH/LL.
Plots compact labels at the confirmed pivot bars with tooltips (English).
Derives dynamic Support / Resistance : every time structure flips, the previous level is closed and a new segment starts, extending to the right .
Provides alert conditions for any label and for specific first-occurrence shifts (e.g., first HH after a bearish label).
How it works (in short)
A pivot high/low confirms only after Right Bars candles have closed; labels and S/R appear at that confirmation bar.
An internal backbone (zigzag-like) is built from confirmed pivots, with light consistency checks to avoid contradictory sequences.
Structure rules compare the recent five pivots (A…E) to decide HH/HL/LH/LL.
S/R is updated from structure: e.g., in an up leg, new HLs refresh Support; in a down leg, new LHs refresh Resistance.
Alerts included
Any structure label (HH/HL/LH/LL) — Fires on any new label.
First LL after HL/HH — First bearish break after a bullish label.
First HH after LL/LH — First bullish break after a bearish label.
LL or HL formed — Any low-side label.
LH or HH formed — Any high-side label.
HL formed
HH formed
LL formed
LH formed
How to use (quick start)
Add the indicator to your chart.
Choose Left/Right Bars for your timeframe (e.g., 5–10 for intraday; larger for higher timeframes).
Pick your label colors/sizes and S/R style.
Right-click the chart → Add alert… → Condition: this indicator → select the desired alert.
Notes & tips
Because pivots require Right Bars to confirm, labels and S/R appear with a natural delay of that many bars. This avoids repainting.
Raising Left/Right Bars reduces noise and increases the average distance between pivots; lowering them increases sensitivity.
Structure is strict: sometimes you may see two HL (or two LH) in a row if the intermediate opposite swing didn’t qualify as HH/LH (or LL/HL).
S/R segments are drawn with line objects ; they are controlled via Inputs (style/width/color), not the Style tab.
This tool highlights structure; it’s not a standalone entry/exit system. Combine with volume, trend, or risk management rules.
Built with Pine v6. Clean, compact labels; segmented S/R that updates only on confirmed changes; comprehensive alerts ready for automation.
Higherlow

WLI Swing High/Low advnc indicatorfor Class members
else
label.set_xy(lowMsg, bar_index, close)
label.set_text(lowMsg, "making New Low")
label.set_color(lowMsg, newSwingLowColor)
label.set_textcolor(lowMsg, color.white)
else
if not na(lowMsg)
label.delete(lowMsg)
lowMsg := na

Buy and Sell Indicator This indicaor is draw time(ex 09:15 nifty 50) high and low of candle ..
for buy condition -
1) when price is crossing time candle high open a long trade
2) check for condition is this trade open less thn previous trade
if both condition are true thn open a buy trade
for sell condition -
1) when price is crossing time candle low open a short trade
2) check for condition is this trade open grater thn previous trade
if both condition are true thn open a sell trade
to build logic of 2nd condition @fikira help me thnx mate ...

Williams Fractals - LH/HLSame of original Williams Fractals, but with the following changes
- changed arrow directions
- added option to show Lower Highs and Higher Lows
- added alerts for Lower High and Higher Low
Enjoy~~

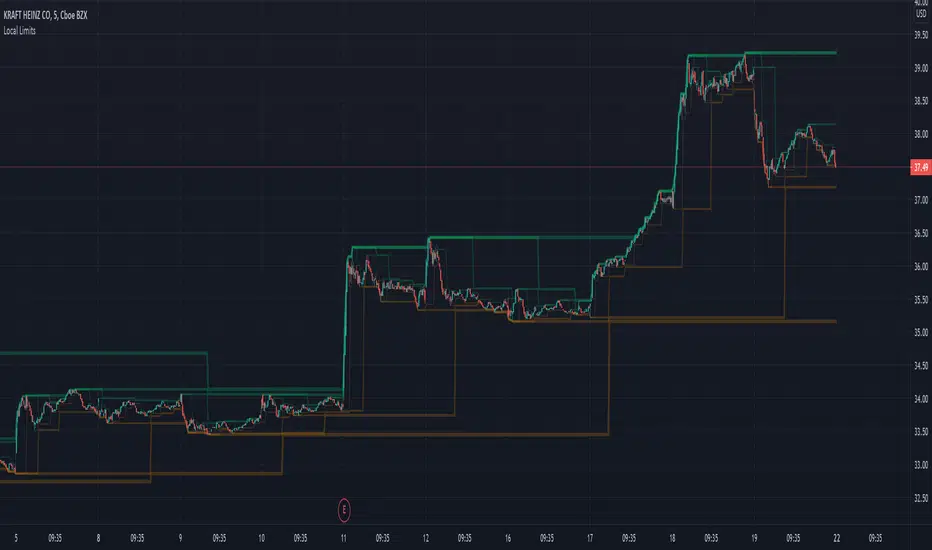
LocalLimitLibrary "LocalLimit"
Calculates the local upper or local lower limit for a given series. Applying multiple passes produces what appears like support or resistance levels.
See Local Limits for more detail.
upper(src) Produces the recent local upper limit for a given series.
Parameters:
src : The source series to derive from.
lower(src) Produces the recent local lower limit for a given series.
Parameters:
src : The source series to derive from.

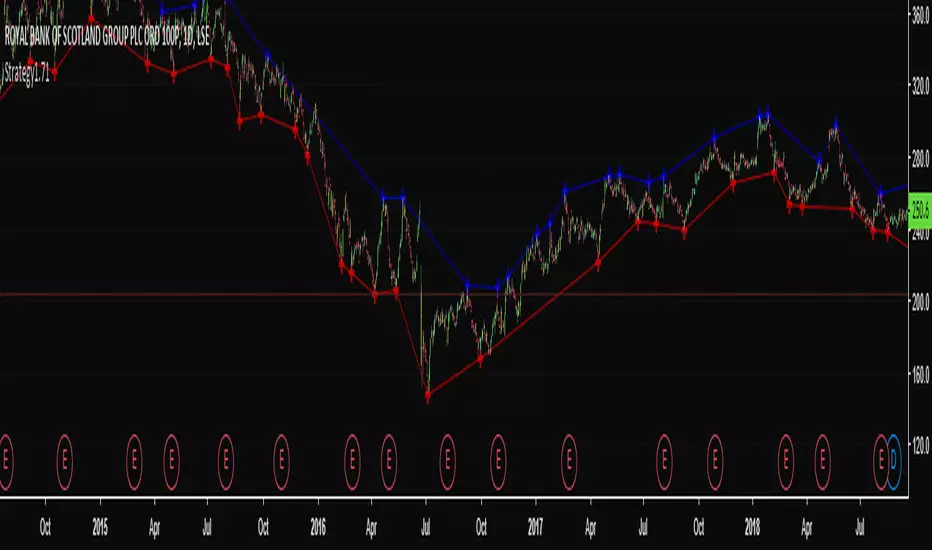
LH-LL/HL-HH Confirmation Trend LineBased on Dow Theory, a series of successive higher highs (HH) and higher lows (HL) is the sign of an uptrend (bull trend) and a series of successive lower highs (LH) and lower lows (LL) is the sign of a downtrend (bear trend).
So this script indicates the trends using the concept and draws corresponding trend lines.
It took some effort to make it possible for users to see as many trend lines as they wish. Eventually the user could set the number alongside some other options in the indicator settings.
Use the script and send me your thoughts!

Local LimitsDisplays recent higher highs, lower highs, lower lows, and higher lows as a collection of local limit indicators.
In its simplicity is a lot more powerful than might appear at first glance.
Does not rely on volatility calculation.
Can be linked together to create an objective view of recent support and resistance levels.
Makes current trends more visible.
Excellent for use as a trailing stop algorithm.
Parameters
Single Bar Sensitivity: True (default) reacts to individual bars. False only responds to the alignment of 2 bars.
Margin (1-5): Adds extra distance from higher lows and lower highs to reduce the sensitivity of broken trends.
Single indicators with configurable sources:
Local Limit Higher
Local Limit Lower
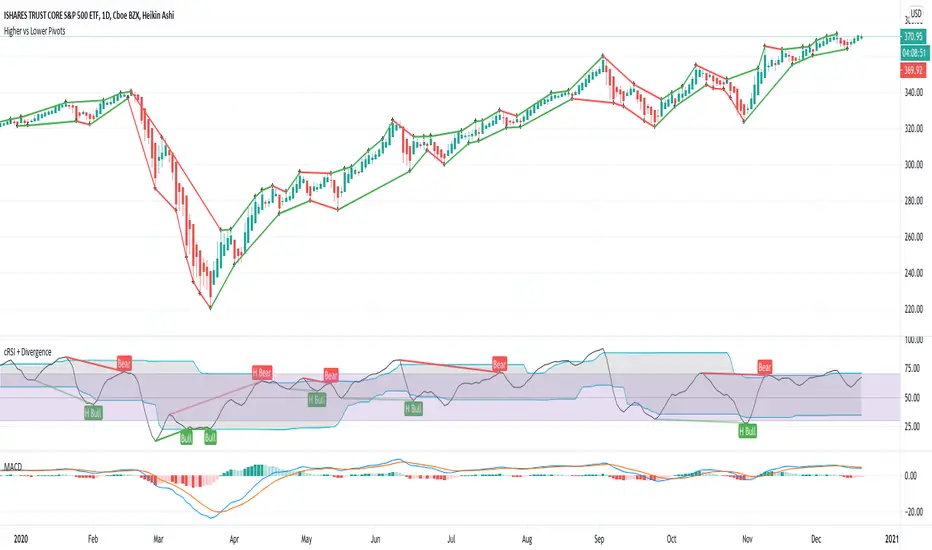
Higher vs Lower Pivots overlayA simple script that I made that draws lines between the high and low pivots. The color of the line define if the pivot is higher or lower than the previous pivot. The main thing to tune is the pivot look back vs look ahead, which are the same params used by the tradingview pivot indicator. There are several other params you can tweaks to get the look you want.
Double Zig Zag with HHLLHello Traders,
Here Double Zig Zag with HHLL script is with you. it calculates 2 Zig Zag simultaneously and draws them, and also it calculates and puts Higher High, Lower Low, Higher Low, Lower High labels. All these are done dynamically, it means last HH/HL/LL/LH can change. if price continues to go up then HL can turn to LL or if price continues to go down then LH can turn to HH. This script can be used for different purposes such trend analysis, support/resistance levels, breakouts etc.
I tried to make many things optional:
You can set Periods for Zig Zags as you wish
You can set different colors for both Zig Zag Up/Down lines
You have option to show both Zig Zag, one of them or none them
You have option to show both HHLL, one of them or none them
You can set Zig Zag 1 line style as Dashed or Dotted
You can set Line Widths for Zig Zags
Some examples:
Enjoy!

Swing Highs/Lows & Candle Patterns [LuxAlgo]This script labels swing highs and swing lows as well as the candle pattern that occurred at that precise point. The script can detect the following 6 candle patterns: hammer, inverse hammer, bullish engulfing, hanging man, shooting star, and bearish engulfing.
This indicator by its very nature backpaints by default, meaning that the displayed components are offset in the past.
🔶 USAGE
It can be interesting to see if a top or bottom is associated with a specific candle pattern, this allows us to study the potential of such a pattern to indicate a reversal. You can hover on a label with a specific pattern to see more details about it.
The notations HH, HL, LH, and LL you can see on the labels are defined as follows:
HH : Higher high
HL : Higher low
LH : Lower high
LL : Lower low
🔶 SETTING
Length: Sensitivity of the swing high/low detection, with lower values returning the maximum/minimum of shorter-term price variations.

Premarket High/LowThe script draws the high and low of the premarket session and based on these levels the ATR is added and also displayed on the chart as lines.
You can change:
- The Session Timeframe
- The ATR Multiple
- If the Aftermarket Session should be included

Swing PointsThis indicator gives a clear indication of price action swing-points as well as an indication of whether it is a higher, lower, or equal swing point relative to the last high/low.

High & Low Pivot Strategy v1.0A system that determines what direction the market is trending by analysing previous high and low pivot points to set up an entry trade.