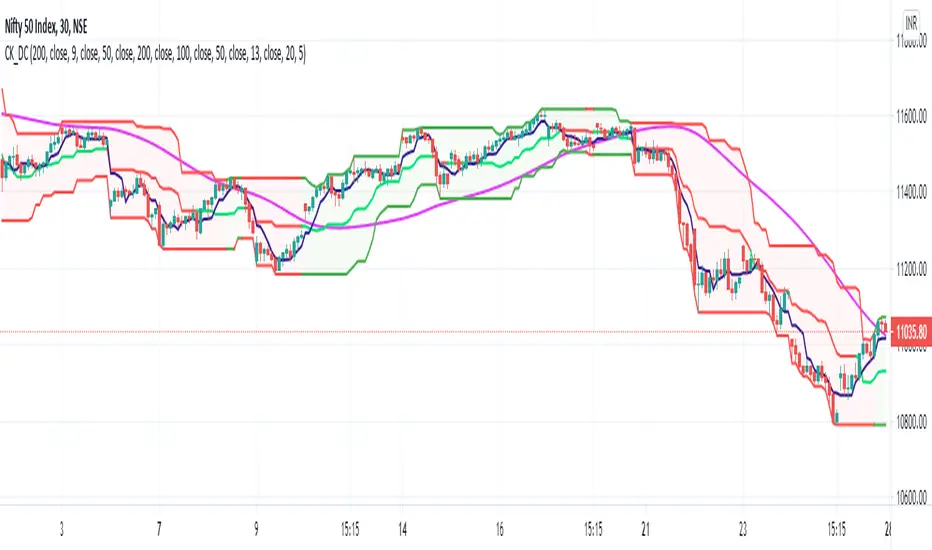
Modified Donchian ChannelRelease Note:
This indicator setup highly inspired by Donchian Channel and Hull Moving Average. Big thanks to both Richard Donchian and Alan Hull.
Back test and live test it and come to conclusion of how to use this indicator for live trading.
200 HMA:
200 Hull Moving Average plays major role in deciding the right trades using Donchian Channel. As part of this setup,
If price is below 200 HMA, then the Donchian Channel is highlighted in Red color
If price is above 200 HMA, then the Donchian Channel is highlighted in Green color
Donchian Channel:
Default 20 period is used for the Donchian channel. However, the color highlight as per 200 HMA position. Also, the middle basis color changes to Green and Red based on candle close of above or below.
Additionally, 5 period Donchian basis is used as tight stop loss. This can be used wisely or optionally based on trade decisions
Disclaimer:
//Idea of publishing this script is to identify the strength of the instrument using multiple confirmation.
//Using this indicator, changing inputs, and trading decisions are up to the users/traders.
//Courtesy: Thanks to Richard Donchian and Alan Hull as this indicator/script inspired by Donchian Channels and Hull Moving Average
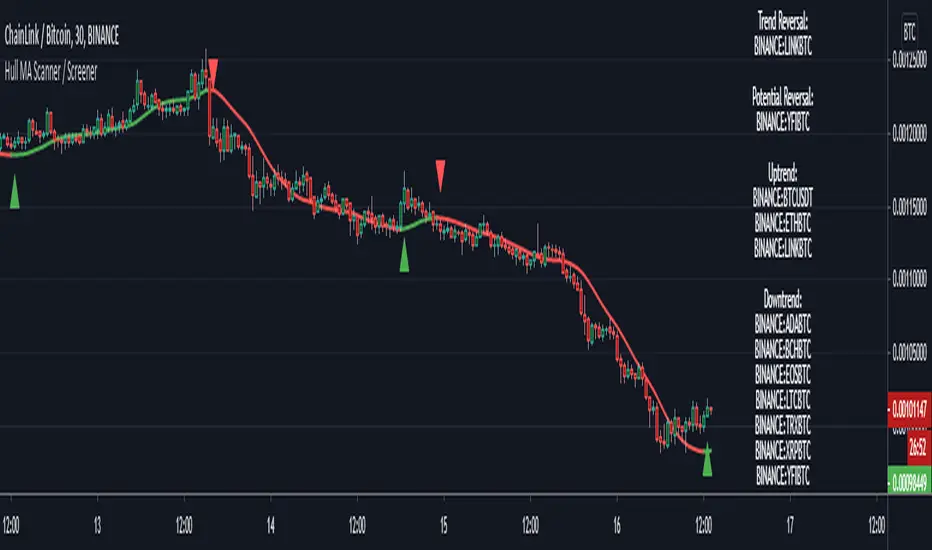
HMA
Hull MA Scanner / Screener LabelThis screens for Hull MA trend reversal's in 10 different securities. If the label color is not visible due to the text in it being white colored, then choose a different color from settings. Also added a simple HullMA to it. If want can increase it upto 40 securities in the code which is upto user to decide.
This was requested by soderstromkenan in comments and looked like a nice idea so decided to make it.
The Hull MA logic is from "Hull50" by u/RafaelZioni with his permission. Screener logic from u/Quantnomad with his permission.
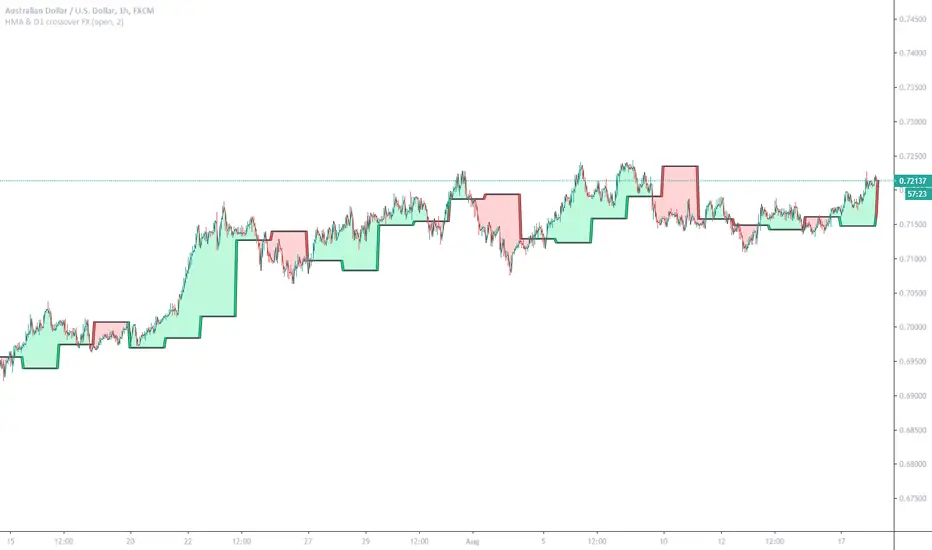
HMA & D1 crossover FX (Study)Can work on other Forex pairs if change settings: Period
This example tuned for AUDUSD (FX Version)
Enter new order on HMA ( Hull Moving Average ) and D1 ( Daily Candle) crossovers, Exit orders as basket when profit = Your Target Profit
This study version built for users of Alerts. Crossover of HMA and DailyCandle1 (and/or DailyCandle1 cross DailyCandle2) (also possible Price cross HMA)
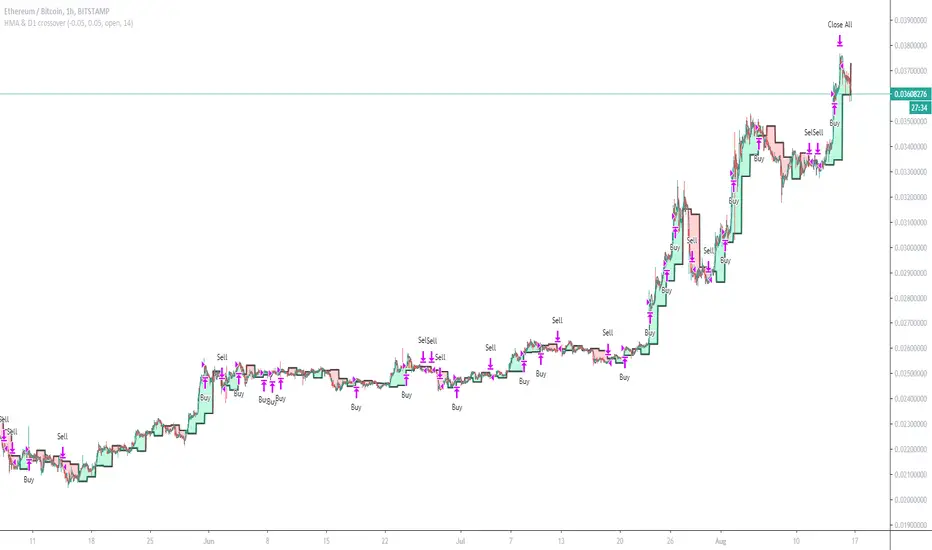
HMA & D1 crossoverCan work on Forex if change equity currency and SL and TP etc
This example tuned for ETH/BTC
Enters on HMA (Hull Moving Average) and D1 (Daily Candle) crossovers, Exits basket when profit = TP (Target Profit)
Has Commission and slippage added, test equity at 1 BTC lotsize set too 1% of equity for each order
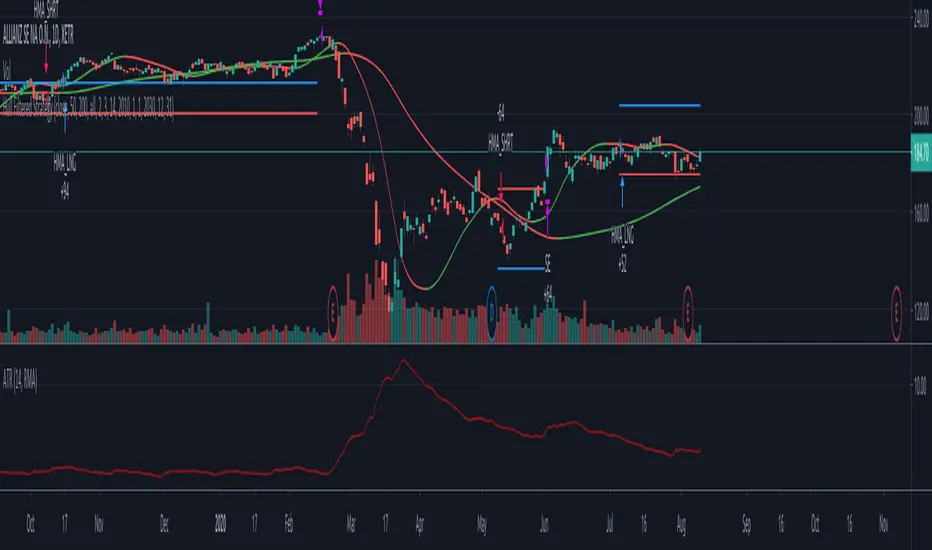
Hull Moving Average based strategyThis is a simple Hull Moving Average based strategy using a short term HMA for signal generation and a long term HMA for filtering purposes.
A long entry is generated if the short term HMA changes direction from decreasing to increasing values and if the long term HMA indicates an uptrend (i.e. previous value < current value)
A short entry is generated if the short term HMA changes direction from increasing to decreasing values and if the long term HMA indicates a downtrend (i.e. previous value > current value)
Positions are closed using an ATR based stop loss/take profit system. Stop Loss (red) and Take Profit (blue) levels are plotted on the chart.
Candle Color GeneratorCandle Color Generator:
This indicator is designed to highlight the candle colors based on the combinations of Parabolic SAR (PSAR) and 2 Hull Moving Averages (HMA).
Colors:
Yellow, Red, and Green colors are used to describe the candle colors depends on its position to PSAR and 2 HMAs.
PSAR:
PSAR position above or below candle position is differentiated by Red and Green colors
HMAs:
As default settings 20 HMA is considered as lower period and 50 HMA is considered period for the calculation
Trade What You See:
This indicator will help to see how the setup of particular instrument coming up. Users/Traders can use and trade based on what they see and interpret from it.
Disclaimer:
Idea of publishing this script is to identify the strength of the instrument using multiple confirmation.
Using this indicator, changing inputs (show/hide/change period), and trading decisions are up to the users/traders.
Courtesy:
Thanks to inventors of HMA (Alan Hull), PSAR(Welles Wilder) as these inputs are used to make some calculations

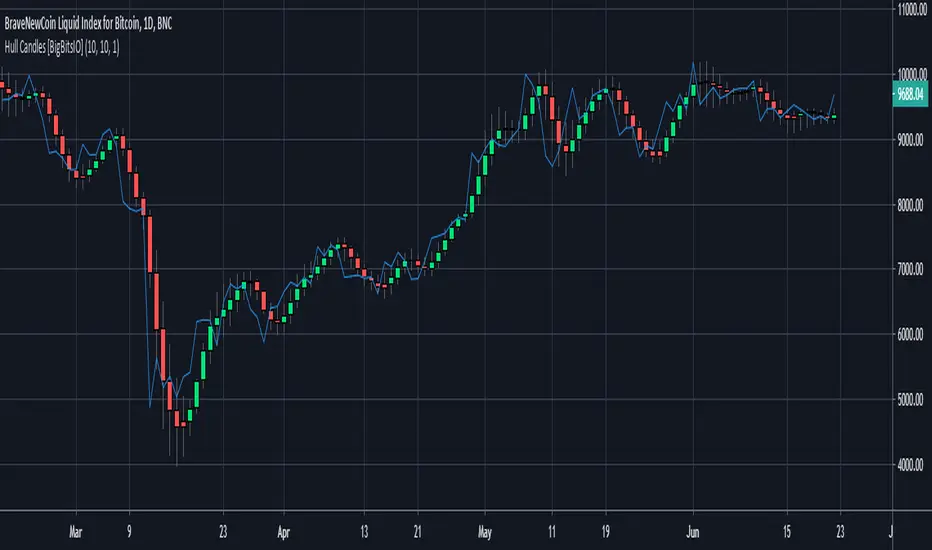
Hull Candles [BigBitsIO]This script is for custom candles based on an HMA calculation with a default period of 10 as well as an SMA of the close price, defaulted to 1 period to only show the current price. The purpose of the custom candles is to try and reduce noise from candles and help identify trends. These custom candles somewhat resemble Heikin-Ashi candles in their appearance.
Explained:
- Open, High, Low and Close (o, h, l, and c) are all calculated using an HMA calculation based on a user input length/period, defaulted at 10.
- Candle colors are determined by using the same HMA calculation on the ohcl4 and comparing it to the previous candle. Green candles have an ohlc4 greater than the previous candle, all other candles are red.
- The current price is plotted with the default blue line with an SMA calculation with 1 period to allow customization of smoothing if necessary to identify trends.
DISCLAIMER: For educational and entertainment purposes only. Nothing in this content should be interpreted as financial advice or a recommendation to buy or sell any sort of security or investment including all types of crypto. DYOR, TYOB.
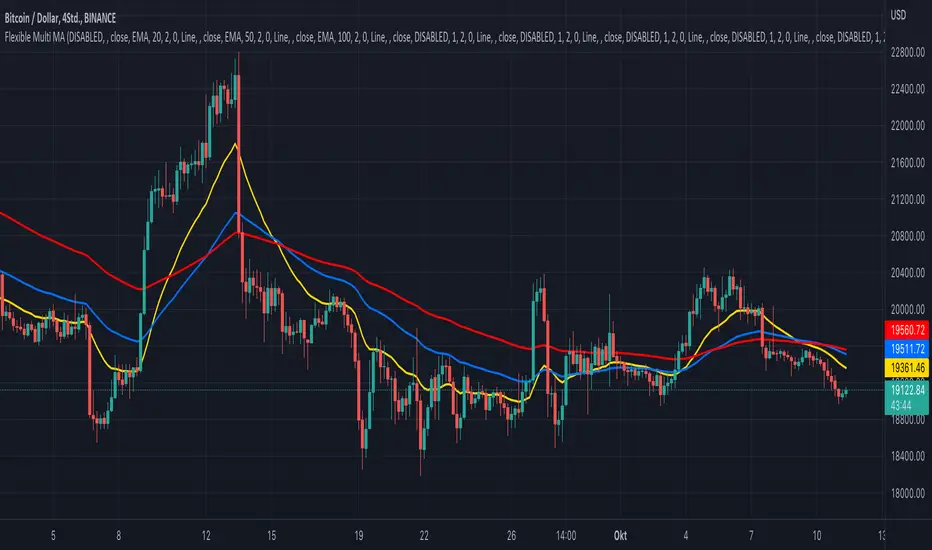
KINSKI Flexible Multi MA (EMA, SMA, RMA, WMA, VWMA, KAMA, HMA)This Multi Moving Average (MA) indicator is more flexible than any other indicator of this type offered so far. You can define up to 10 different Moving Average (MA) lines based on different calculation variants.
The following MA types can be configured.
- EMA: Exponentially Moving Average
- SMA: Small Moving Average
- RMA: Rolling Moving Average
- WMA: Weighted Moving Average
- VWMA: Volume Weighted Moving Average
- KAMA: Kaufman's Adaptive Moving Average
- HMA: Hull Moving Average
Which settings can be made?
- Selection for calculation formula ("Calculation Source"). The default value is "close".
- for each MA line the "Length" and the "Type" can be defined
- furthermore you can make layout adjustments via the "Style" menu
Colored Directional Movement and Bollinger Band's Cloud by DGTThis study combines Bollinger Bands, one of the most popular technical analysis indicators on the market, and Directional Movement (DMI), which is another quite valuable technical analysis indicator.
Bollinger Bands used in conjunction with Directional Movement (DMI) may help getting a better understanding of the ever changing landscape of the market and perform more advanced technical analysis
Here are details of the concept applied
1- Plots Bollinger Band’s (BB) Cloud colored based on Bollinger Band Width (BBW) Indicator’s value
Definition
Bollinger Bands (created by John Bollinger ) are a way to measure volatility . As volatility increases, the wider the bands become and similarly as volatility decreases, the gap between bands narrows
Bollinger Bands, in widely used approach, consist of a band of three lines. Likewise common usage In this study a band of five lines is implemented
The line in the middle is a Simple Moving Average (SMA) set to a period of 20 bars (the most popular usage). The SMA then serves as a base for the Upper and Lower Bands. The Upper and Lower Bands are used as a way to measure volatility by observing the relationship between the Bands and price. the Upper and Lower Bands in this study are set to two and three standard deviations (widely used form is only two standard deviations) away from the SMA (The Middle Line), hence there are two Upper Bands and two Lower Bands. The background between two Upper Bands is filled with a green color and the background between two Lower Bands is filled with a red color. In this we have obtained Bollinger Band’s (BB) Clouds (Upper Cloud and Lower Cloud)
Additionally the intensity of the color of the background is calculated with Bollinger Bands Width ( BBW ), which is a technical analysis indicator derived from the standard Bollinger Bands indicator. Bollinger Bands Width, quantitatively measures the width between the Upper and Lower Bands. In this study the intensity of the color of the background is increased if BBW value is greater than %25
What to look for
Price Actions : Prices are almost always within the bands especially at this study the bands of three standard deviations away from the SMA. Price touching or breaking the BB Clouds could be considered as buying or selling opportunity. However this is not always the case, there are exceptions such as Walking the Bands. “Walking the Bands” can occur in either a strong uptrend or a strong downtrend. During a strong trend, there may be repeated instances of price touching or breaking through the BB Clouds. Each time that this occurs, it is not a signal, it is a result of the overall strength of the move. In this study in order to get a better understanding of the trend and add ability to perform some advanced technical analysis Directional Movement Indicator (DMI) is added to be used in conjunction with Bollinger Bands.
Cycling Between Expansion and Contraction : One of the most well-known theories in regards to Bollinger Bands is that volatility typically fluctuates between periods of expansion (Bands Widening : surge in volatility and price breaks through the BB Cloud) and contraction (Bands Narrowing : low volatility and price is moving relatively sideways). Using Bollinger Bands in conjunction with Bollinger Bands Width may help identifying beginning of a new directional trend which can result in some nice buying or selling signals. Of course the trader should always use caution
2- Plots Colored Directional Movement Line
Definition
Directional Movement (DMI) (created by J. Welles Wilder ) is actually a collection of three separate indicators combined into one. Directional Movement consists of the Average Directional Index (ADX) , Plus Directional Indicator (+D I) and Minus Directional Indicator (-D I) . ADX's purposes is to define whether or not there is a trend present. It does not take direction into account at all. The other two indicators (+DI and -DI) are used to compliment the ADX. They serve the purpose of determining trend direction. By combining all three, a technical analyst has a way of determining and measuring a trend's strength as well as its direction.
This study combines all three lines in a single colored shapes series plotted on the top of the price chart indicating the trend strength with different colors and its direction with triangle up and down shapes.
What to look for
Trend Strength : Analyzing trend strength is the most basic use for the DMI. Wilder believed that a DMI reading above 25 indicated a strong trend, while a reading below 20 indicated a weak or non-existent trend
Crosses : DI Crossovers are the significant trading signal generated by the DMI
With this study
A Strong Trend is assumed when ADX >= 25
Bullish Trend is defined as (+D I > -DI ) and (ADX >= 25), which is plotted as green triangle up shape on top of the price chart
Bearish Trend is defined as (+D I < -DI ) and (ADX >= 25), which is plotted as red triangle down shape on top of the price chart
Week Trend is assumed when 17< ADX < 25, which is plotted as black triangles up or down shape, depending on +DI-DI values, on top of the price chart
Non-Existent Trend is assumed when ADX < 17, which is plotted as yellow triangles up or down shape, depending on +DI-DI values, on top of the price chart
Additionally intensity of the colors used in all cases above are defined by comparing ADX’s current value with its previous value
Summary of the Study:
Even more simplified and visually enhanced DMI drawing comparing to its classical usage (may require a bit practice to get used to it)
As said previously, to get a better understanding of the trend and add ability to perform some advanced technical analysis Directional Movement Indicator (DMI) is used in conjunction with Bollinger Bands.
PS: Analysis and tests are performed with high volatile Cryptocurrency Market
Source of References : definitions provided herein are gathered from TradingView’s knowledgebase/library
Disclaimer: The script is for informational and educational purposes only. Use of the script does not constitutes professional and/or financial advice. You alone the sole responsibility of evaluating the script output and risks associated with the use of the script. In exchange for using the script, you agree not to hold dgtrd tradingview user liable for any possible claim for damages arising from any decision you make based on use of the script

Squeeze Momentum Indicator [LazyBear] vHMAThis is a remake of the famous LazyBear Indicator, the Squeeze Momentum Indicator.
All i did was take out the SMA's and replace them with HMA's. HMA is a more responsive moving average.
Hull Moving Average.
This is a derivative of John Carter's "TTM Squeeze" volatility indicator, as discussed in his book "Mastering the Trade" (chapter 11).
Black crosses on the midline show that the market just entered a squeeze ( Bollinger Bands are with in Keltner Channel). This signifies low volatility , market preparing itself for an explosive move (up or down). Gray crosses signify "Squeeze release".
Mr.Carter suggests waiting till the first gray after a black cross, and taking a position in the direction of the momentum (for ex., if momentum value is above zero, go long). Exit the position when the momentum changes (increase or decrease --- signified by a color change). My (limited) experience with this shows, an additional indicator like ADX / WaveTrend, is needed to not miss good entry points. Also, Mr.Carter uses simple momentum indicator , while I have used a different method (linreg based) to plot the histogram.
More info:
- Book: Mastering The Trade by John F Carter
Here is the original version:

TA Basics: Evolving our Zero Lag Moving Average.In the previous Zero-Lag MA post, we introduced the "mirroring" technique and the associated calculation.
In this post, we will see how we can use the same technique, with a slight variation, to evolve our zero lag moving average line, add more "smoothness" and still maintaining the low lag and fast response to data series changes.
to use the "mirroring" technique, we need to use 2 MA lines with varying speeds - this is essential to produce the delta between the lines, that can then be mirrored around the fast line to produce the final line. in the first example, we used a Simple MA (slow) and a Weighted MA (fast) of the same length to achieve that.
here we introduce a different way of doing that. we will use a Weighted MA of the length (slow) and another Weighted MA of half the length (fast) -- the difference in "speed" between these 2 lines should produce the delta we need, we mirror it around the fast line, and we get our desired Zero-lag line. Check!
then while we're at it, why don't we introduce an additional smoothing just to ensure the new line is not too "broken" and jumpy .. and flows smoothly across the data series. but what length should we use for smoothing?
smoothing length should be enough to make an actual smoothing effect, but not too large else it will introduce lagging on its own. how about 3? usually 3 or 4 are good values for smoothing. A brilliant idea here is to use a number related to the same input length of the original line, which can always be relatively small -- the square root (integer portion) of that original length - and in that case, the user will only need to enter 1 input for the moving average, just the length - everything will be calculated from there. Check again!
I commented the code if you like to follow the simplified build-up of the formula, now that the concept is explained.
the (more complex-looking) 1-line, condensed form of that formula to use is (alert: watch out for the ()'s -- they're tricky :) )
----------------------------------------------
ZLMA_Line = wma((2*wma(close,int(length/2)) - wma(close,length)), int(sqrt(length)))
------------------------------------------
the one thing i do not like about this technique, is that we introduce the use of the half length MA. i do not like to build indicators that make decisions like this on behalf of the trader - the trader wants to analyze the data for a specific length, and we should continue to stick to that consistently across the moving average (or whatever indicator) calculation. I would always be caution about "hardcoding" some optional values (in this case 0.5 * length) within the indicator itself - others may not mind that.
Now to a nice surprise for the patient folks who got so far in this post - Congratulations, we have just discovered the concept and the formula behind the famous Hull Moving Average .. the big thing here is, we just had the opportunity to learn how to create the whole thing ourselves from the ground up step by step, and had fun doing it (I hope!)
-- these posts are meant to provide those who are new to the world of technical analysis and want to learn how and why to build their own technical indicators. i hope some of you find them useful and interesting, and i wish you the best of luck.

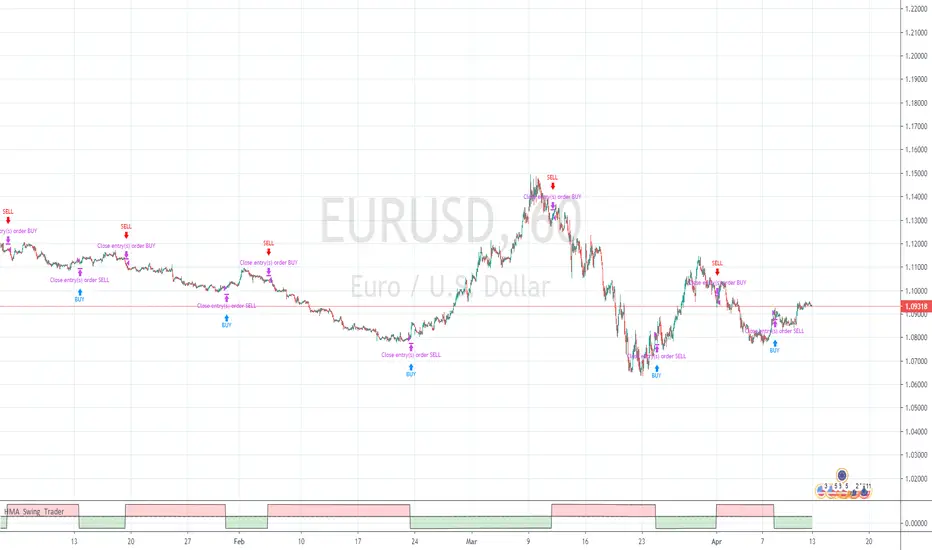
Hull Moving Average Swing TraderHull Moving Average Strategy
2 X HMA's,
1st HMA on current price (recommended source OPEN)
2nd HMA on previous candle. signal on crossover.
Buy and Sell signals on chart, red & green view pane (Green Buy, Red Sell)
Bollinger Bands Plus [xdecow]Bollinger bands with the option to use different types of moving averages.
-SMA
-EMA
-RMA
-WMA
-VWMA
-SWMA
-DEMA
-HMA
-SMMA
-T3
-TEMA

HMA-Crossover AlertsThis simple script plots bullish and bearish Hull Moving Average Crossovers and fires Alerts when long or short conditions are met.

Moving Averages Linear CombinatorLinearly combining moving averages can provide relatively interesting results such as a low-lagging moving averages or moving averages able to produce more pertinent crosses with the price.
As a remainder, a linear combination is a mathematical expression that is based on the multiplication of two variables (or terms) with two coefficients (also called scalars when working with vectors) and adding the results, that is:
ax + by
This expression is a linear combination , with x/y as variables and a/b as coefficients. Lot of indicators are made from linear combinations of moving averages, some examples include the double/triple exponential moving average, least squares moving average and the hull moving average.
Today proposed indicator allow the user to combine many types of moving averages together in order to get different results, we will introduce each settings of the indicator as well as how they affect the final output.
Explaining The Effects Of Linear Combinations
There are various ways to explain why linear combination can produce low-lagging moving averages, lets take for example the linear combination of a fast SMA of period p/2 and slow simple moving average of period p , the linear combination of these two moving averages is described as follows:
MA = 2SMA(p/2) + -1SMA(p)
Which is equivalent to:
MA = 2SMA(p/2) - SMA(p) = SMA(p/2) + SMA(p/2) - SMA(p)
We can see the above linear combinations consist in adding a bandpass filter to the fast moving average, which of course allow to reduce the lag. It is important to note that lag is reduced when the first moving average term is more reactive than the second moving average term. In case we instead use:
MA = -2SMA(p/2) + 1SMA(p)
we would have a combination between a low-pass and band-reject filter.
The Indicator
The indicator is based on the following linear combination:
Coeff × LeadingMA(length) - (Coeff-1) × LaggingMA(length)
The length setting control both moving averages period, leading control the type of moving average used as leading MA, while lagging control the type of MA used as lagging moving average, in order to get low lag results the leading MA should be more reactive than the lagging MA. Coeff control the coefficients of the linear combination, with higher values of coeff amplifying the effects of the linear combination, negative values of coeff would make a low-lag moving average become a lagging moving average, coeff = 1 return the leading MA, coeff = -1 return the lagging MA. The leading period divisor allow to divide the period of the leading MA by the selected number.
The types of moving average available are: simple, exponentially weighted, triangular, least squares, hull and volume weighted. The lagging MA allow you to select another MA on the chart as input.
length = 100, leading period divisor = 2, coeff = 2, with both MA type = SMA. Using coeff = -2 instead would give:
You can select "Plot leading and lagging" in order to show the leading and lagging MA.
Conclusion
The proposed tool allow the user to create a custom moving averages by making use of linear combination. The script is not that useful when you think about it, and might maybe be one of my worst, as it is relatively impractical, not proud of it, but it still took time to make so i decided to post it anyway.


Fancy Moving Average [BigBitsIO]This script is for a single moving average with as many features as I can possibly fit into a single moving average. If you can think of more, or have questions regarding this script, please message me or contact me via social media.
Features:
- A single moving average (MA).
- Standard MA inputs.
- MA type.
- MA period.
- MA price.
- MA resolution (time frame).
- Visibility toggle.
- Fancy MA inputs.
- Toggle to show only candles included in the MA calculation ("Highlight inclusion") or display entire MA history.
- Toggle to show a ghost trail when Highlight inclusion is toggled on. Displays a shaded version of past MA history before the inclusion period (as seen on snapshot).
- Toggle to show forecast values for the MA.
- Other inputs related to forecasting:
- Forecast bias. (Neutral forecasts MA if the current price remains the same.)
- Forecast period.
- Forecast magnitude.
*** DISCLAIMER: For educational and entertainment purposes only. Nothing in this content should be interpreted as financial advice or a recommendation to buy or sell any sort of security or investment including all types of crypto. DYOR, TYOB. ***

Multiple MAsYou can set up to 5 moving averages (or more if you know how to edit the script), selecting from SMA, EMA, HMA, WMA, DEMA, TEMA or RMA. Select the source and the period for each MA.
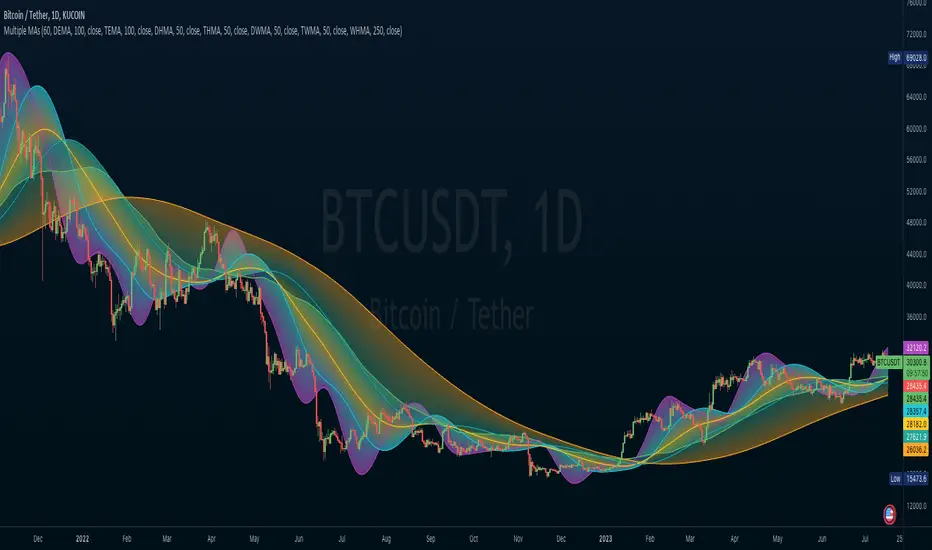
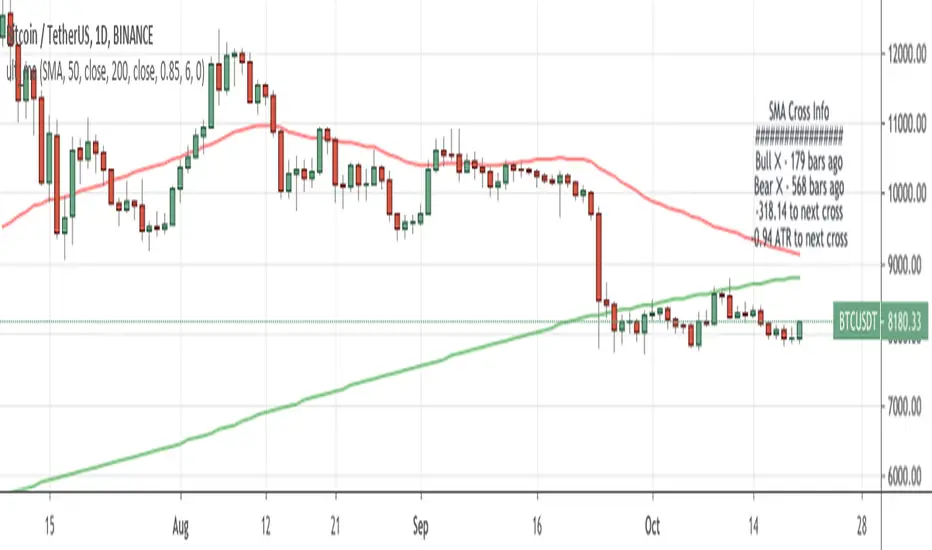
Ultimate MA Cross IndicatorContinue to experiment with new labels functionality in TradingView. Created ma cross script with 9 different types of MA wit additional information box. In that box, I included the bars passed from the previous bull/bear cross.
Also you cand find there live distance between moving averages in price and ATRs , so you track how close are you from the next close.
Do you think this concept is useful? What information do you want to see in this kind of boxes?
These ma types are included in this indicator:
Simple Moving Average ( SMA )
Exponential Moving Average ( EMA )
Weighted Moving Average ( WMA )
Arnaud Legoux Moving Average ( ALMA )
Hull Moving Average ( HMA )
Volume-weighted Moving Average ( VWMA )
Least Square Moving Average ( LSMA )
Smoothed Moving Average ( SMMA )
Double Exponential Moving Average ( DEMA )
Hull SuiteHull is its extremely responsive and smooth moving average created by Alan Hull in 2005.
Minimal lag and smooth curves made HMA extremely popular TA tool.
alanhull.com
Script was made to regroup multiple hull variants in one indicator,maintaining flexible customization and intuitive visualization
Option to chose between 3 Hull variations
Option to chose between 2 visualization modes ( Bands or single line)
Option to Paint hull and/or candlesticks according to hulls trend
Shortcut for personalizing Line/band thickness,instead of changing every object manually ,there is global option in inputs
HMA
THMA ( 3HMA)
EHMA
HMA:
Alan Hull
EHMA:
Slower than hull by default.
Raudys, Aistis & Lenčiauskas, Vaidotas & Malčius, Edmundas. (2013). Moving Averages for Financial Data Smoothing ( 403. 34-45. 10.1007/978-3-642-41947-8_4.) Vilnius University, Faculty of Mathematics and Informatics
3HMA (THMA) :
Documentation on link below
alexgrover


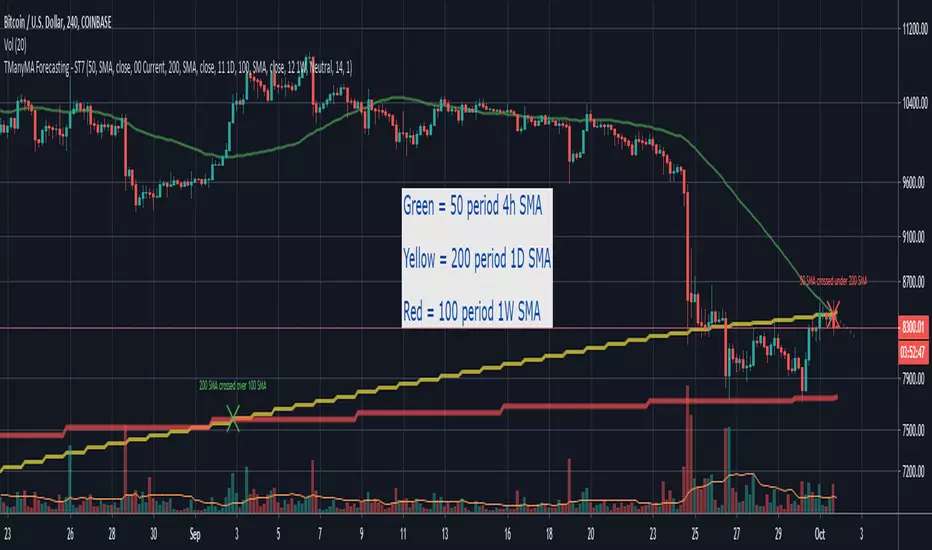
Scripting Tutorial 7 - Triple Many Moving Averages ResolutionsThis script is for a triple moving average indicator where the user can select from different types of moving averages, price sources, lookback periods and resolutions.
Features:
- 3 Moving Averages with variable MA types, periods, price sources, resolutions and the ability to disable each individually
- Crossovers are plotted on the chart with detailed information regarding the crossover (Ex: 50 SMA crossed over 200 SMA )
- Forecasting available for all three MAs. MA values are forecasted 5 values out and plotted as if a continuation to the MA.
- Forecast bias also applies to all forecasting. Bias means we can forecast based on an anticipated bullish, bearish or neutral direction in the market.
- To understand bias, please read the source code, or if you can't read the code just send me a message on here or Twitter. Twitter should be linked to my profile.
This script is meant as an educational script with well-formatted styling, and references for specific functions.
Scripting Tutorial 6 - Triple Many Moving Averages ForecastingThis script is for a triple moving average indicator where the user can select from different types of moving averages, price sources and lookback periods.
Features:
- 3 Moving Averages with variable MA types, periods, price sources and ability to disable each individually
- Crossovers are plotted on the chart with detailed information regarding the crossover (Ex: 50 SMA crossed over 200 SMA )
- Forecasting available for all three MAs. MA values are forecasted 5 values out and plotted as if a continuation to the MA.
- Forecast bias also applies to all forecasting. Bias means we can forecast based on an anticipated bullish, bearish or neutral direction in the market.
- To understand bias, please read the source code, or if you can't read the code just send me a message on here or Twitter. Twitter should be linked on my profile.
This script is meant as an educational script with well-formatted styling, and references for specific functions.
