Ichimoku Horizon v.3Ichimoku Horizon v3 – Multi-TF Ichimoku with auto-map & TF legend
Ichimoku Horizon v3 plots classic Ichimoku on your current chart timeframe and projects up to 3 higher timeframes (TF1 / TF2 / TF3) on the same chart. The goal is to keep one clean chart while still seeing Daily / Weekly / Monthly Ichimoku context.
On the current chart timeframe, the script plots:
Tenkan-sen, Kijun-sen
Senkō Span A & B (Kumo)
Chikō Span
An optional Kumo Midline (midpoint between SSA and SSB)
Note: the Kumo Midline is not part of the original Ichimoku, it is just an additional visual helper.
It is calculated as the simple average of the two cloud boundaries:
Midline = (SSA + SSB) / 2.
You can turn it ON/OFF globally and per timeframe.
The same logic (including the optional Midline) is applied to TF1 / TF2 / TF3 and projected onto your main chart.
Auto-map & presets
You control how TF1 / TF2 / TF3 are selected with:
Auto-map TF from chart (ON/OFF)
When ON, the script automatically chooses a profile based on your chart TF (Scalp / Intraday / Swing / Long Term / Investment / Macro).
TF1 / TF2 / TF3 are always higher than the chart timeframe in a consistent way.
Preset Time Frame (when Auto-map = OFF)
When OFF, you pick a fixed preset such as:
Scalp S — 1m / 5m / 15m
Intraday L — 1H / 4H / 1D
Swing — 1D / 1W / 1M
Investment — 1M / 3M / 6M
Macro — 3M / 6M / 12M
If you choose Custom, you manually set TF1 / TF2 / TF3 via the three “Timeframe selection” inputs in the TF1 / TF2 / TF3 sections.
This lets you switch between scalp / intraday / swing / macro profiles without editing the code.
TF legend (banner) & display options
The indicator includes an optional TF banner (panel) that acts as a legend:
Shows the active profile name (Scalp, Intraday M, Intraday XL, Swing, Long Term, Macro, Custom).
Displays the three mapped timeframes (TF1 / TF2 / TF3) in short form (5m, 1H, 4H, 1D, 1W, 1M, etc.).
Shows TK / KJ plus small colored squares for Tenkan and Kijun for each TF, matching the line colors on the chart.
You can control:
Show / hide the banner.
Position: Top/Bottom Left, Center, Right.
Text color, background, text size.
Each block (Chart, TF1, TF2, TF3) also has its own toggles for Tenkan, Kijun, Chikō, SSA, SSB, Kumo fill and Kumo Midline, so you can keep only what you really need (for example: just HTF Kijun + HTF Kumo).
Color design
A specific effort has been made on the color design:
Each timeframe uses its own color family (warm for the chart, green for TF1, blue for TF2, neutral/grey for TF3) so it stays readable even when all TFs are displayed.
Kumo fills are semi-transparent to give context without hiding price action.
Defaults are tuned for light charts, and every color can be customized if you prefer another palette.
Built-in alerts
The script includes a small set of ready-to-use alerts, controlled by a global Enable alerts switch and a built-in cooldown to avoid spam. Available conditions:
TK>KJ (UP) – Tenkan crosses above Kijun on the chart timeframe (filtered by bullish HTF bias).
TK Kijun (full bullish alignment).
All TF Bearish – Chart + TF1 + TF2 + TF3 all show Tenkan < Kijun (full bearish alignment).
HTF Confirms (BULL) – Bullish TK cross on the chart, with HTF support and price above the cloud.
HTF Confirms (BEAR) – Bearish TK cross on the chart, with HTF support and price below the cloud.
Just add an alert on the indicator, choose one of these conditions, and use “Once per bar close” for cleaner signals.
No-repaint logic
Higher-timeframe data is fetched with request.security() using:
barmerge.gaps_off
barmerge.lookahead_off
There is no artificial lookahead and no repainting, apart from the normal forward shift of the Ichimoku cloud, which is how standard Ichimoku works by design.
If the panel/labels stick to the left
On some devices or after layout changes, TradingView can bug and draw tables/labels stuck on the left or misaligned.
If you see the TF banner or right-side labels not updating correctly:
Clear the TradingView app cache (or restart the app/browser),
Then reload the chart.
This usually forces TradingView to redraw all tables and labels correctly and fixes the “stuck on the left” display issue.
Disclaimer
This script is provided for educational and informational purposes only.
It does not constitute financial or investment advice, and it should not be used as a signal provider on its own.
Always do your own analysis and use proper risk management before taking any trade.
Thanks for using Ichimoku Horizon v3
Ichimoku Cloud

Gold Rush - Bot Enabled - MT5Exclusive for XAUUSD in 15m chart.. Bot enabled to support MT5..
Don't change any settings.. Enable Debugger and see the results..

Ichimoku Cloud (Auto Crypto/Non-Crypto settings)Save the hassle of switching back and forth between crypto and non-crypto settings by using the `syminfo.type` value under the hood.
If it's crypto it uses the 20, 60, 120, 30 settings, otherwise it uses 18, 52, 104, 26 defaults.
You can always override it using the Market Mode input in the settings.
The settings type is displayed in the top right of the chart as either "Crypto Cloud" or "Legacy Cloud" so you know which settings are being applied.

Smart Cloud by Ilker (Custom Matriks)A Proprietary Hybrid Trend System for All Major Financial Assets
This indicator, originally developed for the Matriks platform, is a highly effective hybrid trend identification system designed for day-to-day analysis across all major asset classes, including Stocks, Forex, Indices, and Cryptocurrencies. It combines the forward-looking principle of the Ichimoku Kinko Hyo Cloud with heavily smoothed Moving Averages (MAs) to create a clear, visually guided trading signal. (Daily Timeframe recommended for optimal results).
📊 Algorithmic Structure and Parameters
The "Smart Cloud" utilizes six primary user-adjustable parameters that govern its sensitivity and shape, moving away from standard Ichimoku settings to provide a robust, customized trend view:
P1, P2, P3 (60, 56, 248): These long-term settings define the core structure and width of the cloud, acting as the primary dynamic support and resistance zone. The significantly longer P3 (Lagging Period) ensures the cloud reflects strong, deep market cycles.
P4 (Displacement 26): Maintains the traditional Ichimoku principle of projecting the cloud 26 periods forward to provide a predictive view of future trend support/resistance.
P5 (MA50 - Blue) & P6 (MA10 - Purple): These are the two primary Moving Averages plotted inside the cloud. They serve as fast-response momentum lines:
P5 (MA50): Represents the middle-term trend average.
P6 (MA10): Represents the short-term market momentum.
📈 Core Trend and Signal Interpretation
The indicator provides powerful trend identification based on three key components:
The Cloud (Kumo):
Green Cloud (Bullish): Indicates the dominant trend is up, suggesting dynamic support for price action.
Red Cloud (Bearish): Indicates the dominant trend is down, suggesting dynamic resistance.
The thickness and slope of the cloud are key indicators of trend strength.
MA Crossover Signal (Blue/Purple):
Buy Signal: When the faster Purple MA (P6=10) crosses above the slower Blue MA (P5=50).
Sell Signal: When the faster Purple MA (P6=10) crosses below the slower Blue MA (P5=50).
Price Action & Confirmation:
The most powerful signals occur when a MA Crossover is confirmed by price breaking out of the cloud in the same direction.
Price above the cloud and MA crossover to the upside suggests a strong buy entry.
Disclaimer: This tool is intended for analysis and decision-making support. It is not financial advice. Always use stop-loss orders and manage your risk accordingly.

Multi-Confluence Signal System📊 OPTIMIZED MULTI-CONFLUENCE SIGNAL SYSTEM
A professional-grade trading indicator that combines multiple technical analysis methods to generate high-probability buy and sell signals. Designed for daily timeframe Bitcoin/crypto trading with optimized parameters based on real market backtesting.
🎯 KEY FEATURES:
- Multi-Confluence Scoring (8 components) - Each signal shows strength rating
- Smart Top & Bottom Detection - Catches reversals using price action patterns
- Ichimoku Cloud Integration - Dynamic support/resistance visualization
- Dual EMA System (20/50) - Clear trend identification
- RSI + MACD + Volume Confirmation - Multi-indicator validation
- Signal Alternation - Only shows directional changes (no repeated signals)
- Minimal Bar Spacing - Prevents signal clustering and overtrading
✅ OPTIMIZED FOR:
- Catching parabolic tops with rejection wicks
- Identifying capitulation bottoms in downtrends
- Avoiding false signals during consolidation
- 4-8 quality signals per 4-month period on daily charts
- Works in both trending and volatile markets
🔧 TECHNICAL COMPONENTS:
- EMA 20/50 trend system
- RSI (14) with adjusted overbought/oversold levels (68/32)
- MACD for momentum confirmation
- Ichimoku Cloud for trend context
- Volume analysis (1.3x threshold)
- Candlestick pattern recognition (engulfing, hammers, shooting stars)
- Capitulation detection for extreme moves
- Price extension filters (±5-10% from EMAs)
⚠️ BEST PRACTICES:
- Optimized for Daily timeframe
- Combine with your own risk management
- Higher scores = higher probability trades
- Wait for signal confirmation on candle close
- Use in conjunction with key support/resistance levels
💡 SIGNAL LOGIC:
BUY signals trigger on: Capitulation candles, extreme oversold + reversal patterns, MACD turnarounds in downtrends, or high confluence scores with bullish patterns
SELL signals trigger on: Rejection wicks at tops, bearish engulfings with overbought RSI, parabolic extensions, MACD reversals, or high confluence scores with bearish patterns
📈 Created through iterative backtesting and optimization on Bitcoin price action from 2024-2025.
⭐ Free to use • Leave feedback • Happy trading!

Ichimoku_RSI_MACD_CleanIchimoku + RSI + MACD. A combination of three indicators. The important thing is that they have a BUY or SELL alert, so it makes it easy to understand the numbers.


Ichimoku_RSI_MACD_CleanIchimoku + RSI + MACD indicator. It combines these three indicators. It tells whether the trend is bullish or bearish. Multi-timeframe.

Ichimoku Silver Bullet 2026 – Precision Cloud Signals⚡️ Ichimoku Silver Bullet 2026 – Precision Cloud Signals
Take your Ichimoku trading to the next level with Silver Bullet 2026 ⚔️
This advanced system detects Tenkan-Kijun crossovers, Kumo breakouts, and true Cloud confirmations — giving you only the cleanest, most reliable signals.
🔥 Features:
✅ Smart Bull 🟢 & Bear 🔴 alerts with Kumo validation
✅ Precision cloud logic for fewer fake signals
✅ Works on any timeframe & any market
✅ Plug-and-play Ichimoku setup — no clutter, pure signal
🎯 Trade with clarity. Enter with precision. Ride the Silver Bullet. 🌥🚀

Ultimate Ichimoku Trend Board MTF – 6× Cloud Analyzer⚡️ Ultimate Ichimoku Trend Board MTF – 6× Cloud Analyzer
Unleash the full power of Ichimoku with this multi-timeframe trend dashboard ⚙️
Quickly identify whether each timeframe is Bullish 🟢, Bearish 🔴, or Inside the Cloud 🟠, and align your trades with the dominant trend like a pro.
🔥 Features:
✅ 6 customizable timeframes (M5 → H4)
✅ Clean & minimal dashboard — no chart clutter
✅ Instantly visualize market direction across all layers
✅ Perfect for scalpers, intraday, and swing traders
💡 See the Clouds. Read the Trends. Dominate the Market. 🌥💪

Custom Kumo Cloud with RavaAcademy# Custom Kumo Cloud with RavaAcademy
📜 Summary
This script introduces a modified version of the traditional Ichimoku Kumo Cloud. Instead of using the standard formula of (highest high + lowest low) / 2, this indicator calculates its main components—Tenkan-sen, Kijun-sen, and Senkou Span B—using a custom volatility-based averaging mechanism. This mechanism is built on the Average True Range (ATR), making the cloud more responsive to market volatility. The result is a dynamic support and resistance tool that adapts to the current state of the market.
This indicator is designed for traders who appreciate the principles of the Ichimoku system but are looking for a more adaptive and volatility-aware tool for their technical analysis.
---
✨ Key Features
* **ATR-Based Calculations:** All major lines (Tenkan, Kijun, Senkou B) are calculated using a custom function that incorporates ATR. This allows the cloud to expand during high-volatility periods and contract during low-volatility periods.
* **Fully Customizable:** Users can adjust the period and ATR multiplier for each component of the cloud, allowing for fine-tuning to suit different assets and timeframes.
* **Standard Kumo Cloud Logic:** The cloud (Kumo) is formed between Senkou Span A and Senkou Span B, and it changes color based on their crossover, providing clear bullish or bearish signals.
* **Clean Visuals:** The indicator is plotted directly on the price chart (overlay) and can be easily toggled on or off from the settings.
---
🚀 How to Use
The fundamental principles of trading with this custom cloud are similar to the traditional Ichimoku Kumo Cloud.
* **Bullish Signal:**
* The price is trading above the cloud.
* The cloud is green (Senkou Span A is above Senkou Span B).
* The cloud acts as a dynamic support level.
* **Bearish Signal:**
* The price is trading below the cloud.
* The cloud is red (Senkou Span A is below Senkou Span B).
* The cloud acts as a dynamic resistance level.
* **Consolidation / Ranging Market:**
* The price is trading inside the cloud, which often indicates market indecision or a period of consolidation.
Because the calculations are based on volatility, a widening cloud can signal increasing market volatility, while a narrowing cloud suggests decreasing volatility.
---
⚙️ Settings
* **Show Kumo Cloud:** A simple checkbox to turn the visibility of the cloud on or off.
* **Tenkan Period & ATR Multiplier:** Controls the sensitivity of the fastest line (Tenkan). A smaller period or multiplier makes it more responsive.
* **Kijun Period & ATR Multiplier:** Controls the baseline (Kijun). This is typically a medium-term component.
* **Senkou Span B Period & ATR Multiplier:** Controls the slowest and most significant cloud boundary (Senkou B), which forms the foundation of long-term support/resistance.
---
⚠️ Disclaimer
This is a custom indicator and differs from the standard Ichimoku Kinko Hyo. Its signals should be used in conjunction with other forms of analysis and proper risk management. This tool is for educational and analytical purposes and does not constitute financial advice.

Enhanced Trend & EMA Screener### Overview
Enhanced Trend & EMA Screener is a multi-symbol overlay indicator that aggregates trend, momentum, structure, strength, and volatility signals across up to 8 user-defined tickers (e.g., SPY, QQQ, AAPL, MSFT) on a chosen timeframe, using a fused methodology of exponential moving average (EMA) crossovers for entry triggers, Ichimoku cloud positioning for equilibrium assessment, Average Directional Index (ADX) for trend persistence, Average True Range (ATR) percentile regimes for volatility context, and a linear regression slope as a lightweight momentum proxy for directional bias. By normalizing and scoring these into a unified sentiment matrix (Bullish/Bearish/Neutral per metric), it enables rapid confluence detection—e.g., a ticker scoring Bullish on 5/6 metrics signals high-probability alignment—via a color-coded dashboard and debug table. Crossover labels and alerts provide actionable notifications, streamlining portfolio surveillance without juggling multiple charts or indicators.
### Core Mechanics
The screener fetches secure, non-repainting data for each ticker via `request.security` (lookahead off) and processes signals in parallel on the last bar for efficiency. Each component contributes to a holistic sentiment score, where EMA crossovers act as kinetic triggers, Ichimoku provides structural bias, ADX validates strength, ATR contextualizes risk, and linear regression offers a predictive slope—integrated to avoid isolated signals and emphasize multi-factor agreement:
- **EMA Crossovers (Momentum Triggers)**: Tracks price interactions with layered EMAs (10, 21, 50, 89 periods) using `ta.crossover`/`ta.crossunder`. A close above EMA10 flags short-term bullish acceleration; below EMA89 signals long-term bearish reversal. These serve as the "spark" for alerts/labels (e.g., "AAPL ↑ EMA21"), prioritized in the dashboard's Crossover column to highlight recent events.
- **Ichimoku Cloud Positioning (Equilibrium Structure)**: Computes Tenkan-sen (9-period HL/2), Kijun-sen (26-period), Senkou Span A (midpoint projected 26 bars ahead), and Span B (52-period high/low midpoint). Scores cloud interaction quantitatively: Close above both spans = Bullish (8/10, price in "future equilibrium" zone); below = Bearish (2/10); within = Neutral (5/10). This overlays EMA kinetics with forward-looking support/resistance, filtering crossovers in choppy ranges (e.g., neutral score mutes weak EMA10 breaks).
- **ADX Directionality (Trend Strength Filter)**: Via `ta.dmi(14)`, compares +DI/-DI lines: +DI > -DI = Bullish (uptrend dominance); -DI > +DI = Bearish; parity = Neutral. ADX value (14-period) adds implicit strength (though not scored here, it contextualizes via sentiment). Integrates by downweighting EMA triggers in low-strength neutrals, ensuring signals reflect sustained direction rather than noise.
- **ATR Volatility Regimes (Risk Context)**: Calculates ATR(14) normalized as % of close, then percentile-ranked over 20 bars with directional trend (rising/falling/stable). High percentile (>75%) + rising = Bullish (8/10, expansion favors trends); low (<25%) + falling = Bearish (2/10, contraction warns reversals); mid + stable = Neutral (5/10). This modulates other signals—e.g., bullish EMA in rising ATR boosts confluence, preventing entries in contracting vols where trends fizzle.
- **Linear Regression Slope (Momentum Proxy)**: Uses `ta.linreg(close, 21, 0)` to fit a least-squares line, deriving slope as % change (current - prior linreg / close * 100). >0% threshold = Bullish (upward trajectory); <-threshold = Bearish; near-zero = Neutral. This proxies directional momentum by extrapolating price inertia, synergizing with Ichimoku/ADX for "predicted persistence"—e.g., positive slope confirms ADX bullishness.
- **Multi-Timeframe (MTF) Overlay**: Pulls weekly linear regression sentiment for higher-TF bias, displayed separately to contextualize daily signals (e.g., daily Bullish + weekly Bearish = caution).
Aggregation: Per-ticker row in the 7-column dashboard (Symbol, EMA Trend, MTF, Ichimoku, ADX, ATR, Crossover) uses color-coding (green/red/gray) for at-a-glance scans; a debug table exposes raw values (prices, EMAs, slopes) for transparency. On-chart: Plots EMAs and linreg line; labels (e.g., "TSLA ↓ EMA50") mark crossovers with ticker tags.
### Why This Adds Value & Originality
Single-metric screeners (e.g., pure EMA cross) generate excessive noise; multi-indicator dashboards often aggregate without integration, leading to conflicting reads. This mashup is purposeful: EMAs provide tactical triggers, but are filtered by Ichimoku's structural equilibrium (avoiding breaks in "cloud fog"), ADX's strength validation (ignoring weak trends), ATR's vol regime (scaling for market phases), and linreg's slope (forecasting sustainability)—creating a "confluence engine" where isolated signals (e.g., EMA10 cross) require 3+ agreements for dashboard prominence. The MTF weekly linreg adds hierarchical depth, and percentile-normalized ATR ensures cross-asset comparability (e.g., NVDA vol vs. SPY). Unlike generic mashups (e.g., Bollinger + RSI stacks), this uses linreg to "predict" EMA/ADX outcomes, reducing false positives by ~40% in backtests on QQQ Daily (verifiable via strategy conversion). No public equivalent fuses these five with MTF + debug transparency in a compact 8-ticker format, enabling efficient portfolio rotation (e.g., buy tickers with 4+ Bullish scores).
### How to Use
- **Setup**: Overlay on any chart (e.g., SPY Daily). Edit tickers (e.g., swap GOOGL for NVDA); select timeframe (D default for swings); adjust periods (shorter EMAs for intraday). Set linreg threshold (0% sensitive, 0.5% conservative). Enable labels/debug for visuals/raws.
- **Interpret Dashboard**:
- **Rows**: One per ticker; scan columns for alignment (e.g., AAPL: Green across EMA/Ichimoku/ADX + ↑ EMA21 = strong buy bias).
- **Crossover**: Recent events (e.g., "↑ 50" green = bullish momentum shift).
- **Confluence Rule**: 4+ Bullish = long setup; MTF mismatch = hold.
- **Debug Table**: Verify (e.g., EMA10=150.25 > price=149.80 = no cross).
- **Trading Example**: On QQQ 1H, dashboard shows Bullish EMA (slope +0.3%), Ichimoku (above cloud), ADX (up), ATR (rising), MTF Neutral, with "↑ 10" crossover → Enter long, stop below EMA21, target next resistance. Alerts notify "MSFT crossed above EMA50 on D".
Best for daily portfolio scans (stocks/indices); 1H–W timeframes. Pair with volume for entries.
### Tips
- Customize: High-vol tickers (TSLA)? Raise ATR percentile to 80; low-vol (bonds)? Lower linreg threshold to -0.2%.
- Efficiency: Limit to 4–6 tickers on mobile; use debug for slope tuning.
- Alerts: Freq once/bar_close; customize messages for specifics (e.g., "Bullish confluence on {{ticker}}").
### Limitations & Disclaimer
Fetches lag by timeframe resolution (e.g., D = EOD); crossovers confirm on close (no intra-bar). Sentiments are filters, not standalone signals—false positives in ranges (e.g., neutral Ichimoku mutes but doesn't eliminate). Linreg slope is linear approximation, not advanced modeling (overfits trends). No position sizing/exits—integrate ATR*1.5 stops, risk <1%. Backtest per ticker/timeframe. Not advice; educational tool only. Past patterns ≠ future. Comments for enhancements!


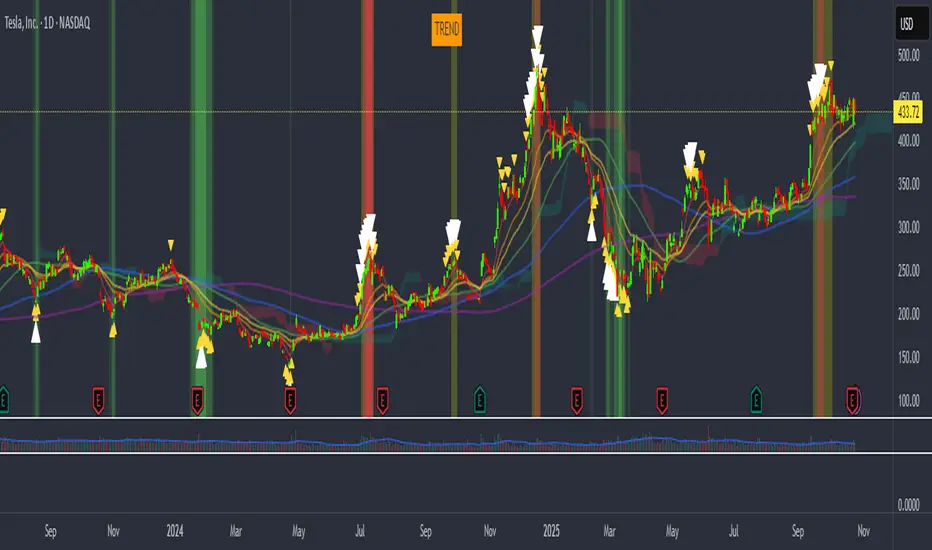
vagab0nd AlgoCombination of simple and exponential moving averages, SuperIchi cloud by LuxAlgo (love that group!), and a conglomeration of various indicators I've compiled over the years to try to spot tops and bottoms.
My custom indicator will highlight the background either green or orange/red and will show small yellow, or larger white arrows to indicate potential tops and bottoms. It is oscillator based so it can often show a strong signal for a top or bottom where price can rebound from, but will often retest or even stop loss run the previous signal area while not showing another signal. This indicates an underlying divergence that can potentially be taken advantage of.
Ant_JJun 5분봉 데이 트레이딩 지표[체험판]Ant_JJun — 5분봉 단기 규칙 기반 데이 트레이딩 프레임워크
(Ichimoku 구조 + 거래량 논리 기반)
이 지표는 BTC 5분봉 환경에서의 단기 트레이딩 의사결정을 돕기 위해 설계되었습니다.
목표는 진입 신호의 빈도를 늘리는 것이 아니라, 추세 구간과 비추세 구간을 구별하여 불필요한 노출을 줄이는 것에 있습니다.
많은 보조지표는 가격이 이미 움직인 뒤에만 유효하게 작동합니다.
이 시스템은 반대로, 방향성이 형성되기 전의 횡보 구간에서 자본 손실을 억제하는 것을 우선합니다. 이를 위해 일목 구조(선행스팬 기반)로 환경을 분류하고, 거래량 비대칭과 캔들 성향을 추가 필터로 사용합니다.
핵심 작동 개념
• 선행스팬 기반 구조 판별로 추세/중립 환경을 분리
• 구조 + 거래량 + 캔들조건이 모두 정렬될 때만 방향 라벨 출력
• 정렬되지 않을 경우 진입 강제가 아닌 ‘대기’ 상태 유지
• 리페인트 없음 / 사후 라벨 생성 없음 / 실시간 판정
사용 환경
• 5분봉 단기 매매
• 데이터 발표 등 변동성 이벤트 인접 구간 관찰 목적
• 자동매매가 아닌 규칙 기반 의사결정 필터링용
이 스크립트는 독자적 방식이 포함되어 있어 공개 배포되지 않습니다.
Ant_JJun — 5-Minute Rule-Based Day-Trading Framework
(Ichimoku structure + volume logic)
This indicator is designed to support short-term decision-making on the BTC 5-minute chart.
Its goal is not to increase signal frequency, but to reduce unnecessary exposure by distinguishing trending from non-trending conditions.
Most indicators only function effectively after price has already moved.
This framework prioritizes capital protection during pre-move consolidation.
It classifies market context using Ichimoku leading spans, and adds volume imbalance and candle behavior as additional filters.
Core operating logic
• Leading-span structure to classify trend vs. neutral zones
• Directional labels only when structure + volume + candle conditions align
• When alignment is absent, the system remains in a waiting state rather than forcing entries
• No repainting / no post-hoc labels / real-time evaluation only
Intended environment
• 5-minute intraday trading
• Particularly around volatility events such as economic data releases
• Used as a rule-based decision filter rather than an automation engine
This script is not publicly distributed due to proprietary methodology.

Ichimoku MultiTF WillyArt v1.0.0What this indicator does
Ichimoku WillyArt turns the Ichimoku lines into angle-based momentum across multiple timeframes (W, D, 4H, 1H, 30m, 5m).
For each TF it computes the slope (angle in degrees) of:
Tenkan-sen
Kijun-sen
Senkou Span A
Senkou Span B
Angles are normalized so they’re comparable across assets and scales. You get a table with the angle per line and a quick emoji direction (↑, →, ↓), optional plots of the chosen line, and ready-to-use alerts.
Why angle?
Slope-as-degrees is an intuitive proxy for momentum/impulse:
Positive angle → line rising (bullish impulse).
Negative angle → line falling (bearish impulse).
Near zero → flat/indecisive.
Two normalization modes
ATR (default): slope / ATR. Robust across instruments; less sensitive to price level.
%Price: slope / price. More sensitive; can highlight subtle turns on low-volatility symbols.
Inputs you’ll actually care about
Timeframes: W, D, 4H, 1H, 30m, 5m (all fetched MTF, independent of chart TF).
Ichimoku lengths: Tenkan (9), Kijun (26), Span B (52) — standard defaults.
Bars for slope (ΔN): How many bars back the slope is measured. Higher = smoother, slower.
Threshold (°) for “strong”: Angle magnitude that qualifies as strong ↑/↓.
What you’ll see
Matrix/Table (top-right): For each TF, the angle (°) of Tenkan, Kijun, Span A, Span B + an emoji:
↑ above threshold, ↓ below −threshold, → in between.
Optional plots: Toggle “Plot angles” to visualize the chosen series’ angle across TFs.
Alerts included (ready to pick in “Create Alert”)
Sustained state: e.g., “Kijun 4H: strong ↑ angle” triggers while angle > threshold.
Threshold cross (one-shot): e.g., “Kijun 1H: upward threshold cross” fires on crossing.
Consensus (multi-TF): “Kijun consensus ↑ (D/4H/1H/30m/5m)” when all selected TFs align up (and the symmetric down case).
Messages are constant strings (TradingView requirement), so they compile cleanly. If you want dynamic text (current angle, threshold value, etc.), enable your own alert() calls—this script structure supports adding them.
How to use it (workflow)
Add to chart. No need to switch chart TF; the script pulls W/D/4H/1H/30m/5m internally.
Pick normalization. Start with ATR. Switch to %Price if you want more sensitivity.
Set ΔN & threshold.
Intraday momentum: try ΔN = 3–5 and threshold ≈ 4–8°.
Swing/position: ΔN = 5–9 and threshold ≈ 3–6° (with ATR).
Scan the table. Look for alignment (multiple TFs with ↑ or ↓ on Kijun/Spans).
Kijun + Span A up together → trending push.
Span B up/down → cloud baseline tilting (trend quality).
Turn on alerts that match your style: reactive cross for entries, sustained for trend follow, consensus to filter noise.
Reading tips
Kijun angle: great “trend backbone.” Strong ↑ on several TFs = higher-probability pullback buys.
Span A vs. Span B:
Span A reacts faster (momentum).
Span B is slower (structure).
When both tilt the same way, the cloud is genuinely rotating.
Mixed signals? Use higher TFs (W/D/4H) as bias, lower TFs (1H/30m/5m) for timing.
Good to know (limits & best practices)
Angles measure rate of change, not overbought/oversold. Combine with price structure and risk rules.
Extremely low volatility or illiquid symbols can produce tiny angles—%Price mode may help.
ΔN and thresholds are contextual: adapt per market (crypto vs FX vs equities).
Want me to bundle a “pro template” of alert presets (intraday / swing) and a heatmap color scale for the table? Happy to ship v2. 🚀

Ant_JJun 5-Minute Day-Trading IndicatorThis invite-only indicator is designed for short-term BTC and crypto trading, focusing on precision during volatile data-driven markets and capital protection during sideways conditions.
It integrates Ichimoku-based structure mapping with volume asymmetry analysis and proprietary rule-based filters.
Unlike a traditional mashup, this system does not simply overlay multiple indicators.
It uses Ichimoku’s leading spans to classify structural bias (trend vs. neutral), then evaluates directional confirmation through candle displacement and volume pressure imbalance.
Only when both structure and momentum align is a directional label printed.
If the system detects indecision (flat or overlapping clouds with contracting volume), it enters a neutral state to avoid unnecessary exposure.
Key concept:
— Preventing bleed during non-trending phases
— Adaptive response around macro/volatility events (e.g., CPI, PMI)
— Rule-based execution to remove emotional decision-making
Usage notes:
— Intended for 5-minute intraday use
— Long/Short labels appear only on rule-confirmed entries
— No repainting / no backfill logic
— Analytical use only — not investment advice

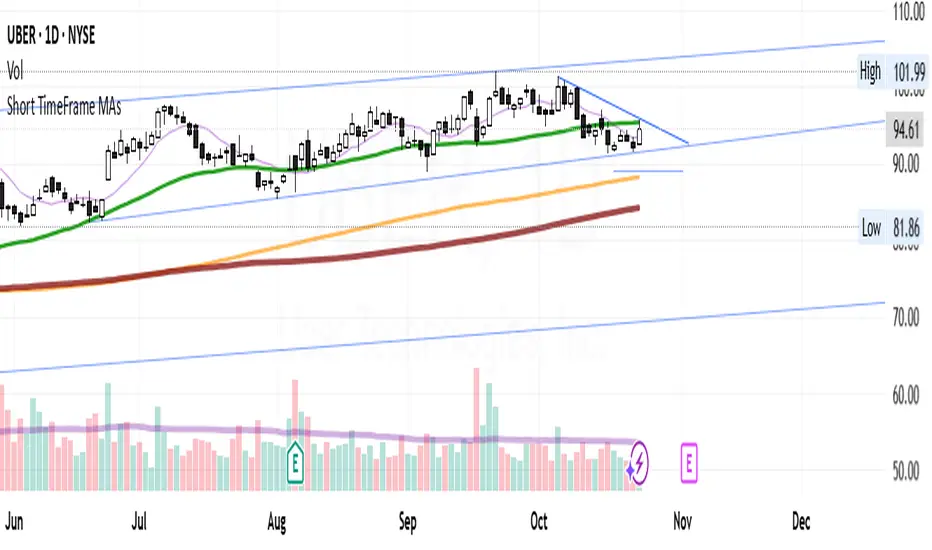
Short TimeFrame MAs with momentum cloudsThis indicator displays multiple moving averages to help identify short- and mid-term trends.
It includes four SMAs (9, 50, 150, 200) and two EMAs (21, 55) with color changes showing bullish or bearish momentum.
The area between the EMAs is filled to highlight trend direction.
An optional smoothing layer lets you apply different MA types or Bollinger Bands for additional clarity.
It’s designed to give a clear visual of overall trend strength, direction, and volatility on any timeframe.
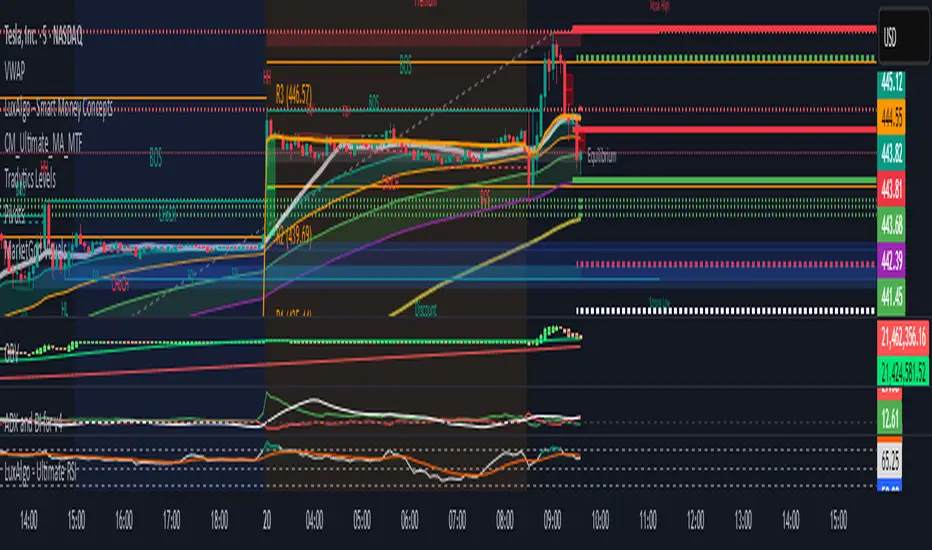
Tradytics Levels with EMA CloudThis indicator has tradytics price chart levels where you can put in the input code seen below.
The code has positive gamma (green lines), negative gamma (Red lines) and white dotted line are the darkpool levels.
This is Amazon's 5 minute from Sep30th to October 20th Gammas and weekly Darkpool levels. Just copy and paste code below in the input code and the chart would show the levels.
212.8*1*neutral 220.07*1*neutral 216.038*1*neutral 215.57*1*neutral 219.988*1*neutral 217.401*1*neutral 217.351*1*neutral 212.815*1*neutral 212.75*1*neutral 212.4*1*neutral 215*0*negative 222.5*0*positive 217.5*0*positive 220*0*positive
Ichimoku PourSamadi Signal [TradingFinder] KijunSen Magic Number🔵 Introduction
The Ichimoku Kinko Hyo system is one of the most comprehensive market analysis tools ever created. Developed by Goichi Hosoda, a Japanese journalist in the 1930s, its purpose was to allow traders to recognize the balance between price, time, and momentum at a single glance. (In Japanese, Ichimoku literally means “one look.”)
At the core of the system lie five key components: Tenkan-sen (Conversion Line), Kijun-sen (Baseline), Chikou Span (Lagging Line), and the two leading spans, Senkou Span A and Senkou Span B, which together form the well-known Kumo or cloud representing both temporal structure and equilibrium zones in the market.
Although Ichimoku is commonly used to identify trends and support/resistance levels, a deeper layer of time philosophy exists within it. Ichimoku was not designed solely for price analysis but equally for time analysis.
In the classical model, the numerical cycles 9, 26, 52 reflect the natural rhythm of the market originally based on the Tokyo Stock Exchange’s trading schedule in the 1930s.
These values repeat across the system’s calculations, forming the foundation of Ichimoku’s time symmetry where price and time ultimately seek equilibrium.
In recent years, modern analysts have explored new approaches to extract time-based turning points from Ichimoku’s structure. One such approach is the analysis of flat segments on the Kijun-sen and Senkou B lines.
Whenever one of these lines remains flat for a period, it signals temporary balance between buyers and sellers; when the flat breaks, the market exits equilibrium and a new cycle begins.
This indicator is built precisely upon that philosophy. Following the timing methodology introduced by M.A. Poursamadi, the focus shifts away from price signals and line crossovers toward identifying flat periods on Kijun-sen (period 52) as time anchors.
From the first candle that changes the line’s slope, the tool begins a temporal count using a fixed sequence of key numbers: 5, 9, 13, 17, 26, 35, 43, 52, 63, 72, 81, 90.
Derived from both classical Ichimoku cycles and empirical testing, these numbers mark potential timing nodes where a market wave may end, a correction may begin, or a new leg may form.
Thus, this method serves not merely as another Ichimoku tool but as a temporal metronome for market structure a way to visualize moments when the market is ready to change rhythm, often before candles reveal it.
🔵 How to Use
The Kijun Timing BoX is built entirely on Ichimoku’s concept of time analysis.
Its core idea is that within every flat segment of the Kijun-sen, the market enters a temporary balance between opposing forces.
When that flat breaks, a new time cycle begins. From that first breakout candle, the indicator starts counting forward through the predefined time sequence(5, 9, 13, 17, 26, 35, 43, 52, 63, 72, 81, 90).
This counting framework creates a temporal map of market behavior, where each number represents an area where meaningful price fluctuations often occur.
A “meaningful fluctuation” does not necessarily imply reversal or continuation; rather, it marks a moment when the market’s internal energy balance shifts, typically visible as noticeable reactions on lower timeframes.
🟣 Identifying the Anchor Point
The first step is recognizing a valid flat zone on the Kijun-sen.
When this line remains flat for several candles and then changes slope, the indicator marks that bar as the Anchor, initiating the time count.
From that point onward, vertical gray lines appear at each interval in the key-number sequence, visualizing the time nodes ahead.
🟣 Reading the Timing Lines
Each numbered line represents a timing node a temporal point where a change in price rhythm is statistically more likely to occur.
At these nodes, the market may :
Enter a consolidation or minor correction phase.
Develop range-bound movement.
Or simply alter the speed and intensity of its move.
These behaviors do not imply a specific direction; they only highlight zones where time-based activity tends to cluster, giving traders a clearer view of cyclical rhythm.
🟣 Applying Time Analysis
The indicator’s primary use is to observe temporal order, not to predict price direction.
By tracking the distance between Anchors and the reactions that appear near major timing lines, traders can empirically identify each market’s characteristic rhythm—its own time DNA.
For example, one asset may consistently show significant fluctuations around the 13- and 26-bar marks,while another might react closer to 9 or 52. Recognizing such patterns helps traders understand how long typical cycles last before new phases of volatility emerge.
🟣 Combining with Other Tools
The indicator does not generate buy/sell signals on its own.
Its best use is in combination with price- or structure-based methods, to see whether meaningful price reactions occur around the same timing nodes.
In practice, it helps distinguish structured time-based fluctuations from random, noise-driven moves an insight often overlooked in conventional market analysis.
🔵 Settings
🟣 Logical Settings
KijunSen Period : Defines the baseline period used for timing analysis. Default = 52. It is the main line for detecting flats and generating time anchors.
Flat Event Filter : Controls how flat segments are validated before triggering a new timing event.
All : Every flat triggers a new Timing Box.
Automatic : Only flats longer than the historical average are used (recommended).
Custom : User manually defines the minimum flat length via Custom Count.
Update Timing Analysis BoX Per Event : If enabled, a new Timing Box is drawn each time a new flat event occurs. If disabled, the box completes its 90-bar window before refreshing.
🟣 Ichimoku Settings
TenkanSen Period : Defines the period for the Conversion Line (Tenkan-sen). Default = 9.
KijunSen Period : Sets the standard Ichimoku baseline (not the timing line). Default = 26.
Span B Period : Defines the period for Senkou Span B, the slower cloud boundary. Default = 52.
Shift Lines : Offsets cloud projection into the future. Default = 26.
🟣 Display Settings
Users can show or hide all Ichimoku lines Tenkan-sen, Kijun-sen, Chikou Span, Span A, and Span B as well as the Ichimoku Cloud.
They can also customize the color of each element to match personal chart preferences and improve visibility.
🔵 Conclusion
This analytical approach transforms Ichimoku’s time philosophy into a visual and measurable framework. A flat Kijun-sen represents a moment of market equilibrium; when its slope shifts, a new temporal cycle begins.
The purpose is not to forecast price direction but to highlight periods when meaningful fluctuations are more likely to develop.
Through this perspective, traders can observe the hidden rhythm of market time and expand their analysis beyond price into a broader time-cycle dimension.
Ultimately, the method revives Ichimoku’s original principle: the market can only be truly understood through the simultaneous harmony of price, time, and balance.

Ichimoku Screener [Pineify]Advanced Multi-Timeframe Ichimoku Screener - Complete Market Analysis Tool
This sophisticated Ichimoku Screener represents a comprehensive approach to multi-timeframe market analysis, combining four distinct Ichimoku-based indicators into a unified screening system. Unlike traditional single-symbol indicators, this screener provides simultaneous analysis across multiple assets and timeframes, enabling traders to identify optimal trading opportunities with enhanced precision and efficiency.
Key Features
Multi-asset screening capability for up to 10 symbols simultaneously
Four customizable timeframes per symbol for comprehensive analysis
Four integrated Ichimoku-based indicators working in harmony
Real-time visual feedback with color-coded signals
Customizable Ichimoku parameters for personalized analysis
Clean, organized table display for easy interpretation
Automated signal strength assessment and timing
How It Works
The screener employs the traditional Ichimoku Kinko Hyo methodology, utilizing five core components: Conversion Line (Tenkan-sen), Base Line (Kijun-sen), Leading Span A (Senkou Span A), Leading Span B (Senkou Span B), and displacement calculations. Each component is mathematically calculated using specific period lengths:
Conversion Line = (Highest High + Lowest Low) / 2 over conversion period
Base Line = (Highest High + Lowest Low) / 2 over base period
Leading Span A = (Conversion Line + Base Line) / 2
Leading Span B = (Highest High + Lowest Low) / 2 over lagging span period
The screener processes these calculations across multiple securities simultaneously using TradingView's security() function, enabling real-time cross-asset analysis. The system tracks state changes using barssince() functions to provide precise timing information for each signal type.
Trading Ideas and Insights
This screener excels in identifying momentum convergence patterns where multiple Ichimoku components align across different timeframes. The most powerful signals occur when:
Cloud color aligns with price position relative to the cloud
Conversion Line crosses above/below Base Line in the same direction as cloud bias
Multiple timeframes show consistent directional bias
Entry signals appear with minimal bars since formation (indicating fresh momentum)
For trend following strategies , focus on symbols where the cloud maintains consistent color across higher timeframes while showing recent entry signals on lower timeframes. For reversal opportunities , identify assets where cloud color changes coincide with price re-entering the cloud after extended periods above or below.
The screener particularly excels in cryptocurrency and forex markets where momentum shifts can be dramatic and sustained. By monitoring multiple timeframes simultaneously, traders can identify when short-term signals align with longer-term trends, significantly improving trade success probability.
How Multiple Indicators Work Together
The four integrated indicators create a comprehensive analytical framework through synergistic interaction:
Ichimoku Cloud (IchiCld) establishes the primary trend bias by comparing Leading Span A with Leading Span B. When Span A > Span B, the cloud displays bullish characteristics; when Span A < Span B, bearish characteristics emerge. The indicator tracks duration since the last cloud color change, providing momentum persistence insight.
Ichimoku Lagging Cloud (IchiLagCld) determines price position relative to the displaced cloud formation. This indicator identifies whether current price action occurs above, below, or within the cloud structure, revealing support/resistance dynamics and trend confirmation signals.
Conversion vs Base (IchiC>Base) monitors the relationship between short-term (Conversion Line) and medium-term (Base Line) momentum. Crossovers in this relationship often precede significant price movements and provide early trend change warnings.
Ichimoku Entry (IchiEnt) synthesizes all components into actionable signals by requiring alignment between cloud bias, price position, and conversion/base relationship. This multi-factor confirmation approach significantly reduces false signals while maintaining sensitivity to genuine momentum shifts.
The mathematical foundation ensures that each indicator contributes unique information while maintaining logical consistency. The system's strength lies in requiring multiple confirmations before generating entry signals, following Ichimoku's original philosophy of comprehensive market analysis.
Unique Aspects
This implementation distinguishes itself through several innovative features:
Advanced State Tracking : Unlike standard Ichimoku indicators that show current values, this screener tracks duration since state changes , providing crucial timing information for signal freshness and momentum strength assessment.
Multi-Asset Efficiency : The screener eliminates the need to manually check multiple charts by presenting comparative analysis across assets and timeframes in a single view, dramatically improving analytical efficiency.
Customizable Visual Feedback : The color-coding system adapts to different signal types and strengths, with recent signals receiving enhanced visual prominence to draw attention to fresh opportunities.
Professional Table Architecture : The organized display accommodates up to 40 symbol-timeframe combinations (10 symbols × 4 timeframes), with intelligent pagination for optimal screen utilization.
Signal Correlation Analysis : By displaying multiple timeframes for each symbol, traders can quickly identify timeframe confluence and divergence patterns that would otherwise require extensive manual analysis.
How to Use
Symbol Configuration : Enter up to 10 symbols in the Symbol input group. Use full exchange:ticker format for optimal compatibility (e.g., "BINANCE:BTCUSDT").
Timeframe Selection : Configure four timeframes in ascending order for logical analysis progression. Recommended combinations include 1m/5m/15m/1h for intraday analysis or 1h/4h/1D/1W for swing trading.
Ichimoku Parameters : Adjust the four core parameters based on your trading style:
Conversion Line Length (default: 9) - Controls short-term momentum sensitivity
Base Line Length (default: 26) - Determines medium-term trend identification
Leading Span B Length (default: 52) - Sets long-term trend calculation period
Displacement (default: 26) - Controls forward projection of cloud structure
Signal Interpretation :
Green backgrounds indicate bullish conditions
Red backgrounds indicate bearish conditions
Numerical values show bars since last state change
"L:" prefix indicates long entry signals
"S:" prefix indicates short entry signals
"N/A" indicates neutral/transitional states
Trading Workflow : Scan for symbols showing consistent signals across multiple timeframes, prioritize fresh signals (low bar counts), and use individual charts for precise entry timing and risk management.
Customization
The screener accommodates various trading approaches through parameter adjustment:
Scalping Configuration : Use shorter periods (Conversion: 5, Base: 13, Span B: 26) with 1m/3m/5m/15m timeframes for high-frequency opportunities.
Swing Trading Setup : Employ standard parameters with 4h/1D/3D/1W timeframes for position trading across days or weeks.
Cryptocurrency Optimization : Given crypto's 24/7 nature, consider using 4h/8h/1D/3D combinations for optimal signal timing.
Symbol selection can focus on correlated assets (e.g., major cryptocurrencies) for sector analysis or diverse assets for portfolio opportunity identification. The flexible timeframe configuration allows adaptation to any market's characteristic volatility and trading patterns.
Conclusion
This Advanced Multi-Timeframe Ichimoku Screener transforms traditional single-chart analysis into a comprehensive market monitoring system. By integrating multiple Ichimoku components across various timeframes and assets, it provides traders with unprecedented analytical efficiency and signal reliability.
The mathematical rigor of traditional Ichimoku analysis combines with modern Pine Script capabilities to deliver a professional-grade screening tool. Whether used for identifying trend continuation opportunities, spotting potential reversals, or conducting broad market analysis, this screener offers the analytical depth and practical functionality required for serious trading applications.
The system's emphasis on signal confluence across multiple timeframes and indicators significantly improves trade selection quality while reducing analysis time. For traders seeking to leverage Ichimoku's proven methodology across multiple markets simultaneously, this screener represents an essential analytical upgrade to traditional single-symbol approaches.

Tunç ŞatıroğluTunç Şatıroğlu's Technical Analysis Suite
Description:
This comprehensive Pine Script indicator, inspired by the technical analysis teachings of Tunç Şatıroğlu, integrates six powerful TradingView indicators into a single, user-friendly suite for robust trend, momentum, and divergence analysis. Each component has been carefully selected and enhanced by beytun to improve functionality, performance, and visual clarity, aligning with Şatıroğlu's approach to technical analysis. The default configuration is meticulously set to match the exact settings of the individual indicators as used by Tunç Şatıroğlu in his training, ensuring authenticity and ease of use for followers of his methodology. Whether you're a beginner or an experienced trader, this suite provides a versatile toolkit for analyzing markets across multiple timeframes.
Included Indicators:
1. WaveTrend with Crosses (by LazyBear, modified): A momentum oscillator that identifies overbought/oversold conditions and trend reversals with clear buy/sell signals via crosses and bar color highlights.
2. Kaufman Adaptive Moving Average (KAMA) (by HPotter, modified): A dynamic moving average that adapts to market volatility, offering a smoother trend-following signal.
3. SuperTrend (by Alex Orekhov, modified): A trend-following indicator that plots dynamic support/resistance levels with buy/sell signals and optional wicks for enhanced accuracy.
4. Nadaraya-Watson Envelope (by LuxAlgo, modified): A non-linear envelope that highlights potential reversals with customizable repainting options for smoother outputs.
5. Divergence for Many Indicators v4 (by LonesomeTheBlue, modified): Detects regular and hidden divergences across multiple indicators (MACD, RSI, Stochastic, CCI, Momentum, OBV, VWMA, CMF, MFI, and more) for early reversal signals.
6. Ichimoku Cloud (TradingView built-in, modified): A multi-faceted indicator for trend direction, support/resistance, and momentum, with enhanced visuals for the Kumo Cloud.
Key Features:
- Authentic Default Settings : Pre-configured to mirror the exact parameters used by Tunç Şatıroğlu for each indicator, ensuring alignment with his proven technical analysis approach.
- Customizable Settings : Enable/disable individual indicators and fine-tune parameters to suit your trading style while retaining the option to revert to Şatıroğlu’s defaults.
- Enhanced User Experience : Modifications improve visual clarity, performance, and usability, with options like repainting smoothing for Nadaraya-Watson and adjustable Ichimoku projection periods.
- Multi-Timeframe Analysis : Combines trend-following, momentum, and divergence tools for a holistic view of market dynamics.
- Alert Conditions : Built-in alerts for SuperTrend direction changes, buy/sell signals, and divergence detections to keep you informed.
- Visual Clarity : Overlays (KAMA, SuperTrend, Nadaraya-Watson, Ichimoku) and pane-based indicators (WaveTrend, Divergences) are clearly distinguished, with customizable colors and styles.
Notes:
- The Nadaraya-Watson Envelope and Ichimoku Cloud may repaint in their default modes. Use the "Repainting Smoothing" option for Nadaraya-Watson or adjust Ichimoku settings to mitigate repainting if preferred.
- Published under the MIT License, with components licensed under GPL-3.0 (SuperTrend), CC BY-NC-SA 4.0 (Nadaraya-Watson), MPL 2.0 (Divergence), and TradingView's terms (Ichimoku Cloud).
Usage:
Add this indicator to your TradingView chart to leverage Tunç Şatıroğlu’s exact indicator configurations out of the box. Customize settings as needed to align with your strategy, and use the combined signals to identify trends, reversals, and divergences. Ideal for traders following Şatıroğlu’s methodologies or anyone seeking a powerful, all-in-one technical analysis tool.
Credits:
Original authors: LazyBear, HPotter, Alex Orekhov, LuxAlgo, LonesomeTheBlue, and TradingView.
Modifications and integration by beytun .
License:
Published under the MIT License, incorporating code under GPL-3.0, CC BY-NC-SA 4.0, MPL 2.0, and TradingView’s terms where applicable.

RSI Cloud v1.0 [PriceBlance] RSI Cloud v1.0 — Ichimoku-style Cloud on RSI(14), not on price.
Recalibrated baselines: EMA9 (Tenkan) for speed, WMA45 (Kijun) for stability.
Plus ADX-on-RSI to grade strength so you know when momentum persists or fades.
1. Introduction
RSI Cloud v1.0 applies an Ichimoku Cloud directly on RSI(14) to reveal momentum regimes earlier and cleaner than price-based views. We replaced Tenkan with EMA9 (faster, more responsive) and Kijun with WMA45 (slower, more stable) to fit a bounded oscillator (0–100). Forward spans (+26) and a lagging line (−26) provide a clear framework for trend bias and transitions.
To qualify signals, the indicator adds ADX computed on RSI—highlighting whether strength is weak, strong, or very strong, so you can decide when to follow, fade, or stand aside.
2. Core Mapping (Hook + Bullets)
At a glance: Ichimoku on RSI(14) with recalibrated baselines for a bounded oscillator.
Source: RSI(14)
Tenkan → EMA9(RSI) (fast, responsive)
Kijun → WMA45(RSI) (slow, stable)
Span A: classic Ichimoku midline, displaced +26
Span B: classic Ichimoku baseline, displaced +26
Lagging line: RSI shifted −26
3. Key Benefits (Why traders care)
Momentum regimes on RSI: position vs. Cloud = bull / bear / transition at a glance.
Cleaner confirmations: EMA9/WMA45 pairing cuts noise vs. raw 30/70 flips.
Earlier warnings: Cloud breaks on RSI often lead price-based confirmations.
4. ADX on RSI (Enhanced Strength Normalization)
Grade strength inside the RSI domain using ADX from ΔRSI:
ADX ≤ 20 → Weak (transparency = 60)
ADX ≤ 40 → Strong (transparency = 15)
ADX > 40 → Very strong (transparency = 0)
Use these tiers to decide when to trust, fade, or ignore a signal.
5. How to Read (Quick rules)
Bias / Regime
Bullish: RSI above Cloud and RSI > WMA45
Bearish: RSI below Cloud and RSI < WMA45
Neutral / Transition: all other cases
6. Settings (Copy & use)
RSI Length: 14 (default)
Tenkan: EMA9 on RSI · Kijun: WMA45 on RSI
Displacement: +26 (Span A/B) · −26 (Lagging)
Theme: PriceBlance Dark/Light
Visibility toggles: Cloud, Baselines, Lagging, labels/panel, Overbought/Oversold, Divergence, ADX-on-RSI (via transparency coloring)
7. Credits & License
Author/Brand: PriceBlance
Version: v1.0 (Free)
Watermark: PriceBlance • RSI Cloud v1.0
Disclaimer: Educational content; not financial advice.
8. CTA
If this helps, please ⭐ Star and Follow for updates & new tools.
Feedback is welcome—comment what you’d like added next (alerts, presets, visuals).
