Bookmap Footprint Imbalance BubblesFootprint Imbalance Bubbles (Bookmap Style)
Overview
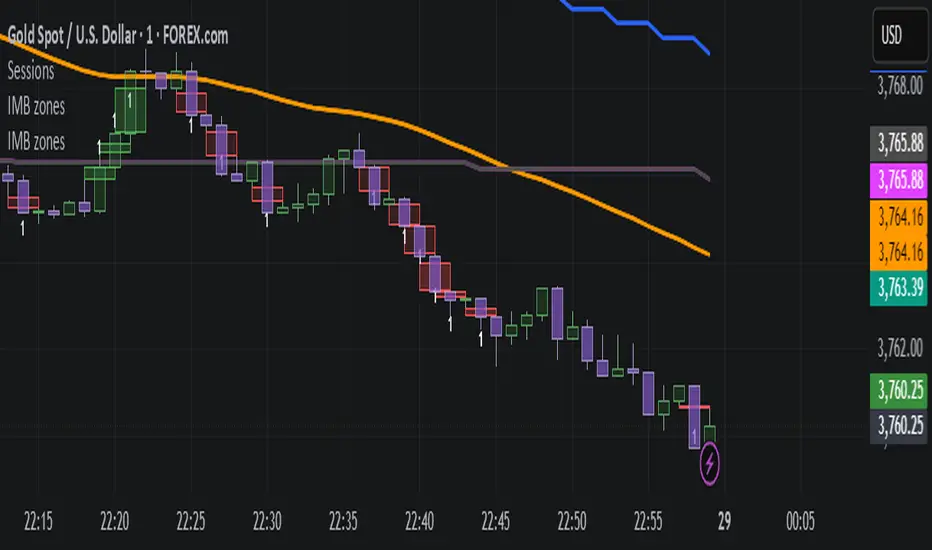
This indicator brings Bookmap-style order flow visualization directly to your TradingView charts. Instead of standard candles, it detects and plots "Bubbles" at specific price levels where aggressive buying or selling has occurred.
These bubbles represent Volume Imbalances —moments where aggressive market orders overwhelmed limit orders by a significant ratio (e.g., 300% more buying than selling). The size or transparency of the bubble indicates the magnitude of the volume, allowing you to spot "Whales", liquidity sweeps, and understand quality of a price move.
⚠️ Important Requirement
This script uses footprint charts.
To use this indicator, you may need a TradingView plan that supports Footprint Charts (typically Essential, Plus, or Premium). If your plan does not support footprint data, the indicator MAY NOT LOAD.
Footprint charts only have history accurate up to a certain extent(~5 days based on my testing). Replay mode will only be accurate during this timeframe, replaying further will result in unreliable footprint data, resulting in unreliable bubbles.
Key Features
1. Imbalance Detection
The script scans inside every candle at the tick level (Footprint data). It flags price levels where:
Aggressive Buyers > Sellers (by a user-defined ratio, e.g., 3x).
Aggressive Sellers > Buyers.
The total volume at that level exceeds a noise filter.
2. Dynamic Auto-Scaling
Auto-Scale Mode: The indicator automatically detects the largest volume bubble currently on your screen and scales all other bubbles relative to it. This ensures you always see the relative importance of trades, regardless of whether the asset is liquid (like BTC) or illiquid.
3. Two Visual Modes
Size Scaling (Classic): Bubbles grow larger as volume increases.
Transparency Scaling (Heatmap): Bubbles stay a fixed size but become more solid/opaque as volume increases.
4. POC (Point of Control)
Optionally plots a stepped line showing the Point of Control (highest volume price) for each bar, helping you track where value is migrating.
Settings Guide
General
Ticks per Row: Controls the granularity. 1 is the most detailed (tick-by-tick). Higher numbers (e.g., 5 or 10) group ticks together, useful for high-price assets like NQ or BTC.
Bubble Filters
Imbalance Ratio: The strength required to trigger a bubble. Default 3.0 means Buy Volume must be 3x Sell Volume.
Min Volume Filter: The minimum total volume required to show a bubble at all. Use this to hide "noise" and focus on significant activity.
Visual Modes
Auto-Scale Max Volume: Highly recommended. It adjusts the bubble definition based on the current chart view.
Manual Max Volume: If Auto-Scale is off, this defines what volume is required to create a "Huge" bubble.
Pine Script® indicator