FVG Sessions [LuxAlgo]The FVG Sessions indicator highlights the first fair value gap of the trading session as well as the session range. Detected fair value gaps extend to the end of the trading session.
Alerts are included on the formation of a session fair value gap, price being within a session fair value gap, mitigations, and price crossing session fair value gaps average.
🔶 USAGE
Trader ICT states that the first fair value gap of the trading session can attract the most significant reaction. Having only one FVG per session allows users to further focus on that precise imbalance as well as external elements.
The mitigation of a fair value gap is clearly indicated on the chart with a more transparent color allowing users to see inverse FVGs.
Extending the fair value gaps allows the imbalance area to provide potential support and resistance.
Do note that this script should be used on intraday charts.
🔶 ALERTS
The script includes the following alerts:
🔹 Bullish/Bearish FVG
Alerts on the formation of the first bullish or bearish FVG of the session.
🔹 Bullish/Bearish FVG Mitigation
Alerts when the first bullish or bearish FVG of the session is mitigated.
🔹 Price Within FVG
Alerts when price is within the first bullish or bearish FVG area of the session.
🔹 Price Cross FVG Average
Alerts when price cross the average level of the first bullish or bearish FVG of the session.
Imbalance

Fair Value Gap - FVG - HistogramThis indicator uses a histogram to represent "fair value gaps" ("FVG"). FVG is a popular pattern among modern traders.
This document describes the purpose of the script and discusses the conceptual meaning of "fair value," as well as the connotations attached to it.
█🚀 Based on the previous script - improved clarity
This indicator is a modified version of the "Three Bar Gap (Simple Price Action - with 1 line plot)" indicator, which is also available as open source and can be applied to a chart as a complementary tool along with this indicator.
Differences:
The previous version introduced a "Threshold filter" to reduce the number of lines plotted on charts. This filter introduced two additional parameters for users to consider (ATR length and multiplier). These parameters made the indicator more complicated than intended.
To address this issue of having too many lines in the former version, I proposed a spin-off on this version: It's to consider plotting the magnitude of the FVGs on a histogram instead of using lines on a price chart. In my opinion, a histogram is more suitable for decision-making because it lays out data points side-by-side as bins, which makes comparisons much clearer.
Minor FVGs are expected to have smaller bins compared to their neighboring bins, and in extreme cases, the bins will become seemingly invisible due to the auto-adjusted scale of the y-axis. Therefore, there is no need to filter out any data, and all FVGs can be included in this spin-off version.
█🚀 Candlestick patterns - revisited
This script calculates the displacement of highs and lows over three consecutive bars.
A) Down move: When the high of the recent-confirmed bar is lower than the low of the previous-previous candle.
B) Up move: When the low of the recently-confirmed bar is higher than the high of the previous-previous candle.
█🚀 Parameters
Core Functionality
The purpose of this indicator is to generate bins representing the magnitude of FVGs in the form of a histogram to facilitate the visualization of price movements.
The act of "finding FVGs" does not require any inputs, but users can still customize the colors of the bins to indicate the direction of movement.
Auxiliary functionality: “Key level finder” by searching for large FVGs
The following inputs are optional, in fact, the entire feature can be toggled on/off.
In this example, setting the lookback at 20 means the script will generate a signal if the current histogram bin is taller than all previous bins over the past 20 bars.
█🚀 Applications
Tall histogram bins = key levels .
Traders should observe key levels for entry or exit opportunities.
It is important to note that this indicator was designed for standard time-based charts.
On a separate note, FVGs will not appear in Renko charts with fixed-size bricks. This is because the bricks align with their neighboring bricks. When the bricks are fixed, any displacement between highs and lows within less than or equal to three bars will be zero.
The concept of a "gap" is used to illustrate that price follows a jump-diffusion process, and time intervals can be assigned arbitrarily on the x-axis without needing fixed intervals. This idea was briefly discussed in the previous script's write-up.
█🚀 FAQ: Does it repaint?
No. And please continue reading.
Bins are plotted with a one-bar delay. It only takes one bar for the FVG to become confirmed. Lag is beneficial because it clarifies the need for traders to wait for the bar to close and for the signals to become confirmed before entering or exiting a trade. Experienced traders know that prices tend to retrace, so there is no need to chase. An added bar of delay proves to be useful.
█🚀 Opinion: The term “fair value” can be misleading
Those who come from traditional finance may find the term "fair value gap" somewhat insulting. When encountering the phrase, it can feel like a group of aliens from "Planet Technical Analysis" have intrusively landed on your planet and assertively redefined what "fair value" is supposed to mean.
So, what does "fair value" mean in the realm of technical analysis?
In the world of corporate finance, "fair value" is a subjective estimate of what buyers and sellers are hypothetically willing to pay or accept. Buy-side and sell-side analysts use their own methodologies to determine what constitutes "fair value". These approaches may be based on income, asset, or market comparables. Regardless of the approach used, subjectivity is inherent, and results depend on fundamental data provided by the numbers on financial statements. Valuations are unrelated to candlestick patterns .
When dealing with financial statements, finance professionals who are non-market-participants, such as those working in group reporting practices for reporting issuers, or those hired as external auditors, as required by regulators, may also question what constitutes "fair value". The main concerns always revolve around the assumptions used in valuation models; these are inputs that ultimately require management's judgment, and if not critically questioned, valuations as reported in the statements could end up becoming materially bogus. Both IFRS and U.S. GAAP define "fair value" with the same intended meaning in terms of definitions. We will not delve into the details here. The main point is that "fair value" from a financial reporting perspective has nothing to do with candlesticks .
If a price is already quoted in an actively traded market, you can refer to it to obtain what is known as "mark-to-market". This involves simply referring to the bid or ask price on the reporting date, and you're done - there's no need to read candlesticks !
"Fair value" is a neutral term used by finance professionals in all domains. It is not meant to imply that something is actually "fair." Paying the "fair value" for an asset can still result in overpaying or underpaying for what the asset is worth, depending on different model assumptions. The point is, candlesticks are irrelevant to the analysis of what is considered "fair value" in the realm of traditional finance.
That being said, there is no definitive answer as to why people refer to this pattern as a "fair value gap". It's like one of those oddball interview questions asking you to explain why tennis balls are fuzzy. Whatever answer you give, it's important to note that the subject itself is trivial.
Emphasis of matter on why "fair value" can be misleading
The previous paragraphs were not intended to attack ideas from the realm of technical analysis, nor to assert the true meaning, or lack of meaning, of the term "fair value". Words are constantly evolving. If the term "fair value gap" becomes more widely used to describe the displacement of highs and lows over three bars, then let's call it a "fair value gap".
To be clear, I argue that the term "fair value gap" should not be given a positive connotation. Traders should interpret the word "fair" neutrally. Although these signals occur frequently, if you trade every time there is a signal, you will overtrade and incur astronomical transaction costs over the long run, which can lead to losses.
█🚀 Conclusion:
In the end, what matters is how you apply FVG to trading. As mentioned in the "Applications" section above, traders should look for large FVGs - indicated by tall histogram bins - to identify key levels.

Imbalance IndicatorDescription of the "Imbalance Indicator":
The Imbalance Indicator is a technical analysis tool designed to visualize the imbalance between two adjacent candlesticks on a price chart by drawing rectangles. It helps to identify the dominance of buyers or sellers during impulsive price movements within an upward or downward trend.
Here's how the indicator works:
1. It determines the direction of the trend (up or down) based on the closing prices of the last three candlesticks. An upward trend is identified if all three candlesticks close above their opening prices, while a downward trend is identified if they close below.
2. Depending on the direction of the trend, the indicator calculates the imbalance between the candlesticks. The imbalance is expressed as the difference between the low of the next candlestick and the high of the previous one for an upward trend, or between the low of the previous candlestick and the high of the next one for a downward trend. The imbalance value must be greater than 0.
3. If an imbalance is detected, the indicator draws a rectangle on the chart. The rectangle begins on the candlestick with the identified imbalance, with the upper boundary at the upper edge of the imbalance and the lower boundary at the lower edge of the imbalance.
4. The color of the rectangle depends on the direction of the trend: green for an upward trend and red for a downward trend.
5. The rectangle dynamically extends to the right until it is intersected by subsequent candlesticks by 50% or more (by default). The intersection can occur with various combinations (shadow, body, or shadow + body of the candlestick). Once this happens, the rectangle ends on the last overlapping candlestick. The percentage of overlap in height is adjustable within a range of 1 to 100, with a default value of 50%.
Use the Imbalance Indicator to identify areas of probable price reversal. Algorithms tend to cover the imbalance and trade within the range where it formed, creating a potential magnet for the price.
==RUS=======================================
Описание индикатора "Imbalance Indicator":
Imbalance Indicator - это индикатор, предназначенный для визуализации имбаланса между двумя соседними свечами на графике путем рисования прямоугольников. Он помогает определить доминирование покупателей или продавцов во время импульсного движение цены на восходящем или нисходящем тренде.
Вот как работает индикатор:
1. Он определяет направление тренда (вверх или вниз) на основе закрытия последних трех свечей. Тренд вверх определяется, если все три свечи закрылись выше своих открытий, а тренд вниз - если ниже.
2. В зависимости от направления тренда, индикатор вычисляет имбаланс между свечами. Имбаланс выражается в виде разницы между низом следующей свечи и верхом предыдущей свечи для восходящего тренда или между низом предыдущей свечи и верхом следующей свечи для нисходящего тренда. Значение имбаланса должно быть больше 0.
3. Если имбаланс обнаружен, индикатор рисует прямоугольник на графике. Прямоугольник начинается на свече с найденным имбалансом, верхняя граница прямоугольника находится на верхней границе имбаланса, а нижняя граница - на нижней границе имбаланса.
4. Цвет прямоугольника зависит от направления тренда: зеленый для восходящего тренда и красный для нисходящего тренда.
5. Прямоугольник продолжается вправо динамически, пока его не пересекут следующие свечи на 50% или более (по умолчанию). Пересечение может произойти различными комбинациями (тень, тело или тень + тело свечи). Как только это происходит, прямоугольник заканчивается на последней перекрывающей его свече. Процент перекрытия по высоте настраивается в интервале от 1 до 100, по умолчанию значение 50%.
Используйте Imbalance Indicator для определения зон вероятного возврата цены. Алгоритмы стремятся перекрыть имбаланс и проторговать диапазон, в котором он образовался, это потенциальный магнит для цены.

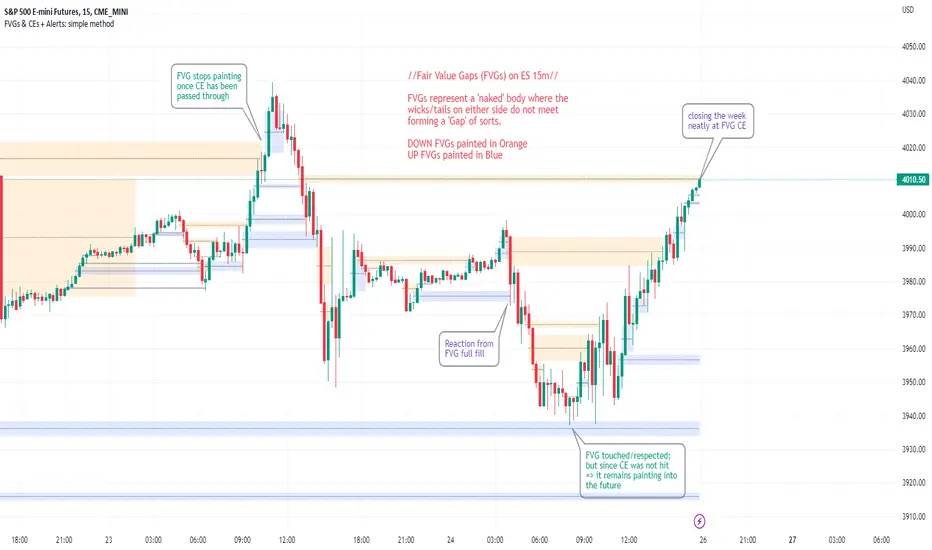
FVGs & CEs + Alerts: simple & efficient methodFair Value Gap indicator: Paints FVGs and their midlines (CEs). Stops painting when CE is hit, or when fully filled; user choice of threshold. This threshold is also used in the Alert conditions.
~~Plotted here on ES1! (CME), on the 15m timeframe~~
-A FVG represents a 'naked' body where the wicks/tails on either side do not meet. This can be seen as a type of 'gap', which price will have a tendency to want to re-fill (in part or in full).
-The midline (CE, or 'Consequent encroachment') of FVGs also tend to show price sensitivity.
-This indicator paints all FVGs until priced into, and should give an idea of which are more meaningful and which are best ignored (based on context: location, Time of day, market structure, etc).
-This is a simpler and more efficient method of painting Fair value gaps which auto-stop painting when price reaches them.
//Aims of Publishing:
-Education of ICT concepts of Fair Value Gaps and their midlines (CEs): To easily see via forward testing or backtesting, the sensitivity that price shows to these areas & levels.
-Demonstration of a much more efficient way of plotting FVGs which terminate at price, thanks to a modification of @Bjorgums's clever looping method referenced below.
//Settings:
-Toggle on/off upward and downward FVGs independently(blue and orange by default).
-Toggle on/off midline (CE).
-Standard color/line formatting options.
-Choose Threshold: CE of FVG or Full Fill of FVG: This will determine both the 'stop-painting' trigger and the 'Alert' trigger.
-Choose number of days lookback to control how many historical FVGs paint on chart.
//On alerts:
-Simple choice of 2 alerts:
~~One for price crossing into/above the nearest untouched 'premium' FVG above ( orange ). Trigger is user choice of CE or full fill.
~~Another for price crossing into/below the nearest untouched 'discount' FVG below (blue). Trigger is user choice of CE or full fill.
-Alerts set via the three dots in indicator status line.
//Cautionary notes:
-Do not use the alerts blindly to find trades. Wait until you have identified a good FVG above/below which you think price may show sensitivity to
-Usage on very low timeframes can cause unexpected results with alerts: due to new FVGs forming in realtime the Alert will always trigger at the most recent FVG above/ below having its threshold hit.
-Big thank you to @Bjorgum for his fantastic extendAndRemove method. Modified here for use with boxes and to integrate Alerts.
-Also Credit to ICT (inner circle trader) for the concepts used here: Fair value gaps and their Consequent Encroachment (CE).
ICT Implied Fair Value Gap (IFVG) [LuxAlgo]An Implied Fair Value Gap (IFVG) is a three candles imbalance formation conceptualized by ICT that is based on detecting a larger candle body & then measuring the average between the two adjacent candle shadows.
This indicator automatically detects this imbalance formation on your charts and can be extended by a user set number of bars.
The IFVG average can also be extended until a new respective IFVG is detected, serving as a support/resistance line.
Alerts for the detection of bullish/bearish IFVG's are also included in this script.
🔶 SETTINGS
Shadow Threshold %: Threshold percentage used to filter out IFVG's with low adjacent candles shadows.
IFVG Extension: Number of bars used to extend highlighted IFVG's areas.
Extend Averages: Extend IFVG's averages up to a new detected respective IFVG.
🔶 USAGE
Users of this indicator can primarily find it useful for trading imbalances just as they would for trading regular Fair Value Gaps or other imbalances, which aims to highlight a disparity between supply & demand.
For trading a bullish IFVG, users can find this imbalance as an area where price is likely to fill or act as an area of support.
In the same way, a user could trade bearish IFVGs by seeing it as a potential area to be filled or act as resistance within a downtrend.
Users can also extend the IFVG averages and use them as longer-term support/resistances levels. This can highlight the ability of detected IFVG to provide longer term significant support and resistance levels.
🔶 DETAILS
Various methods have been proposed for the detection of regular FVG's, and as such it would not be uncommon to see various methods for the implied version.
We propose the following identification rules for the algorithmic detection of IFVG's:
🔹 Bullish
Central candle body is larger than the body of the adjacent candles.
Current price low is higher than high price two bars ago.
Current candle lower shadow makes up more than p percent of its total candle range.
Candle upper shadow two bars ago makes up more than p percent of its total candle range.
The average of the current candle lower shadow is greater than the average of the candle upper shadow two bars ago.
where p is the user set threshold.
🔹 Bearish
Central candle body is larger than the body of the adjacent candles.
Current price high is higher than low price two bars ago.
Current candle upper shadow makes up more than p percent of its total candle range.
Candle lower shadow two bars ago makes up more than p percent of its total candle range.
The average of the candle lower shadow 2 bars ago is greater than the average of the current candle higher shadow.
where p is the user set threshold.
🔶 SUPPLEMENTARY MATERIAL
You can see our previously posted script that detects various imbalances as well as regular Fair Value Gaps which have very similar usability to Implied Fair Value Gaps here:

ICT Opening Gaps [MK]
The indicator plots levels which can act as magnets to price. The levels are gap areas which are used within the ICT (The Inner Circle Trader) trading system.
The indicator plots 5 areas of interest:
1: Daily Volume Imbalances - Referencing the Daily chart, boxes are calculated from close to open between all candles. Candles which have only 'wicks' between the close and open prices are considered 'volume imbalances. The boxes can then be shown on LTFs to aid in decision making for intraday traders. Imbalances can be limited to a maximum amount shown and mitigated imbalances can be removed from the chart. All colors can be customised.
Volume Imbalance example:
2: NWOG - New Week Opening Gap - Plotted from Friday Close at 1659 to Sunday Opening at 1800 (EST). The current NWOG can be displayed on its own, or previous weeks can also be shown (ICT recommends the previous 4 weeks also). Boxes are plotted with a midline and all colors can be customised.
New Week Opening Gaps example:
3. NDOG - New Day Opening Gaps - Plotted from day close at 1659 (EST) to restart at 1800 (EST). All colors can be customised. These gaps can be very small so line widths of 3+ are recommended if the lines are to be seen on HTFs
New Day Opening Gap example:
4. New Opening Gap - Plotted from close at 1659 to Session open at 0930 (EST). These areas can possibly be closed/filled after opening at some time. The indicator will draw box to the right of price which shows if the Opening Gap is UP or DOWN. The box will change color to show up or down, or text alone can be used instead of the box. All colors can be customised.
New Opening Gap Box example:
5. 0930 Opening Line - Draws a horizontal line from the opening price at 0930 (EST) to the last bar on the chart. This is the level used to calculate the New Opening Gap. All colors can be customised.
0930 Opening Line example:

Gaps + Imbalances + Wicks (MTF) - By LeviathanThis script will identify and draw price gaps, wicks and imbalances with customizable fill conditions, multi-timeframe function, zone size filtering, volume comparison, lookback filtering, as well as highly customizable appearance and settings.
I’ve made this indicator to combine the three similar but different elements that occur in price movements and serve as significant zones of interest or way of PA interpretation in various different strategies.
Imbalances (or Fair Value Gap/FVG/Inefficiency/whatever)
- The Imbalance “pattern” consists of 3 candles (1- candle before the sharp move, 2 - sharp move candle and 3- candle after the sharp move). When price makes a move downwards, the imbalance zone is defined as the area between the low of 1 and the high of 3 When price makes a move upwards, the imbalance zone is defined as the area between the high of 1 and the low of 3.
Gaps
A price gap is an area on a chart where no trading activity has taken place. A gap up means that the low of the current candle is higher than the high of the previous candle and a gap down means that the high of the current candle is lower than the low of the previous candle.
Wicks (or shadows/tails/whatever)
Wicks are used to indicate where the price has fluctuated relative to the opening and closing price of the candle. An upper wick is the zone between candle high and candle close/open (whichever is higher) and a lower wick is the zone between candle’s low and candle’s close/open (whichever is lower).
Settings Overview
“Zone Type” - This input lets you decide which zones should the script plot and on which timeframe. You should always pick a timeframe higher than your chat’s.
“Middle Line, Top Line, Bottom Line” - Show or hide the Middle Line (horizontal level in the middle of each zone), Show or hide Top Line (horizontal level at the top of the zone), Show or hide Bottom Line (horizontal level at the bottom of the zone)
“UP/DOWN Zones" - This input lets you show/hide UP Zones or DOWN Zones an pick their color, border color and label color.
”Fill Condition” - If turned ON, the zones will end drawing when your prefered Fill Condition is met (Full Filll = price mitigates the whole zone, Half Fill = zone is at least halfway mitigated and Touch = zone is touched by price). If turned OFF, the zones will only be plotted for the amount of bars defined it “Zone Length”.
”Lookback (D)” - This input lets you limit the amount of zones plotted on the chart by choosing how many days back in time should the script go to find and plot zones. For example, input 1 will only show you the zones of the past day, input 7 will only show you the zones of the past week.
”Hide Filled Zones” - If turned ON, the zones that have been filled will be removed from the chart.
”Show Boxes” - Show or hide the boxes that represent the zones. This is useful for those who want the zones to be visualized by just lines.
“Filter Type” - this input lets you create a filter that will make the script only show zones that are larger than ATR or larger than a certain percentage. You can choose the ATR Length and the multiplier (higher multiplier → larger zone required), as well as the Percentage (%) and its multiplier (higher percentage → larger zone required). If you choose “None”, the zones of all sizes will be plotted.
”Zone Labels” - this part of the settings lets you: show/hide labels, decide on the size of the labels and their positions, choose a custom name for each zone, choose the data that the labels present (Type of the zone/Timeframe/ Volume ).
”Other settings” - ‘Stop/Delete zone after X number of candles’ will force stop/delete the zone if it’s plotted for more than prefered number of bars. ‘Line Style’ lets you choose the style and the color of the lines, ‘Zone Length’ defines the length of the zone if Fill Condition is “None”.
More settings, modifications and improvements coming in future updates. This script is a bit old so I will clean up and optimize the code once I have more time.

Smart Money Add-Ons [TFO]Supplementing my “Smart Money Essentials ” indicator, these add-ons provide some more commonly used “Smart Money Concepts,” including SMT Divergence, and HTF POI, and open price lines for added confluence.
Smart Money Technique (SMT) Divergence is meant to annotate divergence between closely correlated assets. Take $ES_F and $NQ_F for example (S&P 500 and Nasdaq 100 futures). These two names normally track each other very closely, but if $ES_F is steadily rising towards a large institutional level and making higher highs, while $NQ_F is approaching a similarly important level and making lower highs on that same timeframe, this would indicate a divergence between the two assets that could foreshadow a “Smart Money Reversal.”
Open price lines can provide intraday levels of interest from important times of day, where the defaults are set to midnight (12:00 AM), 8:30 AM for news releases, and 9:30 AM New York market open (New York local time). The open prices at these times can often act as support and resistance when other confluence factors are present. Higher timeframe points of interest (HTF POI) are also helpful to remain mindful of imbalances and other inefficiencies in which lower timeframe price action may create some reversal structure.

Three Bar Gap (Simple Price Action - with 1 line plot)This script is tailored towards experienced traders who prefer to view raw price charts during live execution. It searches for a three-bar pattern of what is colloquially called "fair value gap", or "imbalance" and uses a single line to plot the results. The goal is to display price in a way that is as simple as possible so that chart readers who don't prefer to add indicators on their screen will still find this indicator as an acceptable option to consider for.
From a code perspective, this script explores a new PineScript feature called UDT (user-defined types). This is an incredible update because it brings developers one step close to having the ability to create abstract data types.
█ What is price action?
Experienced traders will tell you that the chart that they use for live execution is raw, clean, and uses no indicators. They say they execute on price action, so what exactly is price action?
There is no formal definition to it, but one can agree that it implies the process of analyzing price without considering the fundamentals, without needing to know what the news was about, and without needing to know any of the Greeks (except for the desire to “seek alpha” Ha.haa...). This is not to say that price action traders are executing in their own vacuums without the need to know what is happening around the world. Surely fundamentals and financial models can be used beforehand for developing a bias for what is being traded, but it’s price-first at the moment of execution. That said, Factor (A) is Price.
Factor (B) is time-perception, it’s how the trader reads the tape. How the trader perceives price to change with respect to time is valuable information. Interpretation of "time" will be elaborated in the next section that talks about candlestick patterns detected by this script.
Putting this together, price action means the analysis of price movement by only considering (A) price, and (B) time, to predict which direction the market will move. A speculative trader is timing the market with the expectation to make a quick in-and-out profit; she/she is using price action. On the other hand, a long term investor holding a diversified portfolio with a strategy based on modern portfolio theory combined with fundamental analysis (at this point candlesticks are irrelevant) but has one additional criteria of, say, can only go Long on a stock when it has closed Green on Daily; he/she is also considered to be executing on price action.
█ Candlestick patterns
This script calculates the displacement of highs and lows over three consecutive bars.
A) Down move = When High of the recent confirmed bar is lower than the Low of the previous-previous candle
B) Up move = When Low of the recent confirmed bar is higher than the High of the previous-previous candle
(Note that its the confirmed bar that is being talked about, so it does not repaint)
An ATR filter will be applied to reduce the number of lines generated as many times they might just be associated with minor price changes.
Interpretations:
When price moves quickly across three bars, it can be thought that it has gapped. Although the candle in the middle appears to be solid, it’s not from a conceptual perspective. This is because time itself is arbitrary; timeframes don’t necessarily have to be fixed intervals. Take stocks with regular trading hours for example, if price makes a breakaway gap and you bundle the after-hours and pre-market sessions together as one candle, never minding that intervals should be fixed, then you will see the exact three-bar-gap patterns. Similar happens during intraday sessions on lower timeframes, if you zoom-in closer, you’ll see that ticks within the middle candle are sparsely dispersed. This is why it's called a gap.
█ Parameters with fixed inputs & assumptions used:
ATR is used for filtering out minor movements that will likely be deemed as irrelevant by trader for the purpose of live execution. The following inputs are required:
A) ATR lookback period
B) Multiplier
The product of ATR(len=A) and B produces a threshold for minimum distance that price must gap by. Initially, it was proposed to be only based on one ATR, but often an ATR is too wide and using it will filter out too many lines. Because of this observation, a multiplier (Parameter B) has been introduced to allow users to apply fractional ATR as a threshold.
█ Applications:
For trend followers: Follow the direction of the gap. Entering above recent high/low points above/below the first impulse with a stop-limit order is a viable tactic.
For contrarians fading a trend: The mid-point is a good point of reference for predicting potential areas of support/resistance.

Liquidity Hunter - FattyTradesThis indicator is used to automatically identify and plot two forms of liquidity that will be targeted by market makers.
The first form of liquidity is based on multi-time fame highs and lows. It plots 1H, 4H, D, W, & M liquidity on an intraday chart to make it easier to identify. I believe hat liquidity is what drives the market and the most common form of this liquidity can be identified through higher time frame highs and lows. You can use whatever method you prefer to determine which liquidity pool will be targeted. When the liquidity is purged, it will be shown as dotted lines. This should not be used as traditional support/resistance, but rather as targets for the market.
The second form of liquidity is in the form of imbalances or fair value gaps. You can select a higher time frame to be plotted along with the current time frame you're viewing to identify imbalances that will likely be targeted intraday. We know that higher time frame fair value gaps work equally well as targets for market makers. When a higher time frame FVG is broken into, it can also act as a very powerful form of support and resistance. By default, when a fair value gap has been mitigated it will be removed from the chart, however this can be disabled.
Between these two forms of market maker liquidity targets on the chart, it will be easier to formulate a thesis intraday to determine where the market will move. It can help minimize the amount of switching between higher time frames that needs to be done, allowing you to identify targets while trading on your favorite intraday time frame for optimal risk/reward.
In the near future, I will build in alerting mechanism to alert when liquidity on higher time frames as been purged/mitigated.

Bagang Pivot Zones | Supply & Demand, Support & ResistanceBagang Pivot Zones detects imbalances from classic reversal and momentum price actions.
Imbalances create pivot zones, a.k.a Supply & Demand / Support & Resistance / Orderblock zones.
Use Cases
1. Traders using Supply & Demand theory can quickly pinpoint imbalance zones created by BUY-to-SELL and SELL-to-BUY candles.
2. Trend Following traders can systematically catch and follow a trend based on pivot zones analysis.
3. Breakout traders can easily target pivot zones’ breakout and breakdown.
4. Take the guesswork out of risk management: manage stop-loss precisely behind pivot zones.
5. Analyze contrary pivot zones to set realistic profit targets.
Objectivity
By only comparing OHLC values to identify notable price actions, Bagang Pivot Zones avoids derived calculations with subjective parameters.
Chart Issue
If the chart zooms out after adding an indicator, right-click the price scale and toggle "Scale price chart only” on.

Imbalance Detector [LuxAlgo]This indicator detects and highlights market imbalances alongside a dashboard returning information about their frequency of occurrence and their fill percentage. Imbalances included in this script are Fair Value Gaps (FVG), Opening Gaps (OG) and Volume Imbalances (VI).
Alerts are available for the occurrences of all market imbalances.
Settings
Imbalances
Each imbalance has the same settings layout:
Imbalance: Enable/disable the detection of the specific imbalance.
Min Width: If enabled, requires the imbalance area width to be greater than the specified value. This minimum width can be expressed in points, percentages or ATR multiples.
Extend: Extend imbalances by a specified number of bars.
Dashboard
Show Dashboard: Enable/disable the dashboard on the chart.
Dashboard Location: Location of the dashboard on the chart.
Dashboard Size: Size of the dashboard.
Usage
Market imbalances are part of the many concepts available to price action traders and highlight areas where there is a disparity between supply and demand.
It is common to see price come back to these areas and traders often use them as supports and resistances but also as targets.
Details
The script can detect three distinct types of imbalances described below.
Fair Value Gaps
Fair Value Gaps (FVG) are three candle formations characterized by a gap between the wicks of the non-adjacent candles in the formation.
A bullish FVG is characterized by a gap between the current price low and the 2 bars anterior price high, and a bearish FVG is characterized by a gap between the current price high and the 2 bars anterior price low.
Opening Gaps
Opening Gaps (OG) are imbalances characterized by non-existent activity within a specific price range.
A bullish OG occurs when the current price low is greater than the previous high, a bearish OG occurs when price high is lower than the previous price low.
Opening Gaps primarily occur in closing markets, as such they are less common in the cryptocurrency market.
Most of the time an Opening Gap will also be accompanied by a Fair Value Gap, in order to avoid clutter the indicator will not detect Fair Value Gaps if Opening Gaps are enabled and if an Opening Gap has been detected
Volume Imbalances
Volume Imbalances (VI) are characterized by a price discontinuity between the opening price and previous close, but unlike Opening Gaps we do not see nonexistent activity within a certain price range.
A bullish VI occur when both the opening and closing prices are superior to the previous closing price, with the current price low overlapping the previous price high. A bearish VI occur when both the opening and closing prices are inferior to the previous closing price, with the current price high overlapping the previous price low.
Because Volume Imbalances can occur excessively on markets with frequent gaps, we make use of an additional condition for filtering out less significant imbalances. Bullish VI's will require the previous price high to be lower than the opening price, while bullish VI's will require the previous price low to be higher than the opening price.

Automatic Closest FVG with BPRFair Value Gaps are a hugely popular concept and because of that there are numerous indicators available. This one however, was designed to automate the process of actually using them in trading.
Designed with lower time frame entries in mind (though will work on HTF just as well), this indicator automatically draws the closest, non-mitigated FVG, to the current price, cutting out the work of looking for what FVG is relevant.
The indicator also has an option to show when the current nearest pair of FVGs form a BPR or 'balanced price range'.
There are various option for what counts as mitigation, including no mitigation at all, and when mitigated an FVG is no longer considered for proximity searching.

ICT - GAPs and Volume Imbalance
GAPs
Gaps are areas on chart where the price have moved sharply up or down, with no trading in between. Gaps often fill, but they don't have to.
Volume Imbalance
Volume imbalance - determined using 2 candles
Bullish Volume Imbalance - area between the close of 1st candle and the open of 2nd candle
Bearish Volume Imbalance - area between the close of 1st candle and the open of 2nd candle
How to use the indicator:-
When you find imbalance in volume or a GAP in the chart, you may expect price to rebalance it before continuation.
Importantly, GAPs/Imbalances do not always fill. Traders should never assume that a gap/imbalance will fill without understanding the reasons for the gap and monitoring trading activity around the gap.
Pair it with your current bias for better results.

Sonarlab - Double Fair Value Gap (DFVG)The Double Fair Value Gap will give great zones where price in the future can react off. The script is Multi Timeframe. Of course the name says it already, the script basically searches for area's where a FVG gets rebalanced with another Fair Value Gap - a double fair value gap. Amazing for searching strong buying and selling pressure in the markets.
You can see below for example that price creates a Double Fair Value Gap and comes back to fill it.
You can customize the script how you like it, with the following settings and inputs:
Show double fair value gap
DFVG Lookback: {value}
Display Limit {value}
Colors: Bullish and Bearish DFVG
Extension
Extend to {recent or max}
Custom extension: {value}
Mitigation
Mitigated: {remove or stop}
Mitigation level {value %}
Customize Box Text
Premium Zone
Midline
Show midline
Styling settings
Alerts]
Bullish Alert
Bearish Alert

Automatic Order Block + Imbalance by D. BrigagliaThis script combines automatic orderblock and imbalance tracking.
Bullish OB - Blue
Bullish Imbalance - Green
Bearish OB - Red
Bearish Imbalance - Orange
Please note that the actual definitions of orderblock and imbalance are not respected in this script for the sake of simplicity. Scripts that are too complex may overfit some particular chart. Since there is no way to translate the actual ob and imb definitions into pinescript language, I decided to keep it simple.
Ideally, you want to see a bullish OB followed by buy side imbalance, or viceversa. OBs that are broken weakly are generally invalidated, ones that are broken strongly generally become breakers, and you can use them as good support/resistance levels.
Also, a good thing you can do when an OB and an imbalance match, is going in the lower timeframes and catching the structure reversal in the OB or imbalance zone. That may provide excellent RR trades. Always trade with OB that confirm the HTF trend.
Nothing in my content on tradingview is considerable investment advice.

FVG / Imbalance ZONES (@JP7FX)Fair Value Gaps / Imbalance are created when Price moves away in one direction at speed / impulsively.
A gap is created between the first and third candle wick which creates the Imbalance / Fair Value Gap and is sometimes a potential area of where the market could return
making the area a good place to look to trade from or to aim for.
This Imbalance / Fair Value Gap indicator will change the color of the candles where these gaps have been created and also create a zone.
Although the candle color will not change, the zone however will be removed when price has closed the Gap making it easier to look for the untouched Fair Value Gaps / Imbalance when opening the charts or changing between timeframes and allowing you to create your potential areas to trade from or areas to target.
You can set alerts for when a FVG / Imbalance zones are created and also for when the zone gets mitigated by price.
Hope you find it useful and happy safe trading :)

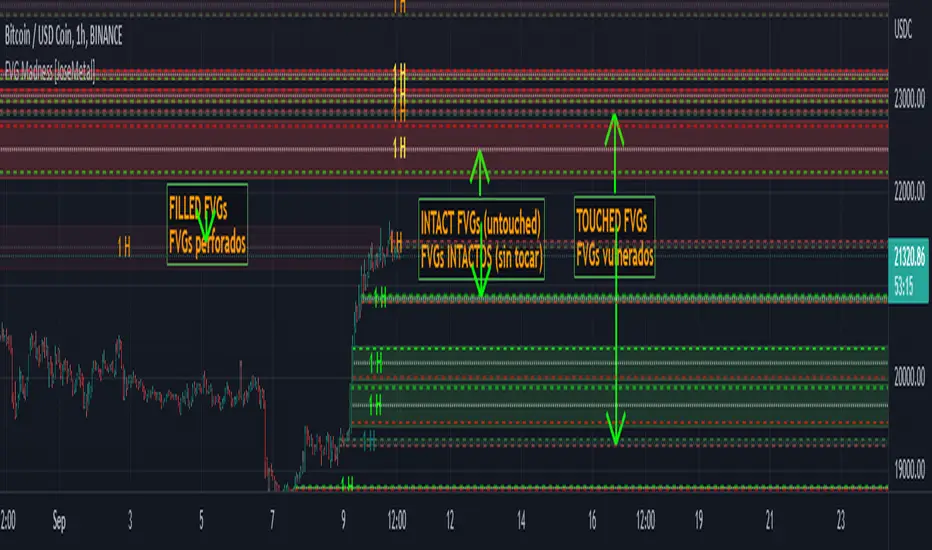
FVG Madness [JoseMetal]============
ENGLISH
============
- Description:
FVG (Fair Value Gap) / imbalances are inefficiencies in the price action generated by violent prices changes, the market is supposed to try to fill or at least retest these later on.
This is just one of the "Smart Money Concepts" or "Institutional trading", and there are different strategies to trade them.
Some use them as "price magnets", but in my case I use them to let orders placed on the "entry" line and take profit on the "exit" line, for both LONG or SHORT.
Others use them as reversal points (50% of the FVG), that's why I added a 50% line to each FVG, I want to make it usable for every single strategy related to FVGs.
Take your time to back test, study, and pick the best strategy for you as you'd do with any other indicator.
- Visual:
So like a "generic" FVG indicator this one also prints the FVGs, colors are customizable for both, bullish and bearish FVGs.
When a FVG is "touched" but not "filled" it changes color, which is also customizable.
As I said I use them as entry and take profit, so I added 3 lines, an entry line, midline and exit line, all have custom colors for both "untouched" and "touched" FVGs for better visualization.
- Customization:
All colors are customizable for both "untouched" and "touched" FVGs as well as their lines as well as the line style (so you can have dashed entry and exit for example but dotted midline, full customization).
You can pick to auto-delete a FVG if not filled completely but a percentage.
Entry and exit lines can be placed based on a percentage too.
Boxes for the FVGs can be extended or not.
There's an ATR (Average True Ratio) filter to ignore (don't plot) small FVGs which would only mess the chart, is custom, but default value is recommended.
- Usage and recommendations:
FVGs are supposed to work on any timeframes, i've seen traders using my strategy (placer a STOP LIMIT on the entry line and take profit on the exit line) even on 1 minute, however, if you have several FVGs you can aim to open a single position and take partial profit on each FVG.
Finally, on my back test i've seen that on 4H+ timeframes a lot of FVGs are only filled up to 50% as one of the mentioned strategies so make sure to move your stop to break even on that point or even close half or the position, just a recommendation to avoid absurd loses.
Enjoy!
============
ESPAÑOL
============
- Descripción:
Los FVG (Fair Value Gap) / imbalances son ineficiencias en la acción del precio generadas por cambios violentos en el mismo, se supone que el mercado trata de llenarlos o al menos volver a testearlos más tarde.
Éste es uno de los "Smart Money Concepts" o "Trading Institucional", y hay diferentes estrategias para operar con ellos.
Algunos los utilizan como "imanes del precio", pero en mi caso los utilizo para que las órdenes se coloquen en la línea de "entrada" y tomen ganancias en la línea de "salida", tanto para LONG como para SHORT.
Otros los usan como puntos de reversión (50% del FVG), por eso añadí una línea del 50% a cada FVG, quiero que sea utilizable para cada estrategia relacionada con los FVGs.
Tómate tu tiempo para hacer pruebas, estudiar y elegir la mejor estrategia como lo harías con cualquier otro indicador.
- Visual:
Al igual que un indicador FVG "genérico" este también dibuja los FVGs, los colores son personalizables para ambos, FVGs alcistas y bajistas.
Cuando un FVG es "tocado" pero no "llenado" cambia de color, que también es personalizable.
Como dije, los uso como entrada y toma de ganancias, así que agregué 3 líneas, una línea de entrada, una línea media y una línea de salida, todas tienen colores personalizados tanto para los FVGs "no tocados" como para los "tocados" para una mejor visualización.
- Personalización:
Todos los colores son personalizables tanto para los FVGs "intactos" como para los "tocados", así como sus líneas y el estilo de las mismas (por lo que puede tener la entrada y la salida punteadas, por ejemplo, pero la línea media punteada, personalización total).
Se puede elegir auto-borrar un FVG si es rellenado un determinado porcentaje en lugar de completo.
Las líneas de entrada y salida pueden ser colocadas en base a un porcentaje también.
Las cajas para los FVGs pueden ser extendidas o no.
Hay un filtro ATR (Average True Ratio) para ignorar (no dibujar) los FVGs pequeños que sólo ensuciarían el gráfico, es personalizado, pero se recomienda el valor por defecto.
- Uso y recomendaciones:
Los FVGs se supone que funcionan en cualquier marco de tiempo, he visto operadores que utilizan mi estrategia (colocar una orden en la línea de entrada y tomar ganancias en la línea de salida) incluso en 1 minuto, sin embargo, si se acumulan muchos FVGs pequeños se puede para abrir una sola posición y tomar ganancias parciales en cada FVG.
Por último, en mis pruebas he visto que en marcos de tiempo de 4H+ muchos FVGs sólo se llenan hasta el 50% como una de las estrategias mencionadas, así que asegúrate de mover tu stop para alcanzar el punto de equilibrio o incluso cerrar la mitad de la posición, es sólo una recomendación para evitar pérdidas absurdas.
¡Que lo disfrutéis!
Mark FVGsMark FVGs is marking FVG (stands for Fair Value Gap, other name is Imbalance or IMB) on your chart so that you can instantly detect them
It supports:
- marking bullish and bearish partly filled or unfilled FVGs of the current timeframe
- marking bullish and bearish already filled FVGs of the current timeframe
- marking bullish and bearish FVGs of the any 4 timeframes on your current timeframe
technically it re-builds them on the last bar or as soon as new realtime bar is updated. it looks with 1k bars back to find the nearest specific number of FGVs
Adjustments:
- changing the maximum number of FVGs to display.
- changing the color of FVG area
- displaying already filled FVG of the current time frame
- changing the mode of displaying area it can either extended or fixed width
- displaying labels of other time frame FVGs

Sonarlab - MTF Imbalance/ FVGAn imbalance is created when the order block creates such impulsive volume in the market that it throws off the equilibrium between buyers and sellers, forming a gap. This is referred to as imbalance or FVG. These gaps act as a magnet for price to retrace to, in order to correct the disturbance in market equilibrium.
Imbalances = FVG
This image above shows you how an imbalance is created in the market using 3 candles. As we all know, candle sticks represent a specific time-range - for example: 1H. This means that inside 1 candle stick, there are 60 1 minute candle sticks resting. What I'm trying to say with this is that you get a totally different picture when you are on the lower timeframes. An imbalance can be overlooked, so it can be very helpful to have the multiple timeframe Imbalances on your screen, so you understand what is actually going on in the bigger picture.
Usage
Focused on combining with SMC:
When trading SMC, Imbalances can be great for POI's (point of interests) or using as targets in the market. Imbalances work like magnets in the market. When the market is imbalanced, it mostly wants to balance those gaps and can sometimes react perfectly from the area's. Besides that, it can really give you an idea who is in control at that moment.
Here you can see an example of an Imbalance when on the 1H timeframe - in the next picture below you can see the exact same imbalance, but then on the 3M. Now you understand why it can be overlooked?
So, imbalances/ FVG's:
- Increase probability of certain Point of Interests
- Can be a sign of strong interest in price areas
- Can be used as targets
- Can be used as POI's
What makes this Imbalance indicator different?
The Sonarlab MTF Imbalance indicator makes it possible to show up to 3 higher timeframes, which makes it easier to do your analysis and spot these areas when trading.
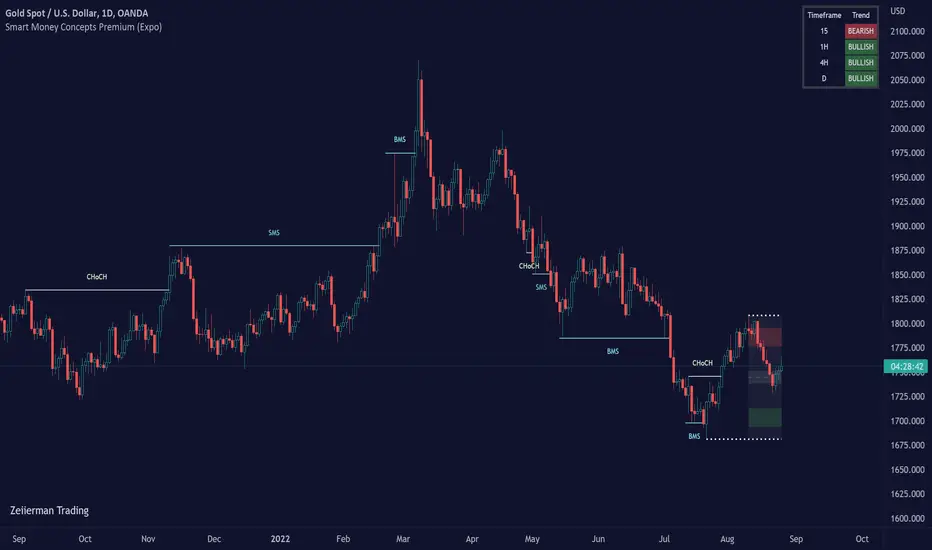
Smart Money Concepts Premium (Expo)Are you a professional Smart Money Concept Trader?
█ This premium version of our SMC indicator includes all advanced Smart Money Concept Trading techniques. The indicator includes all the important concepts such as Market Structure, Change of Character, Current Trading Range, Premium & Discount , Fractals, and Swing Structure. The indicator includes the popular SMC Market Structure Trend to help traders analyze the trend.
In addition to these features, this version adds the following:
Multitimeframe option
Predicted Structure and Range
Backtesting option
External Range Liquidity
Internal Range Liquidity
Liquidity Grab
Fair Value Gap (FVG)
True Fair Value Gap
Imbalance
Order block
Orderflow
Supply & Demand
Equal Highs and Equal Lows
Point of Interest
An alert function that allows you to set any combination of alerts.
This indicator aims to be an all-in-one SMC indicator that helps Smart Money Traders automate their analyzes.
█ HOW TO USE
Use the indicator to trade advanced SMC Trading techniques.
█ Settings
The indicator is fully customized and can be adjusted to fit Swing Trading, Trend Trading, Day Trading, or Scalping.
The indicator works in any market and timeframe.
-----------------
Disclaimer
Copyright by Zeiierman.
The information contained in my Scripts/Indicators/Ideas/Algos/Systems does not constitute financial advice or a solicitation to buy or sell any securities of any type. I will not accept liability for any loss or damage, including without limitation any loss of profit, which may arise directly or indirectly from the use of or reliance on such information.
All investments involve risk, and the past performance of a security, industry, sector, market, financial product, trading strategy, backtest, or individual's trading does not guarantee future results or returns. Investors are fully responsible for any investment decisions they make. Such decisions should be based solely on an evaluation of their financial circumstances, investment objectives, risk tolerance, and liquidity needs.
My Scripts/Indicators/Ideas/Algos/Systems are only for educational purposes!
Paid script
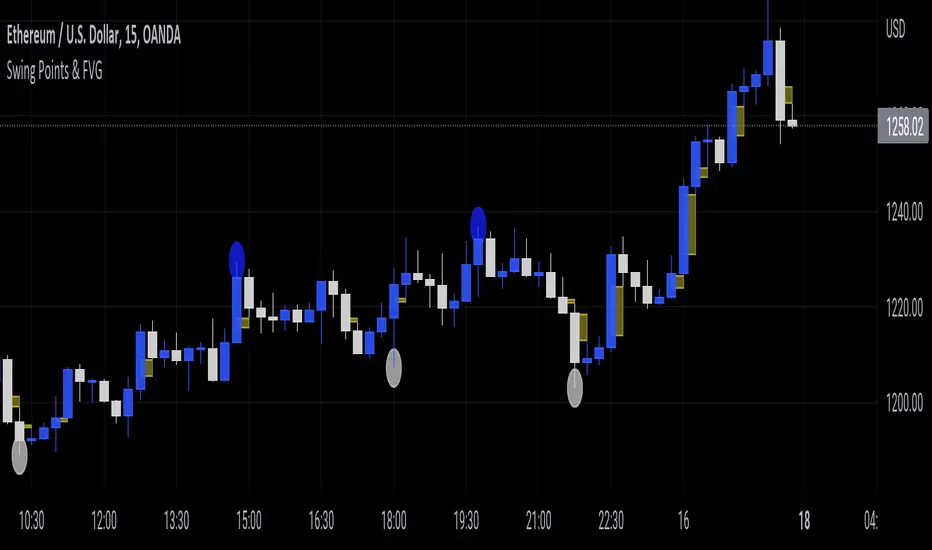
Swing Points & FVGClassic ITH/ITL
Intermediate Term High - High that has short term high on either of it's side.
Intermediate Term Low - Low that has short term low on either of it's side.
FVG
The indicator also marks Fair Value Gaps which is a very important concept in price action trading. FVGs are formed when there is ineffeciency,or imbalance, in the market.
Rebalanced ITH/ITL
Rebalanced ITH - A short term high that rebalanced the ineffeciency in price can be considered as an Intermediate Term High.
Rebalanced ITL - A short term low that rebalanced the ineffeciency in price can be considered as an Intermediate Term Low.
Use the ITH and ITL points marked by the indicator to determine the structure of the market.
Indicator repaints only when it tries to identify the latest ITH/ITL.
Ichimoku ImbalanceYou may have heard the word balance or imbalance
This indicator is designed based on Ichimoku periods to display imbalances in each period
When you see a black mark, it means that one of the Ichimoku periods is saturated or unbalanced
If the current candle was equal to the lowest price on 9/26/52 of the last period and the highest price was equal to the last candle from left on 9/26/52 of the last period
If the current candle was equal to the highest price on 9/26/52 of the last period and the lowest price was equal to the last candle from right on 9/26/52 of the last period
This indicator is a useful and powerful tool for Ichimoku traders to understand overbought and oversold points in different time periods.
Note: This is an auxiliary tool and does not issue buy and sell signals
