Leola Lens SignalPro📌 Leola Lens SignalPro — Structure-Aware Momentum Overlay (Invite-Only)
This script is designed for traders who prioritize clear structure, liquidity trap zones, and momentum transitions. It provides adaptive visual overlays that align with key decision points — emphasizing structure over lagging indicators.
________________________________________
⚙️ Core Operating Modes
✅ Momentum Shift Mode (Always Active)
Tracks microstructure shifts using volatility compression, imbalance reactions, and adaptive logic for directional bias.
⚡ Scalper Mode (Optional)
Activates fast-response overlays for 1m–15m charts — tuned for crypto, indices, and intraday setups.
🛡 Safeguard Mode (Optional)
Applies volume and exhaustion filters for higher timeframe or conservative entries, ideal for swing traders.
________________________________________
📦 Liquidity Control Box (LCB) Logic
🔵 Blue Box = Bullish Control
• Break above → continuation likely
• Break below → caution for reversal
🟧 Orange Box = Bearish Control
• Break below → continuation likely
• Break above → caution for squeeze
Use the last visible box for bias.
Box edges = confluence zones.
Box overlaps = consolidation → avoid impulsive trades.
________________________________________
🧠 Signal Logic & Concept
Built using a custom structural engine, not derived from public scripts like RSI, MACD, or WaveTrend.
The overlays aim to capture price behavior often aligned with institutional concepts, such as:
• Order Blocks
• Liquidity Sweeps
• Trap Reversals
• Mitigation Moves
Pairs well with SMC-style analysis and order-flow-based trading.
________________________________________
🟡 Visual Signal Layers
• BUY / SELL Labels → Appear near structure flips and trap zones
• Yellow Label → High-risk trend shift zone
• LCB Boxes → Real-time market control zones
• Green/Red Liquidity Zones → Absorption or rejection
• MA Overlays → Adaptive slope-based guidance (optional)
• Pink Lines → High-reactivity reversal zones
• Yellow Line → Soft S/R (psychological pivot)
________________________________________
🎯 Suggested Entry & Exit Cues (Educational Use Only)
✅ Entry
• BUY near Blue LCB + liquidity reaction
• SELL after extended rallies into Orange LCB + trap behavior
• ⚠ Avoid trades directly at Yellow Labels unless other context supports
✅ Exit
• On opposite label after structure break
• On formation of opposite LCB
• Near major liquidity zones or pink levels
🧪 Always backtest label behavior to fit your strategy before use.
________________________________________
🔍 Originality Justification
This script introduces a non-indicator-based approach to structure detection — combining real-time volatility response, adaptive liquidity logic, and multi-mode filtering. It avoids conventional oscillators in favor of clarity-driven visual overlays, offering a novel experience especially useful to discretionary traders.
________________________________________
⚠️ Disclaimer
This script is for educational and informational purposes only. It does not constitute financial advice or a trading signal. Always validate performance with backtesting and forward testing before live use.
________________________________________
Invite-only

Leola Lens Footprint📌 Leola Lens Footprint — Market Memory Overlay (Invite-Only)
This invite-only script is built to visualize market memory by identifying historically reactive zones — where price previously encountered resistance, support, or decision-making friction.
Unlike predictive models or indicator-driven systems, Footprint focuses only on price behavior that has already occurred, using confirmed reaction clusters to highlight likely areas of future influence.
________________________________________
🔍 What It Does
• Detects zones where price has reacted multiple times, showing clear rejection, breakout, or consolidation behavior
• Plots these levels only after market confirmation — no projections or lagging indicators
• Designed for clean structural reading across all timeframes and asset classes (crypto, stocks, forex, commodities)
________________________________________
🟡 Visual Elements
• 🟣 Purple Zones → High-impact memory zones with consistent historical rejection
• 🟤 Brown Zones → Fresh rejection clusters (recent demand/supply zones)
• 🟡 Yellow Line → Psychological pivot zone/Key decision points formed from repeated reactions.
• 🩷 Pink Lines → Pullback or reversal zones (support/resistance traps)
• Adaptive zone shading and slope-based logic enhances readability
________________________________________
📊 Best Suited For:
• Price-action traders who focus on confirmed historical behavior, not speculative levels
• Scalpers and swing traders looking to trade retests and rejection entries
• Discretionary traders wanting a stable visual map of structure without noise
________________________________________
🔧 Originality & Logic
This script uses original rule-based logic to cluster and validate levels only after real-world confirmation.
It does not use RSI, MACD, MAs, volume, or any traditional indicator input.
Instead, it tracks zone memory based on how price respects or invalidates key levels over time — making it adaptive to both trending and ranging environments.
There is no repainting or forward projection — all levels appear only after market structure confirms relevance.
________________________________________
⚠️ Disclaimer
This tool is for educational and informational purposes only. It does not constitute trading advice or a financial recommendation. Always validate visual overlays with your own risk framework and backtesting before live use.
________________________________________

Leola Lens Standard📌 Leola Lens Standard — Structural Reaction Map (Invite-Only)
Leola Lens Standard is a closed-source overlay designed to map structural levels, reaction zones, and liquidity shifts — across all major market types and timeframes.
This version focuses on clean, adaptive visuals that help traders identify reaction-prone areas without relying on conventional indicators.
________________________________________
🔍 What It Displays
• Dynamic zones that shift based on evolving price behavior
• Support and resistance clusters around consolidation or expansion phases
• Upper and lower range boundaries to track accumulation/distribution conditions
• Transition zones where false breakouts or traps are likely to occur
________________________________________
🧠 Technical Approach & Originality
This tool uses custom-coded structural logic, not derived from Pine Script libraries or public indicator templates.
• No use of RSI, MACD, MAs, Bollinger Bands, or volume-based profiles
• Reactions are mapped based on confirmed price behavior, not forecasts
• All zones are generated visually — no manual inputs required
• Compatible with trend, range, or chop market conditions
Its focus on structure-based clarity helps traders cut through noise, particularly in high-volatility environments.
________________________________________
🧩 Best Use Cases
• Intraday traders seeking traps and fakeouts at key levels
• Swing traders mapping range-to-trend transitions or retests
• Market-neutral setups where visual structure is more actionable than signal indicators
• Works across crypto, equities, forex, and commodities
________________________________________
⚠️ Disclaimer
This script is provided for educational and analytical purposes only. It is not financial advice and should not be used to make trading decisions without proper risk assessment.
________________________________________

Icy-Hot Visual Indicator [SciQua]🧊 Icy-Hot Visual Indicator
This indicator colors your price bars and/or chart background based on a normalized & smoothed transform of any price-based input (default: close). It gives you a quick “temperature map” of market momentum or volatility—cool blues for low readings, hot reds for high readings—without cluttering your chart.
🔍 Key Features
1. Dual Visual Layers
Candle Gradient: Applies a smooth, multi-color gradient to candle bodies and wicks based on normalized, smoothed input data
Background Gradient: Adds a semi-transparent gradient behind the candles to highlight broader trend zones or volatility regimes
2. Advanced Customization
Normalization Types: bounded, unbounded, z-score, MAD, percentile, sigmoid, tanh, rank, robust, and more
Smoothing Methods: EMA, SMA, WMA, RMA, HMA, TEMA, VWMA, Gaussian, LinReg, ExpReg, and others (12+ options)
3. Gradient Control: Choose 2–7 color stops, reverse direction, adjust display length
Flexible Source Inputs
Use any built-in price series (close, hl2, volume, etc.)
Feed outputs from external indicators (RSI, custom oscillators, moving averages) into either layer
❓How It Works
Inputs are normalized (z-score, bounded, etc.) then smoothed (EMA, LinReg, etc.) in the order you choose. The result is clamped to 0–1 and passed through a multi-stop gradient engine for precise color mapping.
✨ What Makes It Original
While many indicators apply colors or smoothing, this script combines multi-stage normalization, adaptive smoothing, and a modular gradient rendering engine in a highly customizable dual-layer system. It’s built using proprietary functions from the SciQua suite that are not available in public libraries and allow for advanced visual encoding without relying on alerts, signals, or extra panes.
This makes it original in both design and execution—offering a visual-first approach with unique depth, clarity, and flexibility.
🔐 Why This Script Is Closed-Source
While the underlying functions are published in the open-source SciQua library, this indicator’s specific implementation, configuration architecture, and visual behavior are proprietary. It combines multiple library utilities into a dual-layer adaptive system that handles advanced gradient rendering, multi-stage normalization, and smoothing pipelines in a unique way.
The source is closed to protect the design logic, interface abstraction, and fine-tuned behaviors that make this indicator commercially valuable. The building blocks are open to the Pine community, but this assembled product is not meant for replication or redistribution.
How to Use It
1. Highlight Trend Strength
Source: RSI percentile
Setup: 200-bar look-back, mild smoothing
Result: Warm tones when momentum is peaking; cool when it’s fading. Use as a quick filter for entries in the direction of the trend.
2. Visualize Volatility Regimes
Source: ATR or True Range
Setup: Bounded normalization with tighter smoothing bar color off, bg color on.
Result: Background bands that shade when volatility spikes. Helps you avoid low-volatility breakouts or throttle position sizing in choppy markets.
3. Combine with Other Indicators
Source: Output of your custom indicator (e.g., a Keltner Band width)
Setup: Match normalization period to your strategy’s timeframe
Result: Bars colored by your own logic—no extra panes, just enhanced candles.
4. Background Only Heatmap
Turn off bar coloring and dial in semi-transparent background shades—keeps candles crisp while still giving you a context heat-map behind price.
TradeWithAB Signal IndicatorThis indicator specifically designed for Momentum trading by an Intraday trader on index( Nifty , BankNifty ) and Equity stocks. This indicator works with DMI and PRICE ACTIONS which gives automated Buy and Sell signals along with Stop loss and Trailing Stop loss when certain criteria are met. It is not a Holy Grail system that gives you continuous profits and it has some limited downfalls also which can be controlled by proper risk Management and position sizing. This is a premium invite only indicator which can be use after given access to you by us. There are some guidelines on how to use this indicator which are given below and you have to follow these guidelines very strictly to get the maximum results.
Guidelines :-
1. Timeframe - 5 min
2. Period should be changed on daily basis(if required) for index trading.
3. Period value would be basically derived from IND VIX value (closest integer) divided by 2.
Ex 1. If the VIX value is 23.56, then it will be consider as 24. So the period value will be 24/2= 12.
Ex 2. If the VIX value is 23.10, then it will be considered as 24. So the period value will be 24/2= 12.
Ex 3. If the VIX value is 22.88, then it will be considered as 22. So the period value will be 22/2= 11.
4. Period value should be fixed at 20 for equity stocks.
5. DO NOT take any SWING or POSITIONAL trade with this indicator.
6. You have to take almost all the trade generated by this indicator on a particular stock/index for better results.
7. Signal confirmation is required for enter the trade as it will give you maximum profits.
8. GREEN TRIANGLE is represented as BUY Signal whereas RED TRIANGLE is represented as SELL Signal.
9. GREEN ARROW is considered as BUY TRAILING STOP LOSS as well as BUY RE-ENTRY for some scenarios.
10. RED ARROW is considered as SELL TRAILING STOP LOSS and SELL RE-ENTRY for some scenarios.
11. You have to avoid entering a trade on a round level zone. Eg- Banknifty 37000,35500,40000 etc etc.
BUY Trade Management :-
1. Trade should be initiated if and only if there is a buy signal(Green Triangle) is generated with confirmation of its respective indices (Recent candle of respective index should be similar to the signal candle).
*in case of BankNifty , Nifty will be its respective index and vice-versa.
2. You should only enter the trade at the CLOSE of the signal generated candle.
3. Your Stop loss should be placed at the LOW of the signal generated candle.
4. There is a trailing Stop loss signal (Green Arrow) after the buying signal is generated.
5. You should trail your Stop loss at the LOW of the trailing Stop loss signal generated candle.
6. You should trail your Stop loss repeatedly until your trailing Stop loss got hit and hence Exit your buy trade.
7. After Exiting the trade you have always option to re-enter at the next trailing Stop loss signal(green arrow) generated candle CLOSE and put your Stop loss at LOW of that candle and repeat the same trailing stop loss procedures.
SELL Trade Management :-
1. Trade should be initiated if and only if there is a sell signal(Red Triangle) is generated with confirmation of its respective indices (Recent candle of respective index should be similar to the signal candle).
*in case of BankNifty , Nifty will be its respective index and vice-versa.
2. You should only enter the trade at the CLOSE of the signal generated candle.
3. Your Stop loss should be placed at the HIGH of the signal generated candle.
4. There is a trailing Stop loss signal (Red Arrow) after the selling signal is generated.
5. You should trail your Stop loss at the HIGH of the trailing Stop loss signal generated candle.
6. You should trail your Stop loss repeatedly until your trailing Stop loss got hit and hence Exit your sell trade.
7. After Exiting the trade you have always option to re-enter at the next trailing Stop loss signal(red arrow) generated candle CLOSE and put your Stop loss at HIGH of that candle and repeat the same trailing stop loss procedures.
Disclaimer :-
*I am not a SEBI Registered Analyst and shall not be liable for any profit, loss or liability resulting, directly or indirectly from the use and results of the indicator. This is not a Holy Grail setup, sometimes the traders hit Stop loss and sometimes it gives amazing results as well.
Instructions to access to this invite-only script:-
*Send us a message if you wish to gain access to this indicator. The subscribers will get benefits of any future development or updates in the current script without any extra charges. Other trading style like swing and positional trading will also available in future updates.

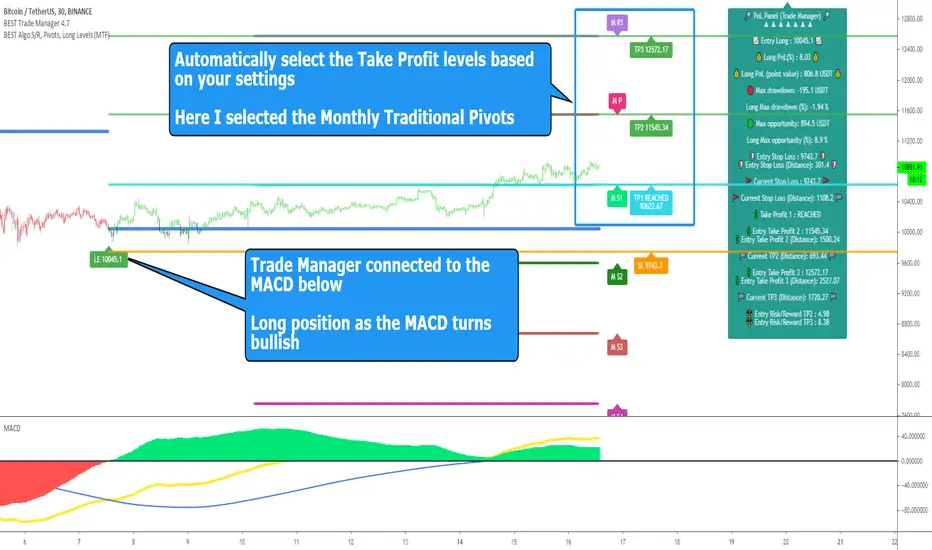
BEST Standalone Trade Manager with Automatic Take ProfitHello BEST traders
The BEST Trade Manager got upgraded with many more features
This version allows setting automatically the TP levels on either Daily/Weekly/Monthly Fibonacci/Traditional/Camarilla/Woodie pivots and Daily/Weekly/Monthly/Intraday Moving Averages
I. 💎 SCRIPTS ACCESS 💎
1. Available only with one-time payment on my website.
2. My website URL is in this script signature at the very bottom (you'll have to scroll down a bit and going past the long description) and in my profile status available here: Daveatt
3. Many video tutorials explaining clearly how all our indicators work are available on your website > guides section.
4. You may also contact me directly for more information
II. 🔎 What is the BEST Trade Manager?🔎
2.1 Concept
The BEST Trade Manager is compatible with any indicator.
Once connected, it adds another layer of good stuff with real-time user custom defined stop loss (8 available options), take profits (4 possible options) + alerts compatible for trading automation.
2.2 How hard is it to update your indicator?
We'll send to our customers, a comprehensive and easy tutorial, to make any indicator compatible.
I guarantee you, it should take no more than 2 minutes per indicator. We made it easy, fun, and awesome. #bolder #statement
III. The amazing benefits of our Plug&Play system
I hope you're ready to be impressed. Because, what I'm about to introduce, is my best-seller feature - and available across many of my indicators.
The BEST Trade manager can be connected to any external indicator
Let's assume you want to connect your RSI divergence to your Trade Manager.
I mentioned an RSI divergence but you may connect any oscillator ( MACD, On balance volume, stochastic RSI, True Strenght index, and many more..) or non-oscillatory (divergence, trendline break, higher highs/lower lows, candlesticks pattern, price action, harmonic patterns, ...) indicators.
THE SKY IS (or more likely your imagination) is the limit :)
Of course, this tool is compatible with my other indicators
We go in-depth on our website why the Plug&Play is an untapped opportunity for many traders out there - URL available on my profile status and signature
IV. 🧰 Features 🧰
Candles can be colored to highlight the trend direction better [/b [
4.1 Stop-Loss Management
For what's following, let's assume that 2 is the stop-loss value you inserted in the indicator, and the Algorithm Builder gives a BUY signal.
This is NOT a recommendation at all, only an example to explain how this feature works.
- %Trailing: The Stop-Loss starts 2% away from the entry price - and will move up (because we're on a BUY trade as per our example) every time your trade will gain 2% profit
- Pips Trailing: Same as above but using a distance in pips/USD value
- Percentage: The Stop-Loss stays static 2% away from the entry price. There is no trailing here
- TP Trailing: Trail your stop-loss every time a Take Profit level is hit
- Supertrend: embedded supertrend use as a trailing stop
- Fixed: Set the Stop-Loss at a fixed position (value should be in currency/units)
- ATR multiple: Set the Stop-loss at a multiple of ATR
- External connector: Let's say your indicator already contains embedded stop-loss levels, you can add them in the Trade Manager
4.2 Take Profits Management
You can manage up to 3 take profit levels defined as a percentage or price value or ATR multiple.
The expected input is in percentage value (for instance, setting the % target of TP1 to 2% will set the TP1 level 2% away from the entry price
This version allows setting automatically the TP levels on either Daily/Weekly/Monthly Fibonacci/Traditional/Camarilla/Woodie pivots and Daily/Weekly/Monthly/Intraday Moving Averages
4.3 Built-in Risk-to-Reward Panel with real-time analytics
The good stuff doesn't stop here.
You'll notice that this sometimes green (when in a LONG), sometimes red (when in a SHORT) panel at the right of your chart.
- Entry Price: the price when the Algorithm Builder will give a signal.
- The Trade PnL in percentage.
- Entry Stop Loss: Distance (in currency/units) between the selected stop-loss algorithm (percent, trailing, TP trailing, etc.) and the entry price.
- Entry TP1/TP2/TP3: Distance (in currency/units) between the entry price and the first take profit
- Risk/Reward TP1/TP2/TP3: Using the Stop-loss distance at entry, and Take Profit 1/2/3 at the entry to compute the risk-to-reward ratio.
- Max drawdown and Max opportunity (value and percentage): respectively the maximum loss and maximum win per trade
For more details, please check the guides section of my website. Links are in my signature and profile status.
V. 🔔 Alerts 🔔
We enabled the alerts on the:
1. Stop-Loss hit
2. Take Profit 1/2/3 hit
3. custom hard exits based on either MACD / RSI divergence/ MM cross
5.1 🤖 Compatible with trading bots? 🤖
It's compatible with all third-parties out there capturing alerts and forwarding them to the brokers.
We enabled TradingConnector and ProfitView alert templates so far.
If you have any doubts or questions, please hit me up directly or ask in the comments section of this script.
BEST regards,
Dave