Session Opening Range Breakout (ORBO)This strategy automates a classic Opening Range Breakout (ORBO) approach: it builds a price range for the first minutes after the market opens, then looks for strong breakouts above or below that range to catch early directional moves.
Concept
The idea behind ORBO is simple:
The first minutes after the session open are often highly informative.
Price forms an “opening range” that acts as a mini support/resistance zone.
A clean breakout beyond this zone can lead to high-momentum moves.
This script turns that logic into a fully backtestable strategy in TradingView.
How the strategy works
Opening Range Session
Default session: 09:30–09:50 (exchange time)
During this window, the script tracks:
orHigh → highest high within the session
orLow → lowest low within the session
This forms your Opening Range for the day.
Breakout Logic (after the window ends)
Once the defined session ends:
Long Entry:
If the close crosses above the Opening Range High (orHigh),
→ strategy.entry("OR Long", strategy.long) is triggered.
Short Entry:
If the close crosses below the Opening Range Low (orLow),
→ strategy.entry("OR Short", strategy.short) is triggered.
Only one opening range per day is considered, which keeps the logic clean and easy to interpret.
Daily Reset
At the start of a new trading day, the script resets:
orHigh := na
orLow := na
A fresh Opening Range is then built using the next session’s 09:30–09:50 candles.
This ensures entries are always based on today’s structure, not yesterday’s.
Visuals & Inputs
Inputs:
Opening range session → default: "0930-0950"
Show OR levels → toggle visibility of OR High / Low lines
Fill range body → optional shaded zone between OR High and OR Low
Chart visuals:
A green line marks the Opening Range High.
A red line marks the Opening Range Low.
Optional yellow fill highlights the entire OR zone.
Background shading during the session shows when the range is currently being built.
These visuals make it easy to see:
Where the OR sits relative to current price
How clean / noisy the breakout was
How often price respects or rejects the opening zone
Backtesting & Optimization
Because this is written as a strategy():
You can use TradingView’s Strategy Tester to view:
Win rate
Net profit
Drawdown
Profit factor
Equity curve
Ideas to experiment with:
Change the session window (e.g., 09:15–09:45, 10:00–10:30)
Apply to different:
Markets: indices, FX, crypto, stocks
Timeframes: 1m / 5m / 15m
Add your own:
Stop Loss & Take Profit levels
Time filters (only trade certain days / times)
Volatility filters (e.g., ATR, range size thresholds)
Higher-timeframe trend filter (e.g., only take longs above 200 EMA)
Long-and-short

Safe Supertrend Strategy (No Repaint)Overview
The Safe Supertrend is a repaint-free version of the popular Supertrend trend-following indicator.
Most Supertrend indicators appear perfect on historical charts because they flip intrabar and then repaint after the candle closes.
This version fixes that by using close-of-bar confirmation only, making every trend flip 100% stable, safe, and non-repainting.
Why This Supertrend Doesn’t Repaint
Most Supertrend indicators calculate their trend direction using the current bar’s data.
But during a live candle:
ATR expands and contracts
The upper/lower bands move
Price moves above/below the band temporarily
A false flip appears → then disappears when the candle closes
That is classic repainting.
This indicator avoids all of that by using:
close > upper
close < lower
This means:
Trend direction flips only based on the previous candle,
No intrabar calculations,
No flickering signals,
No “perfect but fake” historical performance.
Every signal you see on the chart is exactly what was available in real-time.
How It Works
Calculates ATR (Average True Range) and SMA centerline
Builds upper and lower volatility bands
Confirms trend flips only after the previous bar closes
Plots clear bull and bear reversal signals
Works on all markets (crypto, stocks, forex, indices)
No repainting, no recalc, no misleading flips.
Bullish Signal (Trend Up)
A bullish trend begins only when:
The previous candle closes above the upper ATR band,
And this flip is fully confirmed.
A green triangle marks the start of a new uptrend.
Bearish Signal (Trend Down)
A bearish trend begins only when:
The previous candle closes below the lower ATR band,
And the downtrend is confirmed.
A red triangle signals the start of a new downtrend.
Inputs
ATR Length - default 10
ATR Multiplier - default 3.0
Works on all timeframes and market
Simple, but powerful.
Why Use This Version Instead of a Regular Supertrend?
Most Supertrends:
Look great historically
But repaint continuously on live charts
Give false trend flips intrabar
Cannot be reliably used in strategies
This version:
Uses strict previous-bar logic
Never repaints trend direction
Works perfectly in live trading
Backtests accurately
Is ideal for algorithmic strategies
Ideal For:
Trend-following strategies
Breakout trading
Algo trading systems
Reversal detection
Filtering market noise
Swing trading & scalping
Final Note
This is a safer, more reliable Supertrend designed for real-world use — not perfect-looking repaint illusions.
If you use Supertrend in your trading system, this no-repaint version ensures your signals are trustworthy and consistent.

Theft Indicator - BUY/SELL AlertsWhat is our indicator?
Theft Indicator - Buy & Sell Alert System is our first published script that shows price action on a certain period of time (We Use ATR indicator). We take pride in enabling trading to become easier for the experienced and the non-experienced traders around the globe. Buy & Sell alerts will be fired once a conditions in our algo is met.
Does it Repaint?
Our indicator does NOT re-paint. Although while setting an alert it may pop up the repaint alert, please take into consideration that once a signal is fired on a "CLOSED BAR", our signal will never disappear, they do not repaint.
What Markets is it usable with?
You can use it in any market, Forex, Stocks, Crypto, Indices. We recommend high time frames but you can also use it on the 1 minute chart if you are a scalper and a risk taker. All time frames are profitable, not all trades. But the Majority is profitable. We will soon add a backtest strategy for it, there is no ETA on it tho.
How to use:
Simple plug and play it to your chart, in addition to a few other indicators we will recommend to you (we still have not published them yet), and this will confirm your trades. You can also connect TV alerts with a bot and let it run. Please be aware that SLIPPAGE time is important, If you run a bot on this indicator you HAVE to know that the buy/sell price will be on the bar AFTER the Candle close (For example: the BUY/SELL alert is on a candle, the buy/sell your bot or you will execute WILL be in the following candle depending on your trading system. Theft Indicator - Buy/Sell Alerts work best with higher time frames, however it works on smaller time frames, we recommend 15 mins, 30 mins, 1hr, 4hr. It just depends on your trading style. Please contact us if you do not understand how to use it.
How are the Buy/Sell Alerts fired?
We use the simple ATR (Average True Range) indicator. However we have modified the indicator to fit our trading system. Check below for a definition of what ATR is:
What is Average True Range - ATR?
The average true range (ATR) is a technical analysis indicator that measures market volatility by decomposing the entire range of an asset price for that period. Specifically, ATR is a measure of volatility introduced by market technician J. Welles Wilder Jr. The true range indicator is taken as the greatest of the following: current high less the current low; the absolute value of the current high less the previous close; and the absolute value of the current low less the previous close. The average true range is then a moving average, generally using 14 days, of the true ranges.
Why is our indicator special and different from the normal ATR indicators?
We have modified the mathematical equation and changed it slightly to give more accurate signals, we do not promise all trades are profitable, the use of this indicator is up to your own judgement and liability. We believe that we have an indicator like no other ATR because of our algo that is different from the normal ATR calculation.
P.S: This is not financial advice, we are just sharing our indicator that we know has good results, and it will take time for people in -ve profiles to recover losses and for the profiting to be more profitable.
You can contact me for more information about the indicator, Goodluck :)

Bitfinex Sentiment Index [Long-Short]BSI provides two attractive graphs that breakdown the long (green area) and short (red area) positions ratio for the all Bitfinex margin cryptocurrency pairs only .
It is a quantitative measure of the bullishness or bearishness that can be used as a trading rule or in a trading system entries or exits. Included slow stochastic oscillator.

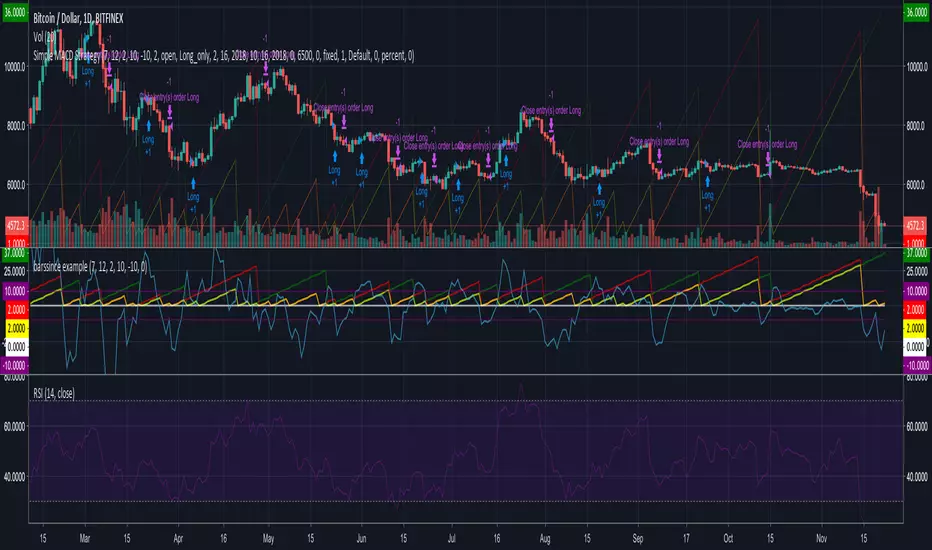
Simple MACD StrategyThis simple MACD strategy takes in account a given a time frame and the basic MACD parameters ( short, long, signal values).
The current implementation does not takes persistance or thresholds in accounts.