OBV Cloud v1.0 [PriceBlance]🌐 English
OBV Cloud v1.0 – Free & Open-Source
OBV Cloud v1.0 integrates On-Balance Volume (OBV) with a Cloud model and enhanced trend filters.
It helps traders quickly identify:
Money Flow Trend: OBV Cloud acts as a dynamic support/resistance zone.
Trend Filters: EMA9 (short-term) and WMA45 (medium-term) directly applied on OBV.
OBV–Price Divergence: Detects both regular and hidden bullish/bearish divergences.
Trend Strength: Measured with ADX calculated on OBV.
OBV Cloud is suitable for both swing and day trading, allowing traders to spot breakouts, reversals, or sustained trends through volume-based analysis.
M-oscillator

Swing H1 + M15 ComboThis indicator only use to H1 & M15 timeframe
✅ Entry Guidelines
Identify the Trend (H1 Swing Call)
A confirmed Swing Buy on H1 sets the trend to bullish.
A confirmed Swing Sell on H1 sets the trend to bearish.
The trend only changes when a new confirmed swing signal closes on H1.
Confirm with M15
On M15, wait for a buy signal if the H1 trend is bullish.
On M15, wait for a sell signal if the H1 trend is bearish.
✅ How It Works
H1 Swing Calls define the overall trend direction (bullish or bearish).
M15 CE Signals confirm short-term entries in line with the H1 trend.
A trade setup is only valid when both timeframes agree.
📈 Entry Strategy
Buy Setup:
H1 confirms a Swing Buy trend
M15 prints a CE Buy signal
Stop loss: below nearest swing low / structure
Sell Setup:
H1 confirms a Swing Sell trend
M15 prints a CE Sell signal
Stop loss: above nearest swing high / structure
Custom MACD (Normalized by ATR)This is a modified version of the classic MACD indicator.
Instead of using just the difference between EMA(12) and EMA(26), this version normalizes the MACD line by ATR(26) and scales it by 100:
* 100
This adjustment makes the MACD relative to market volatility, allowing for easier comparison across assets and timeframes.
The idea of normalizing MACD with ATR comes from Alex Spioglou, who suggested this improvement to enhance signal consistency in volatile markets.
Plots include the ATR-normalized MACD line, the signal line, and the histogram, with rising/falling color cues and built-in alert conditions.

CMC Macro Regime PanelOverview (what it is):
A macro‑regime gate built entirely from TradingView-native symbols (CRYPTOCAP, FRED, DXY/VIX, HYG/LQD). It aggregates central‑bank liquidity (Fed balance sheet − RRP − Treasury General Account), USD strength, credit conditions, stablecoin flows/dominance, tech beta and BTC–NDX co‑move into one normalized score (CLRC). The panel outputs Risk‑ON/OFF regimes, an Early 3/5 pre‑signal, and an automatic BTC vs ETH vs ALTs preference. It is intentionally scoped to Daily & Weekly reads (no intraday timing). Publish with a clean chart and a clear description as per TradingView rules.
TradingView
Why we also use other TradingView screens (and why that is compliant)
This script pulls data via request.security() from official TV symbols only; users often want to open the raw series on separate charts to sanity‑check:
CRYPTOCAP indices: TOTAL, TOTAL2, TOTAL3 (market cap aggregates) and dominance tickers like BTC.D, USDT.D. Helpful for regime & rotation (ALTs vs BTC). TradingView provides definitions for crypto market cap and dominance symbols.
TradingView
+3
TradingView
+3
TradingView
+3
FRED releases: WALCL (Fed assets, weekly), RRPONTSYD (ON RRP, daily), WTREGEN (TGA, weekly), M2SL (M2, monthly). These are the official macro sources exposed on TV.
FRED
+3
FRED
+3
FRED
+3
Risk proxies: TVC:DXY (USD index), TVC:VIX (implied vol), AMEX:HYG/AMEX:LQD (credit), NASDAQ:NDX (tech beta), BINANCE:ETHBTC. VIX/NDX relationship is well-documented; VIX measures 30‑day expected S&P500 vol.
TradingView
+2
TradingView
+2
Compliance note: Using multiple screens is optional for users, but it explains/justifies how components work together (a requirement for public scripts). Keep publication chart clean; use extra screens only to illustrate in the description.
TradingView
How it works (high level)
Liquidity block (Weekly/Monthly)
Net Liquidity = WALCL − RRPONTSYD − WTREGEN (YoY z‑score). WALCL is weekly (as of Wednesday) via H.4.1; RRP is daily; TGA is a Fed liability series. M2 YoY is monthly.
FRED
+3
FRED
+3
FRED
+3
Risk conditions (Daily)
DXY 3‑month momentum (inverted), VIX level (inverted), Credit (HYG/LQD ratio or HY OAS). VIX is a 30‑day constant‑maturity implied vol index per Cboe methodology.
Cboe
+1
Crypto‑internal (Daily)
Stablecoins (USDT+USDC+DAI 30‑day log change), USDT dominance (20‑day, inverted), TOTAL3 (63‑day momentum). Dominance symbols on TV follow a documented formula.
TradingView
Beta & co‑move (Daily)
NDX 63‑day momentum, BTC↔NDX 90‑day correlation.
All components become z‑scores (optionally clipped), weighted, missing inputs drop and weights renormalize. We never use lookahead; we confirm on bar close to avoid repainting per Pine docs (barstate.isconfirmed, multi‑TF).
TradingView
+2
TradingView
+2
What you see on the chart
White line (CLRC) = macro regime score.
Background: Green = Risk‑ON, Red = Risk‑OFF, Teal = Early 3/5 (pre‑signal).
Table: shows each component’s z‑score and the Preference: BTC / ETH / ALTs / Mixed.
Signals & interpretation
Designed for Daily (1D) and Weekly (1W) only.
Regime gates (default Fast preset):
Enter ON: CLRC ≥ +0.8; Hold ON while ≥ +0.5.
Enter OFF: CLRC ≤ −1.0; Hold OFF while ≤ −0.5.
0 / ±1 reading: CLRC is a standardized composite.
~0 = neutral baseline (no macro edge).
≥ +1 = strong macro tailwind (≈ +1σ).
≤ −1 = strong headwind (≈ −1σ).
Early 3/5 (teal): a fast pre‑signal when at least 3 of 5 daily checks align: USDT.D↓, DXY↓, VIX↓, HYG/LQD↑, ETHBTC↑ or TOTAL3↑. It often precedes a full ON flip—use for pre‑positioning rather than full sizing.
BTC/ETH/ALTs selector (only when ON):
ALTs when BTC.D↓ and (ETHBTC↑ or TOTAL3↑) ⇒ rotate down the risk curve.
BTC when BTC.D↑ and ETHBTC↓ ⇒ keep it concentrated.
ETH when ETHBTC↑ while BTC.D flat/up ⇒ add ETH beta.
(Dominance mechanics are documented by TV.)
TradingView
Dissonance (incompatibility) rules — when to stand down
Use these overrides to avoid false comfort:
CLRC > +1 but USDT.D↑ and/or VIX spikes day‑over‑day → downgrade to Neutral; wait for USDT.D to stabilize and VIX to cool (VIX is a fear gauge of 30‑day expectation).
Cboe Global Markets
CLRC > +1 but DXY↑ sharply (USD squeeze) → size below normal; require DXY momentum to roll over.
CLRC < −1 but Early 3/5 = true two days in a row → start reducing underweights; look for ON flip within a few bars.
NetLiq improving (W) but credit (HYG/LQD) deteriorating (D) → treat as mixed regime; prefer BTC over ALTs.
How to use (step‑by‑step)
A. Read on Daily (1D) — main regime
Open CRYPTOCAP:TOTAL3, 1D (panel applied).
Wait for bar close (use alerts on confirmed bar). Pine docs recommend barstate.isconfirmed to avoid repainting on realtime bars.
TradingView
If ON, check Preference (BTC / ETH / ALTs).
Then drop to 4H on your trading pair for micro entries (this indicator itself is not for intraday timing).
B. Confirm weekly macro (1W) — once per week)
Review WALCL/RRP/TGA after the H.4.1 release on Thursdays ~4:30 pm ET. WALCL is “Weekly, as of Wednesday”; M2 is Monthly—so do not expect daily responsiveness from these.
Federal Reserve
+2
FRED
+2
Recommended check times (practical schedule)
Daily regime read: right after your chart’s daily close (confirmed bar). For consistent timing across crypto, many users set chart timezone to UTC and read ~00:05 UTC; you can change chart timezone in TV’s settings.
TradingView
In‑day monitoring: optional spot checks 16:00 & 20:00 UTC (DXY/VIX move during US hours), but act only after the daily bar confirms.
Weekly macro pass: Thu 21:30–22:30 UTC (after H.4.1 4:30 pm ET) or Fri after daily close, to let weekly FRED series propagate.
Federal Reserve
Limitations & data latency (be explicit)
Higher‑TF data & confirmation: FRED weekly/monthly series will not reflect intraday risk in crypto; we aggregate them for regime, not for entry timing.
Repainting 101: Realtime bars move until close. This script does not use lookahead and follows Pine guidance on multi‑TF series; still, always act on confirmed bars.
TradingView
+1
Public‑library compliance: Title EN‑only; description starts in EN; clean chart; justify component mash‑up; no lookahead; no unrealistic claims.
TradingView
Alerts you can use
“Macro Risk‑ON (entry)” — fires on ON flip (confirmed bar).
“Macro Risk‑OFF (entry)” — fires on OFF flip.
“Early 3/5” — fires when the teal pre‑signal appears (not a regime flip).
“Preference change” — BTC/ETH/ALTs toggles while ON.
Publish note: Alerts are fine; just avoid implying guaranteed accuracy/performance.
TradingView
Background research (why these inputs matter)
Liquidity → Crypto: Fed H.4.1 timing and series definitions (WALCL, RRP, TGA) formalize the “net liquidity” concept used here.
FRED
+3
Federal Reserve
+3
FRED
+3
Stablecoins ↔ Non‑stable crypto: empirical work shows bi‑directional causality between stablecoin market cap and non‑stable crypto cap; stablecoin growth co‑moves with broader crypto activity.
Global liquidity link: world liquidity positively relates to total crypto market cap; lagged effects are observed at monthly horizons.
VIX/Uncertainty effect: fear shocks impair BTC’s “safe haven” behavior; VIX is a meaningful risk‑off read.

Adaptive Fear & Greed Index with ML-Enhanced SD - HOSSAM Adaptive Fear and Greed Index with ML-Enhanced Standard Deviation
📊 Overview
A sophisticated market sentiment indicator that combines traditional Fear and Greed Index methodology with machine learning-inspired adaptive algorithms. This tool dynamically adjusts to changing market conditions, providing more accurate sentiment readings and early warning signals.
🔥 Key Features
Adaptive Standard Deviation: Automatically adjusts volatility bands based on market conditions
VWAP Integration: Incorporates volume-weighted average price for better price context
Machine Learning Elements: Self-adjusting parameters that learn from recent market behavior
Multi-Regime Detection: Identifies high/low volatility environments
Dynamic Weighting: Automatically adjusts component weights based on market performance
Z-Score Analysis: Statistical significance measurement for deviations
📈 How It Works
The indicator combines four key market components:
Price Momentum with VWAP deviation
Volume-Weighted Volatility
RSI with Volume Confirmation
Market Structure Analysis
🎯 Interpretation
0-30: Extreme Fear (Potential Buying Opportunity)
30-40: Fear
40-60: Neutral
60-70: Greed
70-100: Extreme Greed (Potential Selling Opportunity)
⚡ Unique Advantages
Self-Adjusting Bands: SD bands expand during high volatility, contract during calm periods
Regime Awareness: Different signals for high/low volatility environments
Volume Validation: All components include volume confirmation
Statistical Significance: Z-scores show how extreme current readings are
🚨 Alert Conditions
Extreme greed/fear in high volatility regimes
Statistical outliers (Z-score > 2.5)
Trend acceleration signals
💡 Ideal For
Crypto traders seeking sentiment-based entries/exits
Swing traders looking for mean reversion opportunities
Risk management and position sizing decisions
Market regime identification
⚙️ Customization
Adjustable parameters include lookback period, SD multiplier, smoothing, and ML learning rate to match your trading style.
Category: Strategy & Sentiment Analysis
Tags: #FearAndGreed #MarketSentiment #Volatility #Cryptocurrency #Trading #Indicator #MachineLearning #VWAP

BTC Institutional Playbook Smart Liquidity + SqueezeBTC Institutional Playbook — Smart Liquidity + Squeeze + VWAP (v6, ADX fix)
Repulse OB/OS Z-Score (v3)🔹 What this script does
This indicator is an enhanced version of the Repulse, originally developed by Eric Lefort. The Repulse measures bullish and bearish pressure in the market by analyzing price momentum and crowd behavior.
In this version, I introduce a Z-Score transformation to the Repulse values. The Z-Score converts raw outputs into a standardized statistical scale, allowing traders to identify when pressure is abnormally high or low relative to historical conditions.
🔹 How it works
Repulse Core: The original Repulse calculation compares buying vs. selling pressure, highlighting shifts in momentum.
Z-Scoring Method: Repulse values are normalized around their mean and scaled by standard deviation. This transforms the indicator into a dimensionless metric, where:
Positive Z-Scores indicate stronger-than-usual bullish pressure.
Negative Z-Scores indicate stronger-than-usual bearish pressure.
Bands: Thresholds such as ±1 or ±2 Z-Scores can help detect when pressure is stretched, potentially signaling exhaustion or reversal points.
🔹 Why it’s useful
Statistical Clarity: Traders can instantly see whether current pressure is normal or extreme.
Cross-Asset Comparisons: Because Z-Scores are standardized, signals can be compared across different markets or timeframes.
Mean Reversion Tool: Extreme Z-Score values often precede turning points, making this a versatile addition to trend and momentum analysis.
🔹 How to use it
Apply the indicator to any chart and timeframe.
Watch for Z-Scores above +2 (possible overheated bullish pressure) or below –2 (possible oversold/exhaustion).
Use these levels as contextual signals, not standalone triggers. Best results come from combining with price structure, support/resistance, or volume analysis.
⚠️ Note: This script does not predict price. It highlights statistical extremes in pressure to support decision-making. Always use in combination with other tools and risk management practices.
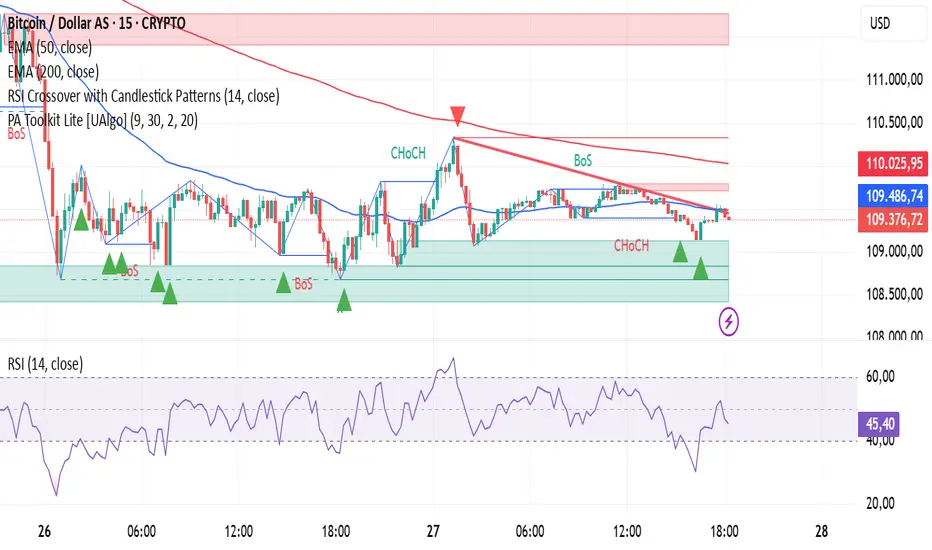
RSI Crossover with Candlestick Patternsusing the RSI indicator levels 40 and 60, where the signal cuts above level 40 with a candlestick hammer or bull engulfing and cuts below level 60 with a candlestick inverter hammer or bearish engulfing.
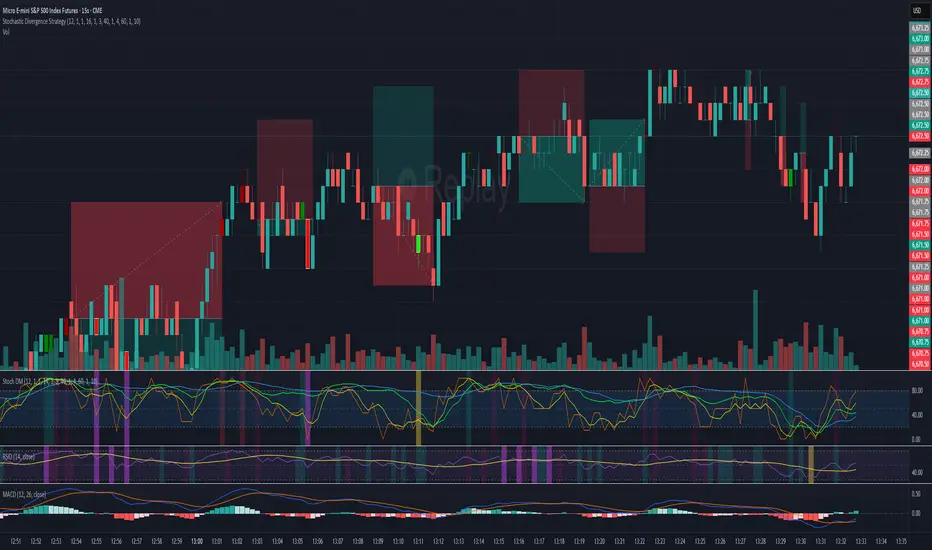
Stochastic Divergence Indicatorshows bullish and bearish divergence with green and red candles. white border for double dip
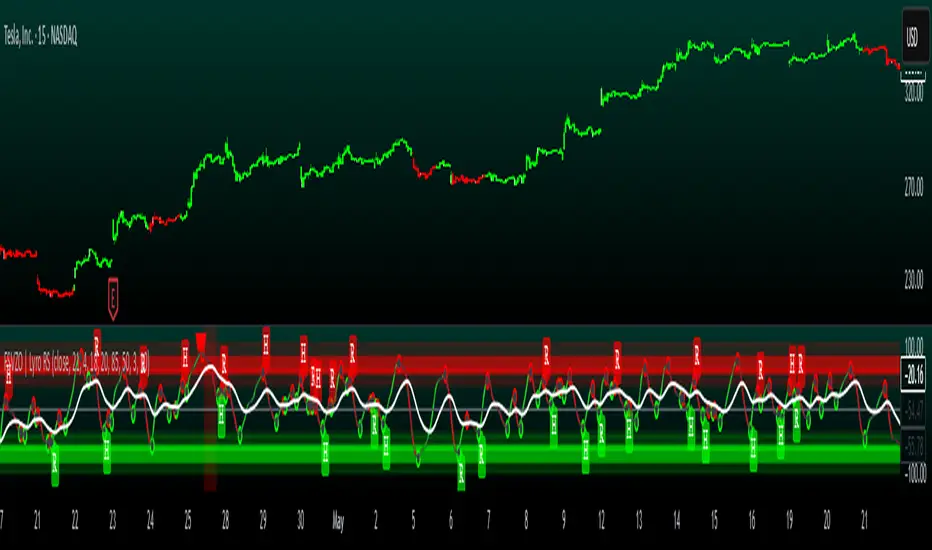
FSVZO | Lyro RSFSVZO | Lyro RS
This script is a technical analysis tool called the FSVZO, or Fourier Smoothed Volume Zone Oscillator. It is designed to analyze market momentum and trend strength by combining price and volume data with advanced smoothing techniques. The goal is to help identify potential trends, overbought/oversold conditions, and divergence signals in a clear visual format.
Understanding the Indicator's Components
The indicator plots a main oscillator line and several supporting elements on a separate pane below the chart.
The Main Oscillator: This is the primary, colored wave. Its movement and color are key to interpretation.
Trend Direction: The color shifts between bullish and bearish tones based on the momentum of the oscillator. This provides a quick visual reference for the prevailing short-term trend.
Key Levels: Horizontal lines mark significant levels such as +60, +85, -60, and -85. Movements above +60 or below -60 can indicate strong momentum, while approaches to the extreme levels (+85/-85) may suggest overbought or oversold conditions.
Divergence Detection: The indicator can plot labels ("ℝ" for Regular, "ℍ" for Hidden) on the oscillator to signal potential divergences. These occur when the indicator's direction differs from the price action on the main chart and can sometimes foreshadow reversals or continuations.
Moving Average (MA): A central moving average line, based on the oscillator, helps to smooth out the data further and can act as a dynamic support or resistance level within the indicator pane.
White Noise Filter (Optional): This feature displays a histogram that represents market noise. It can be toggled on or off. Analyzing the histogram's behavior may provide additional context on the stability or volatility of the current trend.
Dynamic Background: The background of the indicator pane can change color to highlight periods where the momentum is particularly strong, based on the position of the moving average.
Suggested Use and Interpretation
Traders might use this indicator in several ways:
Trend Identification: Observe the color and position of the main oscillator. A predominantly bullish-colored oscillator above the zero line may suggest an upward trend, while a bearish-colored one below zero may suggest a downward trend.
Signal Confirmation: Look for the oscillator to cross key levels (like +/-40 or +/-60) in the direction of a suspected trend as a confirmation signal.
Divergence Analysis: When the price makes a new high or low that is not confirmed by a new high or low on the FSVZO oscillator (a divergence), it can be a warning of potential weakness in the trend. The "ℝ" and "ℍ" labels help to identify these scenarios.
Extreme Readings: Readings near the +85 or -85 levels can indicate that a price move may be overextended, which could precede a pause or reversal.
Customization Options
The indicator includes settings groups that allow you to adjust its behavior and appearance:
FSVZO Settings: Adjust parameters like Length and Sensitivity to make the oscillator more or less responsive to market movements.
Signals & Display: Modify visual aspects such as Smooth Length and Glowing Amount, or toggle features like the dynamic background on and off.
Colors: Choose from several pre-set color palettes to suit your visual preferences.
⚠️Disclaimer
This indicator is a tool for technical analysis and does not provide guaranteed results. It should be used in conjunction with other analysis methods and proper risk management practices. The creators of this indicator are not responsible for any financial decisions made based on its signals.


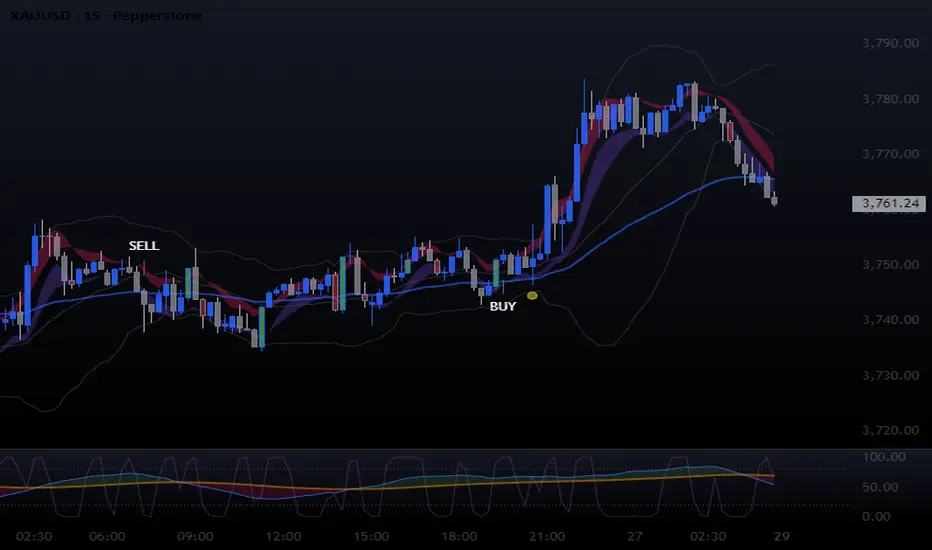
VWAP Momentum Oscillator How It Works
Core Calculation Method
The oscillator combines four key market measurements into a single, normalized reading:
1. Price-VWAP Deviation: `(Close - VWAP) / VWAP × 100`
2. VWAP-MA Momentum: `(VWAP - MovingAverage) / MovingAverage × 100`
3. Anchored VWAP Strength: Average of high/low anchor deviations from rolling VWAP
4. Range Position: `(Close - PeriodLow) / (PeriodHigh - PeriodLow) × 100 - 50`
Dynamic Signal Line
The signal line uses an EMA that automatically adjusts its length based on your chart timeframe:
- Futures: Always covers 23 hours of trading (1,380 minutes)
- Stocks: Always covers 6.5 hours of trading (390 minutes)
- Examples: 276 periods on 5-min futures chart, 1,380 periods on 1-min futures chart
Trading Signals
🟢 Buy Signals
- Condition: Main oscillator crosses above signal line while below zero
- Logic: Momentum turning bullish from oversold conditions
- Visual: Green "BUY" label below price action
🔴 Sell Signals
- Condition: Main oscillator crosses below signal line while above zero
- Logic: Momentum turning bearish from overbought conditions
- Visual: Red "SELL" label above price action
⚠️ Extreme Warnings
- Extreme Overbought: Red triangle when oscillator crosses above +4.0
- Extreme Oversold: Green triangle when oscillator crosses below -4.0
- Purpose: Risk management alerts, not entry/exit signals
Oscillator Zones
Interpretation Guide
- Above +2.0: Strong bullish momentum zone (green background)
- 0 to +2.0: Mild bullish territory
- 0 to -2.0: Mild bearish territory
- Below -2.0: Strong bearish momentum zone (red background)
- Above +4.0: Extreme overbought (caution advised)
- Below -4.0: Extreme oversold (potential reversal zone)
Customization Options
Moving Average Settings
- EMA/SMA Toggle: Choose between exponential or simple moving average
- Color Customization: Adjust MA line color and width
Visual Controls
- Bullish/Bearish Colors: Customize momentum zone colors
- Signal Line: Toggle visibility and adjust color
- Line Widths: Control thickness of all plot lines
Anchor Modes
- NY Session Only: Anchors reset at NY market open (9:30 AM ET)
- 24H NY Day: Anchors reset at NY calendar day change (midnight ET)
Best Practices
Timeframe Selection
- Scalping: 1-5 minute charts for quick momentum changes
- Day Trading: 5-15 minute charts for clearer trend signals
- Swing Trading: 1-4 hour charts for major momentum shifts
Signal Confirmation
- Wait for crossovers: Don't trade on oscillator position alone
- Respect extreme levels: Exercise caution above +4 or below -4
- Use with price action: Combine with support/resistance levels
Risk Management
- Extreme zones: Reduce position size when oscillator is extended
- Failed signals: Exit quickly if momentum doesn't follow through
- Market context: Consider overall trend direction and market volatility
Technical Specifications
Calculation Components
- Base Length: 1,380 periods (futures) / 390 periods (stocks)
- Signal Line: Dynamic EMA covering one full trading day
- Smoothing: 3-period SMA on raw oscillator (adjustable)
- Update Frequency: Real-time on every price tick
Performance Notes
- Resource Efficient: Optimized calculations minimize CPU usage
- Memory Friendly: Uses incremental VWAP calculations
- Fast Loading: Minimal historical data requirements
Version History & Development
This oscillator evolved from advanced VWAP overlay strategies, transforming complex multi-line analysis into a single, actionable momentum gauge. The indicator maintains the sophistication of institutional VWAP analysis while providing the clarity needed for retail trading decisions.
Core Philosophy
Traditional VWAP indicators show where price is relative to volume-weighted averages, but they don't quantify momentum or provide clear entry/exit signals. This oscillator solves that problem by normalizing all VWAP relationships into a single, bounded indicator that works consistently across all timeframes and asset classes.
---
Open Source License: This indicator is provided free for the TradingView community. Feel free to modify and enhance according to your trading needs.

GME Cycle Predictor# 🚀 GME Cycle Predictor - Advanced Technical Analysis Tool
**Comprehensive GameStop (GME) cycle tracking indicator based on historical patterns and market mechanics.**
## 📊 **What This Indicator Does:**
- Tracks **147-day quarterly cycles** from the January 28, 2021 squeeze
- Monitors the **1704-day major cycle** (the theoretical "big one")
- Identifies **T+35 FTD settlement periods** for forced buying pressure
- Marks **quarterly OPEX** and **swap roll dates**
- Provides **real-time buy/sell recommendations** based on cycle timing
## 🎯 **Key Features:**
### **Visual Cycle Markers:**
- 🔴 **Red Circles**: 147-day quarterly cycles
- 🟡 **Yellow Diamonds**: 1704-day major cycle (CRITICAL)
- 🟢 **Green Squares**: T+35 FTD settlement dates
- 🟠 **Orange Triangles**: Quarterly OPEX periods
- 🟣 **Purple X's**: Swap roll periods
### **Smart Trading Signals:**
- **🚀 MAJOR BUY**: 10+ days before 1704-day cycle
- **📈 BUY ZONE**: 5-10 days before 147-day cycle
- **💚 FTD BUY**: 2-5 days before T+35 settlement
- **📉 SELL ZONE**: Day of cycle completion
- **⏳ WAIT**: No active signals
## 📈 **How to Use:**
### **For Swing Trading:**
1. **BUY** when cheat sheet shows active buy signals
2. **SELL** on cycle completion days
3. **HODL** through the 1704-day major cycle
### **For Long-term Investors:**
- Monitor the **1704-day countdown** (major cycle theory)
- Accumulate during **confluence periods** (multiple cycles aligning)
- Use **147-day cycles** for entry/exit timing
## 🔧 **Technical Foundation:**
- Based on **Fail-to-Deliver (FTD)** settlement mechanics
- **Quarterly swap theory** and institutional obligations
- **Options expiration (OPEX)** pressure points
- **Historical pattern recognition** from 2021 squeeze
## ⚡ **Real-Time Features:**
- **Live countdown timers** to next major cycles
- **Dynamic trading recommendations**
- **Confluence detection** when multiple cycles align
- **Volume confirmation** for signal validation
- **Clean visual design** with minimal chart clutter
## 🎯 **Perfect For:**
- GME traders following cycle theory
- Technical analysts studying market mechanics
- Swing traders using institutional obligation cycles
- Anyone tracking the theoretical "MOASS" timing
## ⚠️ **Important Notes:**
- This indicator is based on **theoretical cycle patterns**
- Past performance does not guarantee future results
- Always use proper risk management
- The 1704-day cycle is **unproven theory** - trade responsibly
- Best used in conjunction with other technical analysis
## 🚀 **Special Feature:**
The **1704-day major cycle** countdown tracks the theoretical "Mother of All Short Squeezes" (MOASS) timing, calculated from the January 28, 2021 squeeze peak. This is the cycle many GME theorists believe will trigger the ultimate price movement.
---
**Perfect for both beginners and advanced traders who want to incorporate GME cycle theory into their technical analysis toolkit.**
*Disclaimer: This is a theoretical analysis tool based on community research. Not financial advice. Trade at your own risk.*

EMA Regime (9/20/50/100/200) — Stacked with 200 FilterEMA Regime (9/20/50/100/200) — Stacked Long/Short Box
Plots the 9, 20, 50, 100, and 200 EMAs on the chart.
Checks if price is above or below each EMA and whether the EMAs are stacked in order.
LONG signal: price above all selected EMAs and EMAs stacked 9 > 20 > 50 > 100 >(> 200 if strict mode on).
SHORT signal: price below all selected EMAs and EMAs stacked 9 < 20 < 50 < 100 (< 200 if strict mode on).
Shows a two-row table (LONGS / SHORTS) so you can quickly see which EMAs are aligned.
Optionally colors candles green/red when a full long/short regime is active.
Can show labels when a new LONG or SHORT condition appears.
Has alerts you can use for automated notifications when the regime flips.
“Use 200 EMA in the stack” lets you choose ultra-strict mode (9>20>50>100>200) or lighter mode (9>20>50>100 but price & 9 above 200).


Oscillator Matrix [Alpha Extract]A comprehensive multi-oscillator system that combines volume-weighted money flow analysis with enhanced momentum detection, providing traders with a unified framework for identifying high-probability market opportunities across all timeframes. By integrating two powerful oscillators with advanced confluence analysis, this indicator delivers precise entry and exit signals while filtering out market noise through sophisticated threshold-based regime detection.
🔶 Volume-Weighted Money Flow Analysis
Utilizes an advanced money flow calculation that tracks volume-weighted price movements to identify institutional activity and smart money flow. This approach provides superior signal quality by emphasizing high-volume price movements while filtering out low-volume market noise.
// Volume-weighted flows
up_volume = price_up ? volume : 0
down_volume = price_down ? volume : 0
// Money Flow calculation
up_vol_sum = ta.sma(up_volume, mf_length)
down_vol_sum = ta.sma(down_volume, mf_length)
total_volume = up_vol_sum + down_vol_sum
money_flow_ratio = total_volume > 0 ? (up_vol_sum - down_vol_sum) / total_volume : 0
🔶 Enhanced Hyper Wave Oscillator
Features a sophisticated MACD-based momentum oscillator with advanced normalization techniques that adapt to different price ranges and market volatility. The system uses percentage-based calculations to ensure consistent performance across various instruments and timeframes.
// Enhanced MACD-based oscillator
fast_ma = ta.ema(src, hw_fast)
slow_ma = ta.ema(src, hw_slow)
macd_line = fast_ma - slow_ma
signal_line = ta.ema(macd_line, hw_signal)
// Proper normalization using percentage of price
price_base = ta.sma(close, 50)
macd_normalized = macd_line / price_base
hyper_wave = macd_range > 0 ? macd_normalized / macd_range : 0
🔶 Multi-Factor Confluence System
Implements an intelligent confluence scoring mechanism that combines signals from both oscillators to identify high-probability trading opportunities. The system assigns strength scores based on multiple confirmation factors, significantly reducing false signals.
🔶 Fixed Threshold Levels
Uses predefined threshold levels optimized for standard oscillator ranges to distinguish between normal market fluctuations and significant momentum shifts. The dual-threshold system provides clear visual cues for overbought/oversold conditions while maintaining consistent signal criteria across different market conditions.
🔶 Overflow Detection Technology
Advanced overflow indicators identify extreme market conditions that often precede major reversals or continuation patterns. These signals highlight moments when market momentum reaches critical levels, providing early warning for potential turning points.
🔶 Dual Oscillator Integration
The indicator simultaneously tracks volume-weighted money flow and momentum-based price action through two independent oscillators. This dual approach ensures comprehensive market analysis by capturing both institutional activity and technical momentum patterns.
// Multi-factor confluence scoring
confluence_bull = (mf_bullish ? 1 : 0) + (hw_bullish ? 1 : 0) +
(mf_overflow_bull ? 1 : 0) + (hw_overflow_bull ? 1 : 0)
confluence_bear = (mf_bearish ? 1 : 0) + (hw_bearish ? 1 : 0) +
(mf_overflow_bear ? 1 : 0) + (hw_overflow_bear ? 1 : 0)
confluence_strength = confluence_bull > confluence_bear ? confluence_bull / 4 : -confluence_bear / 4
🔶 Intelligent Signal Generation
The system generates two tiers of reversal signals: strong signals that require multiple confirmations across both oscillators, and weak signals that identify early momentum shifts. This hierarchical approach allows traders to adjust position sizing based on signal strength.
🔶 Visual Confluence Zones
Background coloring dynamically adjusts based on confluence strength, creating visual zones that immediately communicate market sentiment. The intensity of background shading corresponds to the strength of the confluent signals, making pattern recognition effortless.
🔶 Threshold Visualization
Color-coded threshold zones provide instant visual feedback about oscillator positions relative to key levels. The fill areas between thresholds create clear overbought and oversold regions with graduated color intensity.
🔶 Candle Color Integration
Optional candle coloring applies confluence-based color logic directly to price bars, creating a unified visual framework that helps traders correlate indicator signals with actual price movements for enhanced decision-making.
🔶 Overflow Alert System
Specialized circular markers highlight extreme overflow conditions on both oscillators, drawing attention to potential climax moves that often precede significant reversals or accelerated trend continuation.
🔶 Customizable Display Options
Comprehensive display controls allow traders to toggle individual components on or off, enabling focused analysis on specific aspects of the indicator. This modularity ensures the indicator adapts to different trading styles and analytical preferences.
1 Week
1 Day
15 Min
This indicator provides a complete analytical framework by combining volume analysis with momentum detection in a single, coherent system. By offering multiple confirmation layers and clear visual hierarchies, it empowers traders to identify high-probability opportunities while maintaining precise risk management across all market conditions and timeframes. The sophisticated confluence system ensures that signals are both timely and reliable, making it an essential tool for serious technical analysts.

Stochastic [Paifc0de]Stochastic — clean stochastic oscillator with visual masking, neutral markers, and basic filters
What it does
This indicator plots a standard stochastic oscillator (%K with smoothing and %D) and adds practical quality-of-life features for lower timeframes: optional visual masking when %K hugs overbought/oversold, neutral K–D cross markers, session-gated edge triangles (K crossing 20/80), and simple filters (minimum %K slope, minimum |K–D| gap, optional %D slope agreement, mid-zone mute, and a cooldown between markers). Display values are clamped to 0–100 to keep the panel scale stable. The tool is for research/education and does not generate entries/exits or financial advice.
Default preset: 20 / 10 / 10
K Length = 20
Classic lookback used in many textbooks. On intraday charts it balances responsiveness and stability: short enough to react to momentum shifts, long enough to avoid constant whipsaws. In practice it captures ~the last 20 bars’ position of close within the high–low range.
K Smoothing = 10
A 10-period SMA applied to the raw %K moderates the “saw-tooth” effect that raw stochastic can exhibit in choppy phases. The smoothing reduces over-reaction to micro spikes while preserving the main rhythm of swings; visually, %K becomes a continuous path that is easier to read.
D Length = 10
%D is the moving average of smoothed %K. With 10, %D becomes a clearly slower guide line. The larger separation between %K(10-SMA) and %D(10-SMA of %K) produces cleaner crosses and fewer spurious toggles than micro settings (e.g., 3/3/3). On M5–M15 this pair often yields readable cross cycles without flooding the chart.
How the 20/10/10 trio behaves
In persistent trends, %K will spend more time near 20 or 80; the 10-period smoothing delays flips slightly and emphasizes only meaningful turn attempts.
In ranges, %K oscillates around mid-zone (40–60). With 10/10 smoothing, cross signals cluster less densely; combining with the |K–D| gap filter helps keep only decisive crosses.
If your symbol is unusually volatile or illiquid, reduce K Length (e.g., 14) or reduce K Smoothing (e.g., 7) to keep responsiveness. If crosses feel late, decrease D Length (e.g., 7). If noise is excessive, increase K Smoothing first, then consider raising D Length.
Visuals
OB/OS lines: default 80/20 reference levels and a midline at 50.
Masking near edges: %K can be temporarily hidden when it is pressing an edge, approaching it with low slope, or going nearly flat near the boundary. This keeps the panel readable during “stuck at the edge” phases.
Soft glow (optional): highlights %K’s active path; can be turned off.
Light/Dark palette: quick toggle to match your chart theme.
Scale safety: all plotted values (lines, fills, markers) are clamped to 0–100 to prevent the axis from expanding beyond the stochastic range.
Markers and filters
Neutral K–D cross markers: circles in the mid-zone when %K crosses %D.
Edge triangles: show when %K crosses 20 or 80; can be restricted to a session window (02:00–12:00 ET).
Filters (optional):
Min %K slope: require a minimum absolute slope so very flat crosses are ignored.
Min |K–D| gap: demand separation between lines at the cross moment.
%D slope agreement: keep crosses that align with %D’s direction.
Mid-zone mute: suppress crosses inside a user-defined 40–60 band (defaults).
Cooldown: minimum bars between successive markers.
Parameters (quick guide)
K Length / K Smoothing / D Length: core stochastic settings. Start with 20/10/10; tune K Smoothing first if you see too much jitter.
Overbought / Oversold (80/20): adjust for assets that tend to trend (raise to 85/15) or mean-revert (lower to 75/25).
Slope & gap filters: increase on very noisy symbols; reduce if you miss too many crosses.
Session window (triangles only): use if you want edge markers only during active hours.
Marker size and offset: cosmetic; they do not affect calculations.
Alerts
K–D Cross Up (filtered) and K–D Cross Down (filtered): fire when a cross passes your filters/cooldown.
Edge Up / Edge Down: fire when %K crosses the 20/80 levels.
All alerts confirm on bar close.
Notes & attribution
Original implementation and integration by Paifc0de; no third-party code is copied.
This indicator is for research/education and does not provide entries/exits or financial advice.

SZN - Altcoin OscillatorSZN Altcoin Oscillator – Identify Market Phases with Precision
What is the SZN Altcoin Oscillator?
The SZN Altcoin Oscillator is a multi-layered analysis indicator specifically developed for the altcoin market.
It combines different signal groups (trend, relative strength, volume, market environment, and overheating filters) into a unified oscillator in the 0–100 range.
--> The goal is to make major market movements visible while separating short-term fluctuations from broader trends.
Why not just use RSI or MACD?
Classic single indicators like RSI or MACD often react too sensitively to short-term fluctuations.
This leads to many false signals – especially during volatile altcoin phases.
--> The SZN Altcoin Oscillator solves this problem by combining and filtering multiple signal sources.
--> This smooths out overreactions and identifies true trend movements more reliably.
-----
How does it work?
The oscillator consists of five signal groups:
Price & Trend Momentum
checks the relative position of fast and slow moving averages
detects whether an altcoin is in a confirmed uptrend or downtrend
Relative Strength vs. Bitcoin & Ethereum
measures performance compared to the two market leaders
shows whether capital is rotating into altcoins or staying in majors
Volume and Breakout Filter
detects whether breakouts are confirmed by increased volume
prevents short “fakeouts” from appearing as buy signals
Market Environment (Regime Filter)
includes overall market data such as BTC dominance or TOTAL3
ensures that buy signals only trigger in suitable market phases
Overheating & Oversold Filter
marks statistically extreme zones
upward cross from oversold → buy signal
downward cross from overheated → sell signal
--> All results are displayed in a 0–100 oscillator.
Buy signal: upward cross from oversold zones
Sell signal: downward cross from overheated zones
-----
Variants (selection in the settings menu)
The indicator offers 5 preconfigured variants, optimized for different altcoin groups:
Default
The neutral standard configuration – balanced between sensitivity and stability. Suitable for a wide range of altcoins with medium to large market capitalization.
Large Caps
More conservative parameters with stronger smoothing. Designed for established projects (Top 20), where trends develop more slowly but with higher reliability.
Mid Caps
A balanced approach for mid-sized market caps. More sensitive than the Large-Cap variant, but filters more noise than the Small-Cap settings.
Small Caps
Higher sensitivity, optimized for more volatile coins (Top 100–200). Detects dynamic moves faster, but with higher risk of false signals.
Meme Coins
Adapted for highly speculative tokens. Accounts for extreme volatility and shorter cycles to better highlight overheating phases.
--> This allows each user to select the variant best suited to the asset category being analyzed.
-----
Recommended Usage
Timeframe: Daily chart (highest precision). For very new projects, the 8h chart can be used.
Asset selection: Coins with sufficient history (at least 200 trading days).
-----
Interpretation:
Oscillator rising from oversold → potential bottom / upward trend reversal
Oscillator falling from overheated → potential top / profit-taking zone
Movements in between indicate interim rallies or correction phases
The indicator is not a day-trading tool, but optimized for cyclical moves and swing trading.
-----
Notes:
The SZN Altcoin Oscillator is an additional analysis tool and does not replace independent trading decisions.
All signals are probabilistic; there is no guarantee of profits.
Effectiveness depends on the specific altcoin and the current market phase.
The indicator provides insights into broader market phases, not short-term price moves.

Market Pressure Oscillator█ OVERVIEW
The Market Pressure Oscillator is an advanced technical indicator for TradingView, enabling traders to identify potential trend reversals and momentum shifts through candle-based pressure analysis and divergence detection. It combines a smoothed oscillator with moving average signals, overbought/oversold levels, and divergence visualization, enhanced by customizable gradients, dynamic band colors, and alerts for quick decision-making.
█ CONCEPT
The indicator measures buying or selling pressure based on candle body size (open-to-close difference) and direction, with optional smoothing for clarity and divergence detection between price action and the oscillator. It relies solely on candle data, offering insights into trend strength, overbought/oversold conditions, and potential reversals with a customizable visual presentation.
█ WHY USE IT?
- Divergence Detection: Identifies bullish and bearish divergences to reinforce signals, especially near overbought/oversold zones.
- Candle Pressure Analysis: Measures pressure based on candle body size, normalized to a ±100 scale.
- Signal Generation: Provides buy/sell signals via overbought/oversold crossovers, zero-line crossovers, moving average zero-line crossovers, and dynamic band color changes.
- Visual Clarity: Uses dynamic colors, gradients, and fill layers for intuitive chart analysis.
Flexibility: Extensive settings allow customization to individual trading preferences.
█ HOW IT WORKS?
- Candle Pressure Calculation: Computes candle body size as math.abs(close - open), normalized against the average body size over a lookback period (avgBody = ta.sma(body, len)). - Candle direction (bullish: +1, bearish: -1, neutral: 0) is multiplied by body weight to derive pressure.
- Cumulative Pressure: Sums pressure values over the lookback period (Lookback Length) and normalizes to ±100 relative to the maximum possible value.
- Smoothing: Optionally applies EMA (Smoothing Length) to normalized pressure.
- Moving Average: Calculates SMA (Moving Average Length) for trend confirmation (Moving Average (SMA)).
- Divergence Detection: Identifies bullish/bearish divergences by comparing price and oscillator pivot highs/lows within a specified range (Pivot Length). Divergence signals appear with a delay equal to the Pivot Length.
- Signals: Generates signals for:
Crossing oversold upward (buy) or overbought downward (sell).
Crossing the zero line by the oscillator or moving average (buy/sell).
Bullish/bearish divergences, marked with labels, enhancing signals, especially near overbought/oversold zones.
Dynamic band color changes when the moving average crosses MA overbought/oversold thresholds (green for oversold, red for overbought).
- Visualization: Plots the oscillator and moving average with dynamic colors, gradient fills, transparent bands, and labels, with customizable overbought/oversold levels.
Alerts: Built-in alerts for divergences, overbought/oversold crossovers, and zero-line crossovers (oscillator and moving average).
█ SETTINGS AND CUSTOMIZATION
- Lookback Length: Period for aggregating candle pressure (default: 14).
- Smoothing Length (EMA): EMA length for smoothing the oscillator (default: 1). Higher values smooth the signal but may reduce signal frequency; adjust overbought/oversold levels accordingly.
- Moving Average Length (SMA): SMA length for the moving average (default: 14, minval=1). Higher values make SMA a trend indicator, requiring adjusted MA overbought/oversold levels.
- Pivot Length (Left/Right): Candles for detecting pivot highs/lows in divergence calculations (default: 2, minval=1). Higher values reduce noise but add delay equal to the set value.
- Enable Divergence Detection: Enables divergence detection (default: true).
- Overbought/Oversold Levels: Thresholds for the oscillator (default: 30/-30) and moving average (default: 10/-10). For the moving average, no arrows appear; bands change color from gray to green (oversold) or red (overbought), reinforcing entry signals.
- Signal Type: Select signals to display: "None", "Overbought/Oversold", "Zero Line", "MA Zero Line", "All" (default: "Overbought/Oversold").
- Colors and Gradients: Customize colors for bullish/bearish oscillator, moving average, zero line, overbought/oversold levels, and divergence labels.
- Transparency: Adjust gradient fill transparency (default: 70, minval=0, maxval=100) and band/label transparency (default: 40, minval=0, maxval=100) for consistent visuals.
- Visualizations: Enable/disable moving average, gradients for zero/overbought/oversold levels, and gradient fills.
█ USAGE EXAMPLES
- Momentum Analysis: Observe the MPO Oscillator above 0 for bullish momentum or below 0 for bearish momentum. The SMA, being smoother, reacts slower and can confirm trend direction as a noise filter.
- Reversal Signals: Look for buy triangles when the oscillator crosses oversold upward, especially when the SMA is below the MA oversold threshold and the band turns green. Similarly, seek sell triangles when crossing overbought downward, with the SMA above the MA overbought threshold and the band turning red.
- Using Divergences: Treat bullish (green labels) and bearish (red labels) divergences as reinforcement for other signals, especially near overbought/oversold zones, indicating stronger potential trend reversals.
- Customization: Adjust lookback length, smoothing, and moving average length to specific instruments and timeframes to minimize false signals.
█ USER NOTES
Combine the indicator with tools like Fibonacci levels or pivot points to enhance accuracy.
Test different settings for lookback length, smoothing, and moving average length on your chosen instrument and timeframe to find optimal values.

Algorithmic Value Oscillator [CRYPTIK1]Algorithmic Value Oscillator
Introduction: What is the AVO? Welcome to the Algorithmic Value Oscillator (AVO), a powerful, modern momentum indicator that reframes the classic "overbought" and "oversold" concept. Instead of relying on a fixed lookback period like a standard RSI, the AVO measures the current price relative to a significant, higher-timeframe Value Zone .
This gives you a more contextual and structural understanding of price. The core question it answers is not just "Is the price moving up or down quickly?" but rather, " Where is the current price in relation to its recently established area of value? "
This allows traders to identify true "premium" (overbought) and "discount" (oversold) levels with greater accuracy, all presented with a clean, futuristic aesthetic designed for the modern trader.
The Core Concept: Price vs. Value The market is constantly trying to find equilibrium. The AVO is built on the principle that the high and low of a significant prior period (like the previous day or week) create a powerful area of perceived value.
The Value Zone: The range between the high and low of the selected higher timeframe.
Premium Territory (Distribution Zone): When the oscillator moves into the glowing pink/purple zone above +100, it is trading at a premium.
Discount Territory (Accumulation Zone): When the oscillator moves into the glowing teal/blue zone below -100, it is trading at a discount.
Key Features
1. Glowing Gradient Oscillator: The main oscillator line is a dynamic visual guide to momentum.
The line changes color smoothly from light blue to neon teal as bullish momentum increases.
It shifts from hot pink to bright purple as bearish momentum increases.
Multiple transparent layers create a professional "glow" effect, making the trend easy to see at a glance.
2. Dynamic Volatility Histogram: This histogram at the bottom of the indicator is a custom volatility meter. It has been engineered to be adaptive, ensuring that the visual differences between high and low volatility are always clear and dramatic, no matter your zoom level. It uses a multi-color gradient to visualize the intensity of market volatility.
3. Volatility Regime Dashboard: This simple on-screen table analyzes the histogram and provides a clear, one-word summary of the current market state: Compressing, Stable, or Expanding.
How to Use the AVO: Trading Strategies
1. Reversion Trading This is the most direct way to use the indicator.
Look for Buys: When the AVO line drops into the teal "Accumulation Zone" (below -100), the price is trading at a discount. Watch for the oscillator to form a bottom and start turning up as a signal that buying pressure is returning.
Look for Sells: When the AVO line moves into the pink "Distribution Zone" (above +100), the price is trading at a premium. Watch for the oscillator to form a peak and start turning down as a signal that selling pressure is increasing.
2. Best Practices & Settings
Timeframe Synergy: The AVO is most effective when your chart timeframe is lower than your selected "Value Zone Source." For example, if you trade on the 1-hour chart, set your Value Zone to "Previous Day."
Confirmation is Key: This indicator provides powerful context, but it should not be used in isolation. Always combine its readings with your primary analysis, such as market structure and support/resistance levels.

Premier Stochastic Oscillator [LazyBear, V2]This script builds on the well-known Premier Stochastic Oscillator (PSO) originally introduced by LazyBear, and adds a Z-Score extension to provide statistical interpretation of momentum extremes.
Features
Premier Stochastic Core: A smoothed stochastic calculation that highlights bullish and bearish momentum phases.
Z-Score Mapping: The PSO values are standardized into Z-Scores (from –3 to +3), quantifying the degree of momentum stretch.
Positive / Negative Z-Scores:
Positive Z values suggest momentum strength that can align with accumulation or favorable buying conditions.
Negative Z values indicate stronger bearish pressure, often aligning with selling or distribution conditions.
On-Chart Label: The current Z-Score is displayed on the latest bar for quick reference.
How to Use
Momentum Confirmation: Use the oscillator to confirm whether bullish or bearish momentum is intensifying.
Overextended Conditions: Extreme Z-Scores (±2 or beyond) highlight statistically stretched conditions, often preceding reversions.
Strategic Integration: Best applied in confluence with trend tools or higher-timeframe filters; not a standalone trading signal.
Originality
Unlike the standard PSO, this version:
Adds a Z-Score framework for objective statistical scaling.
Provides real-time labeling of Z values for clarity.
Extends the classic oscillator into a tool for both momentum detection and mean-reversion context.
