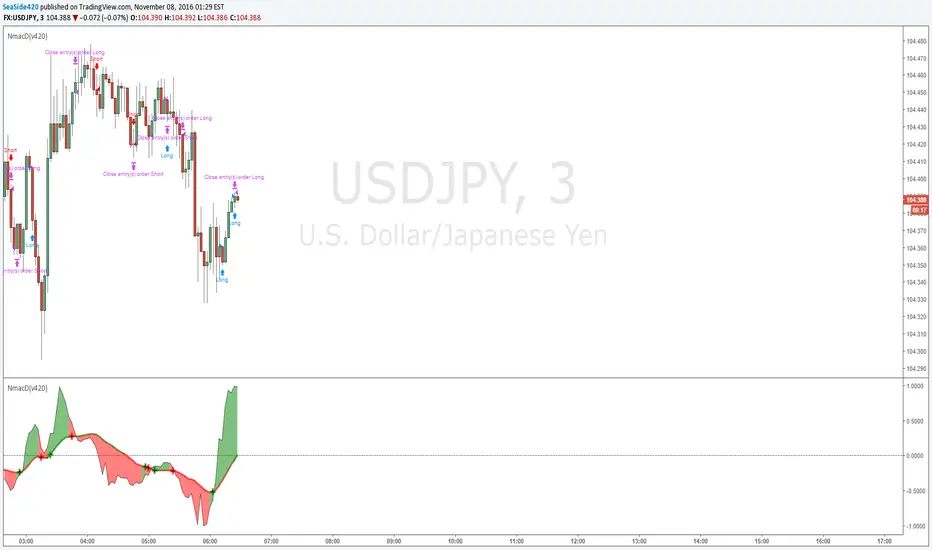
Normalized MACD (v420) strategyNormalized MACD but heavily modified for example hullMA instead of EMA the strategyPine Script® strategyby SeaSide420208
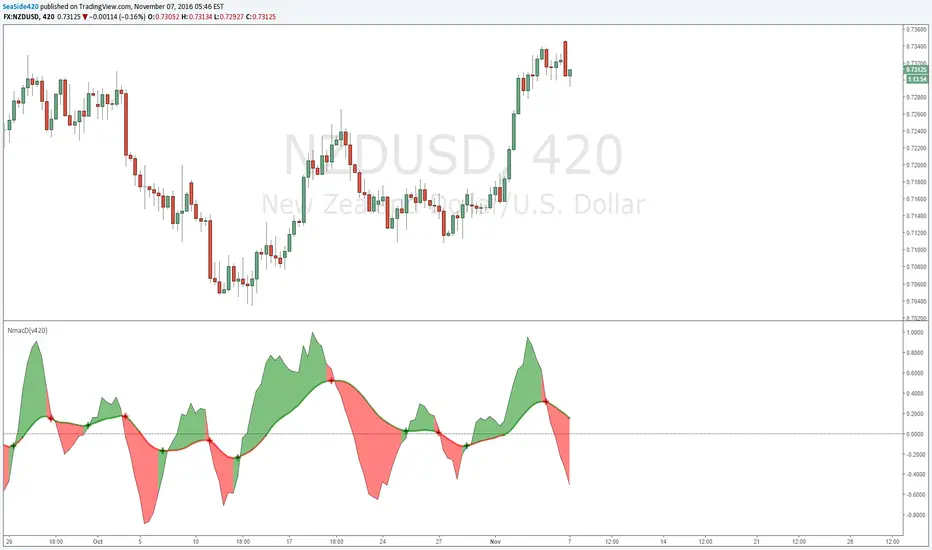
Normalized MACD (v420)Normalized MACD with HullMA good on all time-frames and pairs Pine Script® indicatorby SeaSide42011270
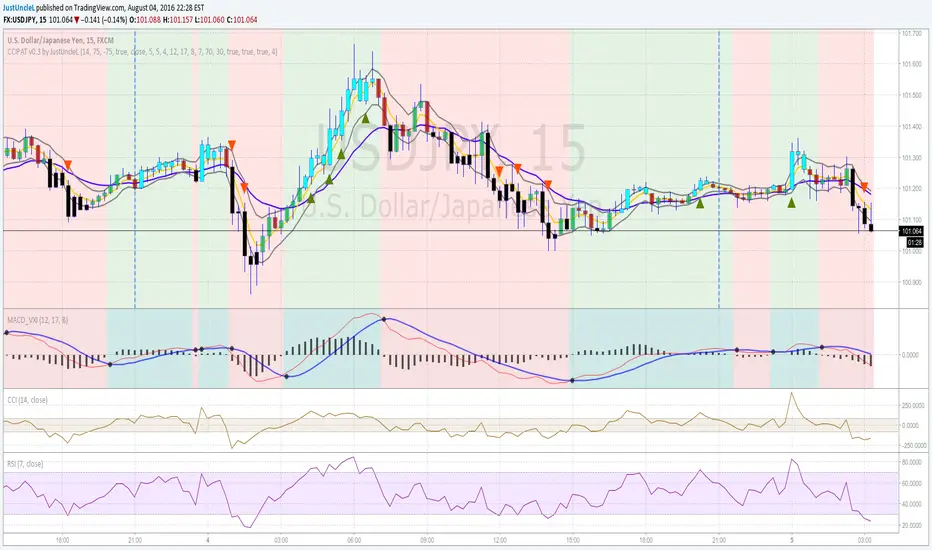
Candlestick Trend Indicator v0.5 by JustUncleLRequested Update to this Indicator alert project. In this update I have added the option to be able select which Price Action candles you want included in the display and the generated alarm Alert. Other changes also included in this update: Also added a Price Action candle for "Last Fractal S/R Break", this also a good continuation indication. Added option to select a different moving average types for directional MA line. Modified some default settings, using HullMA instead of Zero Lag EMA and standard MACD settings(12,26,9). Description: This is a trend following indicator and alert for Binary Options based on Candlestick patterns and trend line - NOTE: original system was a forex trading system. This code combines a number of indicators to create an overall trading strategy. The indicator recognises and displays some useful candle named defined patterns that are used to support trend continuation: Bearish + Bullish PinBars Dark Cloud Cover Piecing Line Bullish + Bearish Harami Bullish + Bearish Engulfing Candle Bullish + Bearish Last Fractal S/R break Also recognises main Price Action candles from ChrisMoody (CM), the four(4) price action patterns are colored coded bars: Yellow = Inside Bar - breakout/continuance Orange = Outside Bar - breakout/continuance Aqua/Fuschia = Up/Down Shaved Bars - Buying/Selling pressure Red/Green = Possible reversal PinBars - Reverse Down / reverse Up The highlighted candles (maroon and darker green) represent the defined PA patterns that have been confirmed following the current trend direction that is indicated by the Hull MA(20) line (can select a different type of MA, or even disable) and confirmed by MACD direction (can be disabled). The confirmed Alerts are indication by green (buy) and red (sell) dots at the bottom of the chart. An alert is generated from this selection for the alert condition of the alarming system. The fractal upper/lower break lines are also draw, if the (optional) last fractal break line is broken by a highlighted bar then this indicates a stronger trend conformation. The MACD indicator MACD DEUTER 2 colour(12,26,9) you can visually see the MACD histogram colours with MACD direction - needs "MACD DEUTER 2 colour" indicator. This multi-indicator set up is suitable for 1hr, 4hr and daily charts with 1-4 candle expiry. References and Inspiration from: Fractal Levels by RicardoSantos Almost Zero Lag EMA Candlestick Patterns With EMA by rmwaddelljr CM_Price-Action-Bars by ChrisMoody www.forexstrategiesresources.com "Scalp Jockey - MTF MA Cross Visual Strategizer by JayRogers" Pine Script® indicatorby JustUncleL106106 13 K
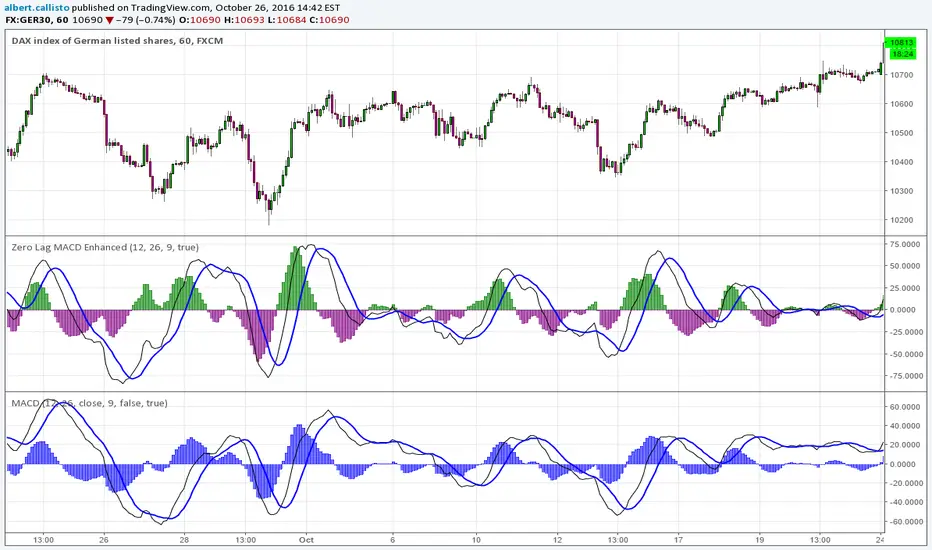
Zero Lag MACD Enhanced - Version 1.0*Zero Lag MACD indicator - Enhanced version 1.0* Based on ZeroLag EMA - see Technical Analysis of Stocks and Commodities, April 2000 Original version by user Glaz. Thanks ! (see at the end of this description). Tweaked by Albert Callisto Displayed components: Fast and slow "zero lag" moving averages Histogram showing delta between the two moving averages You can choose between SMA or EMA for the moving averages. They give slightly different results. Glaz had used SMA instead of EMA. Most "zero MACD" scripts are based upon EMA. Usage is similar to the classic MACD and it can be integrated in an existing strategy, you will notice the crossing occurs earlier. This is the original version by Glaz: Pine Script® indicatorby albert.callisto22314
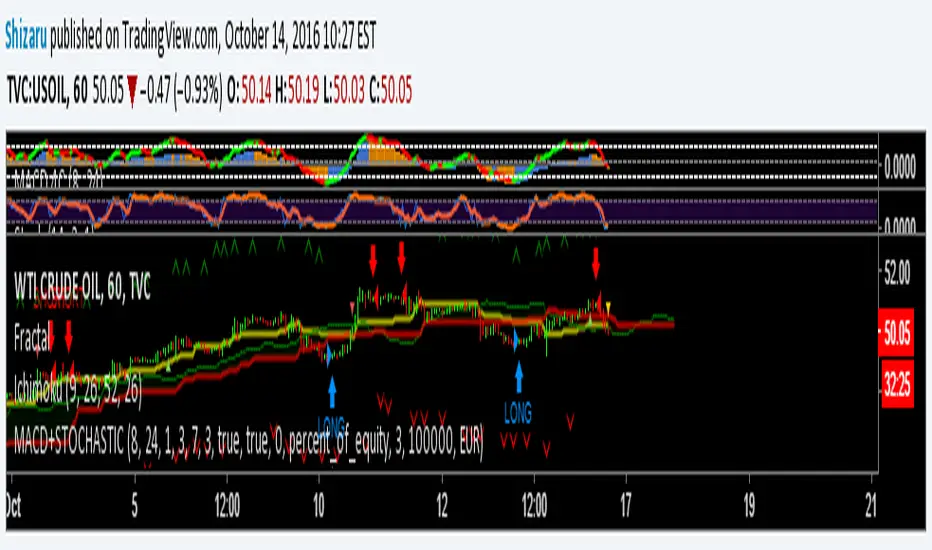
MACD+STOCHASTICA simple strategy that use MACD and STOCHASTIC to give buy/sell signal. Use fractals to put stop lossPine Script® strategyby Shizaru33631
MACD + RSI TSA simple strategy that use EMAs convergence/divergence and RSI peeks to take position. Fractals are really useful to positioning your stop loss. It works well on commodities and forex markets.Pine Script® strategyby Shizaru409
Heiken Ashi zero lag EMA v1.1 by JustUncleLI originally wrote this script earlier this year for my own use. This released version is an updated version of my original idea based on more recent script ideas. As always with my Alert scripts please do not trade the CALL/PUT indicators blindly, always analyse each position carefully. Always test indicator in DEMO mode first to see if it profitable for your trading style. DESCRIPTION: This Alert indicator utilizes the Heiken Ashi with non lag EMA was a scalping and intraday trading system that has been adapted also for trading with binary options high/low. There is also included filtering on MACD direction and trend direction as indicated by two MA: smoothed MA(11) and EMA(89). The the Heiken Ashi candles are great as price action trending indicator, they shows smooth strong and clear price fluctuations. Financial Markets: any. Optimsed settings for 1 min, 5 min and 15 min Time Frame; Expiry time for Binary options High/Low 3-6 candles. Indicators used in calculations: - Exponential moving average, period 89 - Smoothed moving average, period 11 - Non lag EMA, period 20 - MACD 2 colour (13,26,9) Generate Alerts use the following Trading Rules Heiken Ashi with non lag dot Trade only in direction of the trend. UP trend moving average 11 period is above Exponential moving average 89 period, Doun trend moving average 11 period is below Exponential moving average 89 period, CALL Arrow appears when: Trend UP SMA11>EMA89 (optionally disabled), Non lag MA blue dot and blue background. Heike ashi green color. MACD 2 Colour histogram green bars (optional disabled). PUT Arrow appears when: Trend UP SMA11Pine Script® indicatorby JustUncleLUpdated 3232 4.6 K
Normalized MACD (v420)did i remove the EMA and replace it with HullMA? yes :-) also some other maths addedPine Script® indicatorby SeaSide42044437
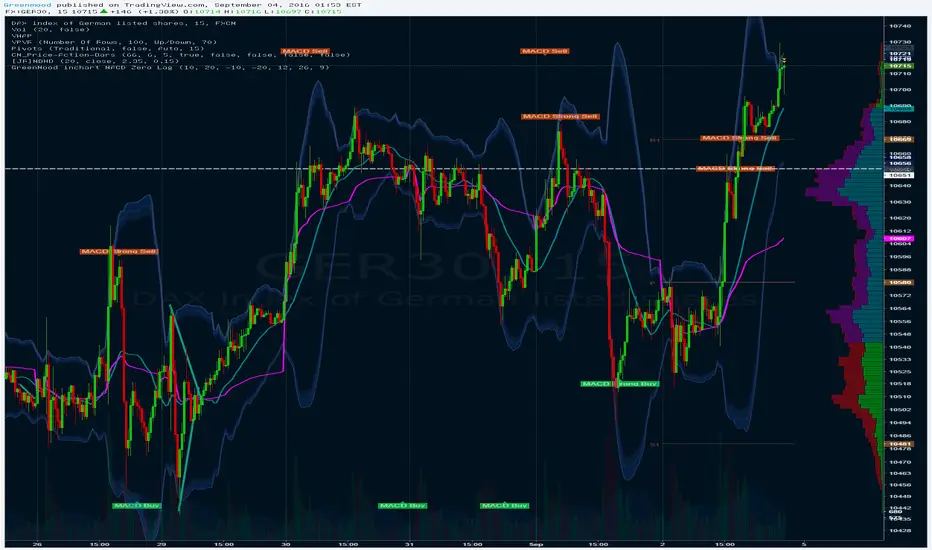
GreenMood inchart MACD Zero LagMACD Zero lag Visual inchart view. Threshold / Settings can be changed in Format view. Threshold to be adapted depending on timeframe.Pine Script® indicatorby Greenmood33389
Traders Dynamic Index Indicator Alert v0.1 by JustUncleLThis is a trend trading indicator+alert utilising the Traders Dynamic Index (TDI), Price Action Channel (PAC) and Heikin Ashi candles. About 6months ago I came across the use of TDI in "E.A.S.Y. Method" that I found in forexfactory forums: www.forexfactory.com and I was able to set up a chart based on the specifications by using Kurbelklaus scripts. However, I found that the alerts were being generated one or two bars too late, so at that time I was not successful using it with Binary Options. A few months later I found a variation of the method in the forecfactory forums which is able to generate the alerts a bit earlier, so this indicator is a modification of that early detection version. The indicator can optionally use Heikin Ashi candles only for all it's calculation. I would recommend viewing the chart with Heikin Ashi candles, these smooth out the trends and makes trends very clear. I found that this method it works good with most currency pairs or commodities and with 5min+ timeframe charts. I would suggest expiry of 2 to 6 candles. ALERT GENERATION: ================= The TDI (Traders Dynamic Index) --------------------------------------------- Volatility Band VB(34), color: Blue, buffer: UpZone, DnZone Relative Strength Index RSI(13) RSI PRICE LINE (2), color: Green, buffer: mab RSI TRADE SIGNAL LINE (7), color: Red, buffer: mbb MARKET BASE LINE MID VB(34), color: Orange, buffer: mid Indicator SignalLevels: ------------------------------- RSI_OversoldLevel : 22 (normally: 32) RSI_OverboughtLevel : 78 (normally: 68) Alert Conditions: ----------------------- Strong Buy : yellow Medium Buy : aqua Weak Buy : blue Strong Sell : fuchsia Medium Sell : purple Weak Sell : black Hints on How to use: ---------------------------- - When a Medium or Strong alert is generated and MACD histogram colour matches the direction of the alert (optional auto filter), then place trade in direction of alert candle and MACD. - I use the multi-Hull MA's for overall trend direction confirmation. - Best positions normally occur near the MACD(5,15,1) Histogram crossing the zero line. - The optional coloured Dots along the bottom of the indicator represent the first alert of this type that was generated in this sequence. - It is advisable to trade in the direction of the main trend as indicated the HULL MA red cloud: if red cloud underneath PAC then BULLISH trend, if red cloud above PAC then BEARISH trend. - Selecting the HeiKin Ashi candles does affect the MACD and MA caculations, so if you select normal candles the result chart will change. You can still Optionally select to use Heikin Ashi for calculations. - When using the Heikin Ashi candles, a good buy entry is indicated by long top wick and no bottom wick for bull (green) candles and good sell entry is indicated by long bottom wick and no top wick for bear (red) candles. - When the MACD histogram is flat and close to zero line, this indicates a ranging market, do NOT trade when this occurs. - When the PAC channel on the main chart is spread apart widely, this is an indication of extreme volatility and choppy chart, do NOT try to trade during these periods. A choppy chart is also indicated by Heikin Ashi candles with long wicks on both sides of the candles. - You can specify what strength level Alerts are generated (default 2): Level (1) means only generate Strong Alerts only. Level (2) means generate Strong and Medium Alerts. Level (3) means generate Strong, Medium and Weak Alerts. Pine Script® indicatorby JustUncleLUpdated 8686 4.9 K
Ichimoku + Daily-Candle_X + HULL-MA_X + MacDIchimoku_cloud + Daily-Candle_cross(DT) + HuLL-MovingAverage_cross + MacD any timeframe, all indicators settings adjustable for fine tuning to pair/timeframe Target Point and Stop Loss settings set SL low to reduce repaint Pine Script® strategyby SeaSide420Updated 170170 10 K
MACDouble & StochRSI w/ safeties and variable time interval v0.3UPDATE: IMPORTANT!!! MAKE SURE "RECALCULATE AFTER ORDER FILLED" IS CHECKED. I will have it on by default in the future. This is a continuation of my previous scripts of two MACD indicators with a Stochastic RSI indicator. New features: - Alternate MACD time interval You can now set the time interval for the second MACD indicator to a different resolution than the displayed chart. Uncheck the box and select the desired interval. For example, if your chart is set to 15min then first MACD will be set at 15 min and you can select 5 min for the second MACD. - Alternate StoRSI time interval You can (and should) set the StochRSI to a different time interval as well. StochRSI hasn't worked great with previous versions. Now you can set it to a different time resolution as well. I strongly recommend you set it at a higher (slower) resolution; for example if your chart is set at 15min then you should test setting the StochRSI at 30 or 45min. - ' True" StochRSI logic Trading logic for StochRSI is now a true StochRSI, instead of just reading "k" and ignoring "d", K now has to be greater than D to buy and less than to sell. - Safeties A primitive but low risk safety in the form of an uptrend/downtrend price safety. If current close+high isn't greater than the previous close and high then the buy order will not be executed. The same applies for sell orders. - Cap on losses from short positions A stop loss safety set to 9000 for exiting sell positions. This will need refinement in the future but this puts a cap on losses from any sell position. At an initial currency of 10,000 this translates to 90.00. If it is giving you problems simply delete line 78 from the source code. Please feel free to ask any questions or send me suggestions. This is still very much a work in progress and I'll try to polish up the rough spots but it is fully functional. With a slower StochRSI and the safeties I have gotten it to consistently outperform the old 2x MACD strategy script---typically by 3-fold. Pine Script® strategyby RyanMartin66335
Price Action Trading System v0.3 by JustUncleLThis is an updated and improved version of my "Price Action Trading strategy". I have added two extra optional filters, one is a trend direction filter based on the MACD slow EMA(17), blue line, and the other is a RSI(7) filter which works similarly to CCI(14) but slightly different dynamics (thank you to gianfranco60 for the suggestion). Also made a couple of corrections: - input for lenLower minval=1 should be maxval=-1 - one bar pullback did not reset trigger, missing some alerts Some Notes about usage: - this is an alert indicator not a signal generator, each alert is a strong trend continuance candidate, but should be treated on it's own merits by looking at chart dynamics and market conditions. - will work well on trending markets only. - works best on the first alert after MACD cross over. - don't take trades when MACD and signal are close together. - don't trade when channel and slow MA are flat or close together or chopper (yellow and blue MA cross over quickly over short period).Pine Script® indicatorby JustUncleL2828 5.1 K
Oscillator Moving Average (OsMA)This code for Oscillator of Moving Averages (OsMA) is based on MACD 4C indicator code published by vkno422 . Many thanks to vkno422. I have borrowed the concept of 4 colours which I find very useful. For those who are not familiar with OsMA, it is histogram of difference between MACD (oscillator) and its MA (signal line). The zero line cross over of this indicator is used in many strategies. This version includes MACD & its signal line together with OsMA histogram. I have programmed flexibility for switching OFF/ON individual indicator components as well as changing the periods for various moving averages. I am dedicating this indicator to the TV trading community hoping that people will find it useful. Pine Script® indicatorby anexas1111 2 K
SMACDGraphs slope of ohlc4 MACD When it =0, trend change play with slow&fast lengths as well as the length used to calculate the slope. -in progress(?) Vertical lines in the image are as close as I could get them to SMACD=0. Pine Script® indicatorby takuo_takuo68
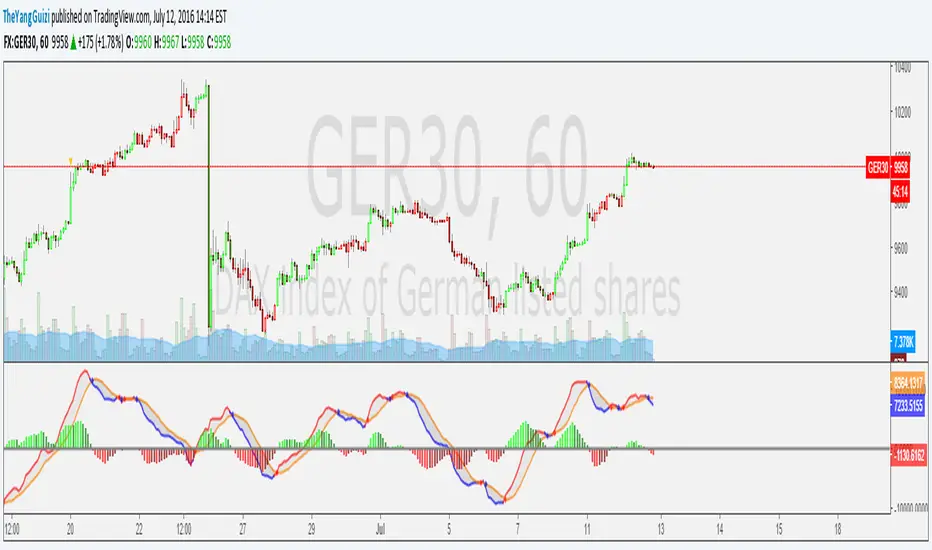
Accumulation/Distribution MACDMACD of acc/dist instead of the normal stuff. Dunno if it's actually useful. Just wanted to see what happened. Thanks to ChrisMoody who's macd script I stolePine Script® indicatorby TheYangGuizi33563
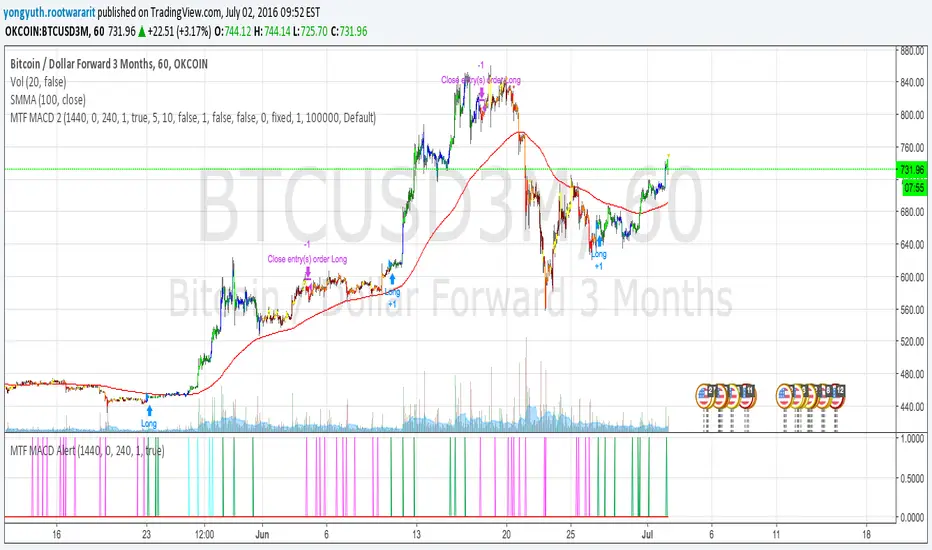
MTF MACD 2 By YuthavithiIf you want a good strategy without repaint. This one might be for you. Excellent profitable for BTCUSD3M for OKCoin. It uses multiple time frame MACD for trading decision. To avoid repaint, set the delay period = 1 for both long term and midterm. The idea is that, if long term, mid term and current time frame all agree on traidng direction, the trade will take place. I also uses it in my automated trading bot with good result. www.tradingview.comPine Script® strategyby yongyuth.rootwararit88513
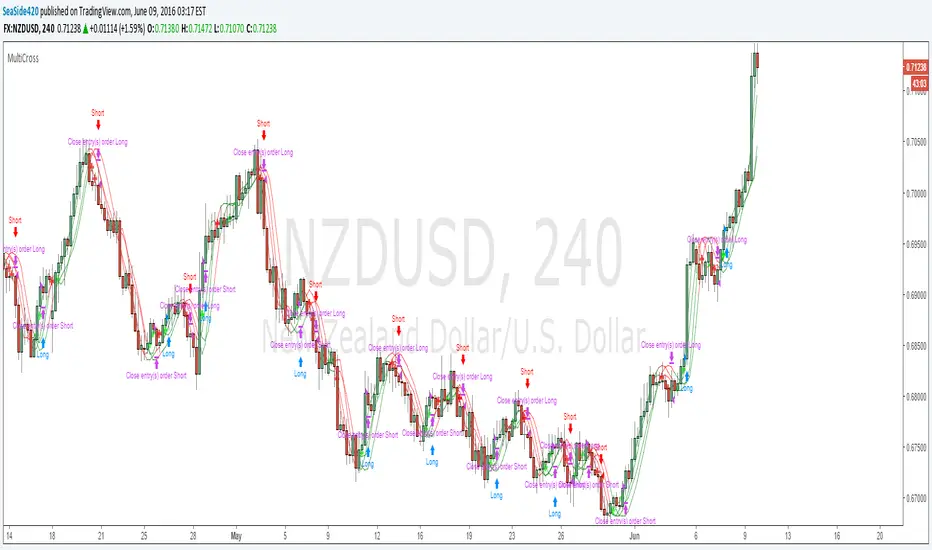
MultiCross v4.20Quad-HullMA-cross & VWMA & MacD & TSI combination Version 4.20 added script for strategy settings to be already correct when strategy loads onto chart: calc_on_order_fills= true, calc_on_every_tick=true, default_qty_type=strategy.percent_of_equity, default_qty_value=100, pyramiding=0Pine Script® strategyby SeaSide4201515804
MultiCrossQuad-HullMA-cross & VWMA & MacD & TSI combination Made for 4H - other timeframes unkown result.Pine Script® strategyby SeaSide420346
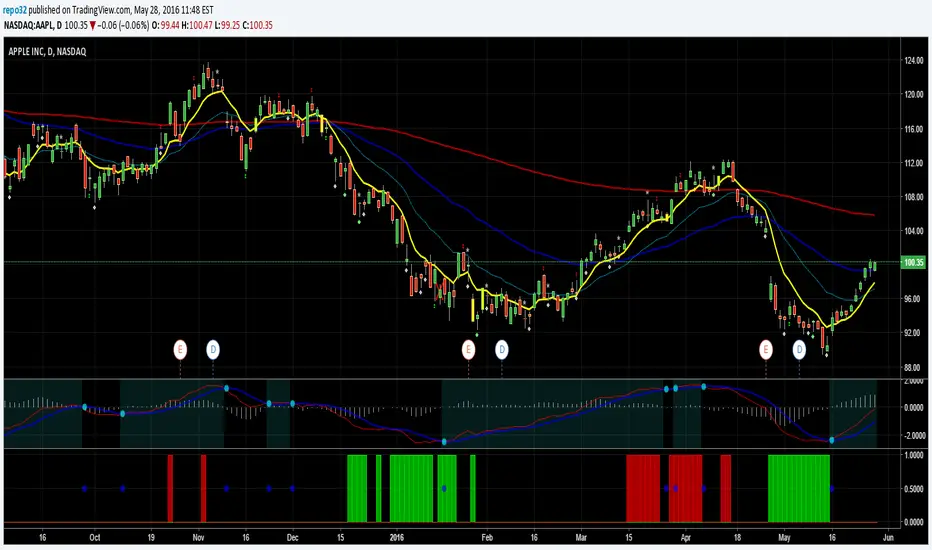
Rob RSI Stoch MACD Combo Alert//Created by Robert Nance on 5/28/16. Additional credit to vdubus. //This was a special request from rich15stan. It combines my original RSI Stoch extremes with vdubus’ MACD VXI. //This script will give you red or green columns as an indication for oversold/overbought, //based upon the rsi and stochastic both being at certain levels. The default oversold is at 35. //If Stochastic and RSI fall below 35, you will get a green column. Play with your levels to see how //your stock reacts. It now adds the MACD crossover, plotted as a blue circle. Pine Script® indicatorby repo3299 1.4 K