Full Swing Gold Vwap Macd SMO StrategyThis is a full strategy designed for gold market using 12h timeframe chart.
Its components are:
VWAP monthly
SMO oscillator
MACD histogram
Rules for entry:
For long: when enter when close of the candle is above vwap monthly, current histogram is higher than the previous one and SMO oscillator is above 0
For long: when enter when close of the candle is below vwap monthly, current histogram is lower than the previous one and SMO oscillator is below 0
Rules for exit:
We exit the trade if we get a reverse condition.
We also exit the trade based on a risk management system, both for SL and TP using % movements.
If you have any questions let me know !
Market

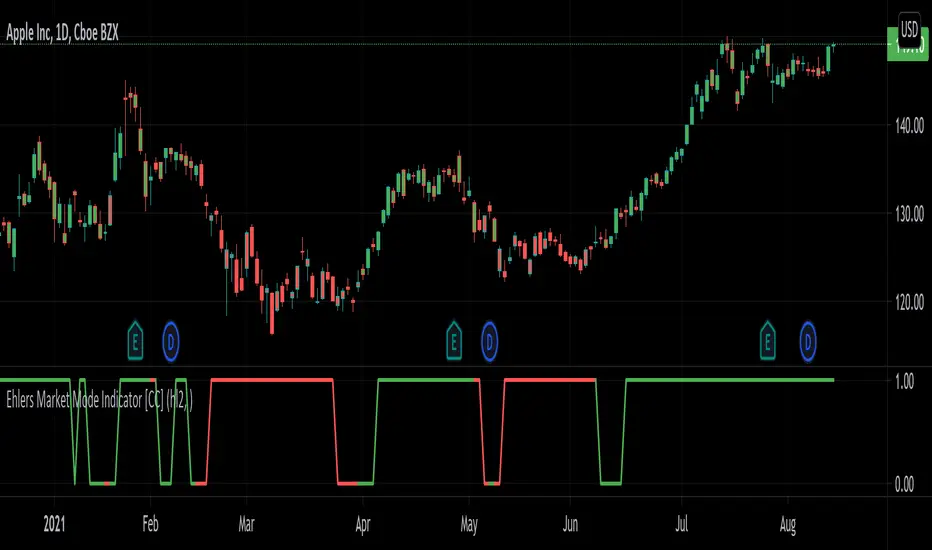
Ehlers Market Mode Indicator [CC]The Market Mode Indicator was created by John Ehlers (Rocket Science For Traders pgs 114-117) and this is a handy tool that will tell you if the market is currently in a cycle or a trend. When the current market is in a cycle or choppy state then the indicator will read 0 and when it is in a trend then it will read 1. He uses some advanced digital signal processing to figure out the current trend and for how long it has been trending. I have included buy and sell signals using the trendline and so buy when the line turns green and sell when it turns red. Let me know if this indicator is useful for you.
Let me know if there are any other indicators you would like to see me publish!
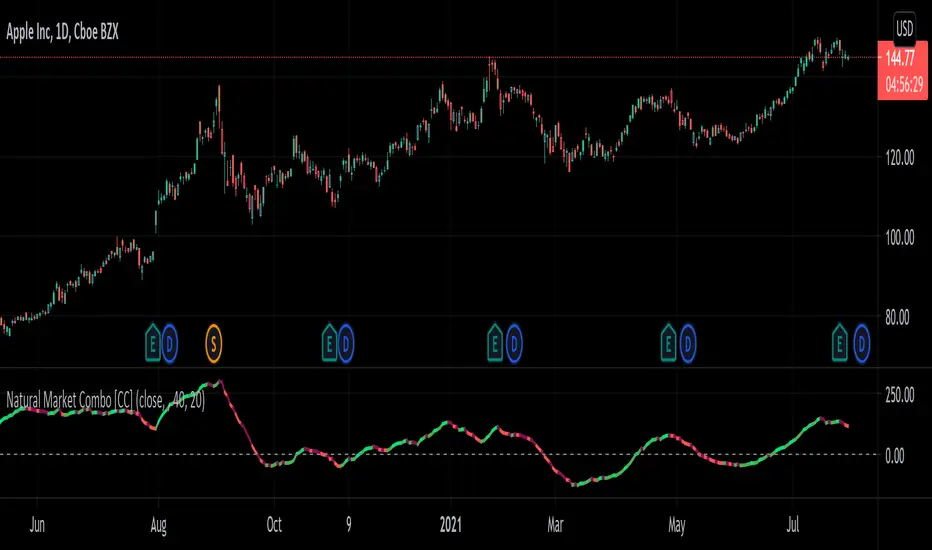
Natural Market Combo [CC]The Natural Market Combo was created by Jim Sloman and this is another one of my Ocean series of indicators to provide his full life's work free of charge to everyone. Just as the name implies, this is a combination of his two market indicators ( Natural Market River and Natural Market Mirror ) and this is a momentum indicator like the others. Big thanks to @altcoinz and @tmac87 for providing me the full source code and documentation to be able to publish all of Jim's work. This indicator is very simple to understand in that it takes the 2 market indicators and creates his own average of both indicators then smooths the result. I did fix an error that he didn't account for in his original script so the results are much more accurate. I have included strong buy and sell signals as darker colors and normal buy and sell signals as normal colors. Buy when the line turns green and sell when it turns red.
Let me know if there are any other indicators or scripts you would like to see me publish!
Market breadth Percentage of stocks above MA of various indexesPercentage of stock above moving average is a common market breadth indicator. This script can show multiple lines of percentage of stock above different moving average (5,20,50,100,150,200) of different US indexes.

Natural Market River [CC]The Natural Market River was created by Jim Sloman (Ocean Theory pgs 59-62) and this is another momentum indicator that is extremely similar to the previous indicator I published, the Natural Market Mirror . This has almost identical buy and sell signals but different way to handle calculations so I'm going to leave it up to you which one you will prefer. Since this is almost identical, the buy and sell signals work in the same way with both strong signals and normal ones. Buy when the line turns green and sell when it turns red.
Let me know what other indicators you would like to see me publish!

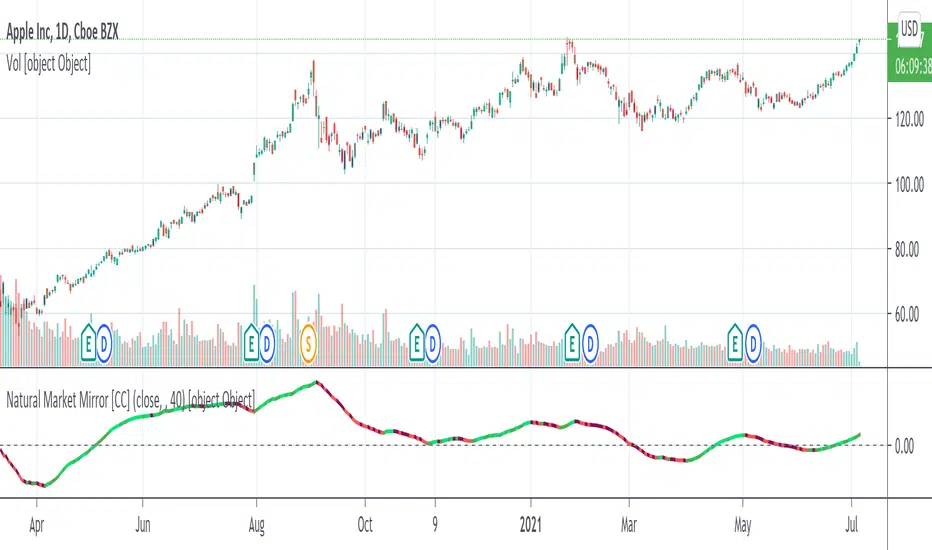
Natural Market Mirror [CC]The Natural Market Mirror was created by Jim Sloman (Ocean Theory pgs 49-57) and this is a continuation of my series from Jim Sloman's indicators. This indicator is also a momentum indicator and is very similar to the previous indicator I published, the Ocean Indicator and of course this indicator is built using ideas from the Ocean indicator. It may just be my opinion but I feel like this indicator provides better buy and sell signals in comparison. I built this using strong buy and sell indicators in addition to normal ones so darker colors are the strong signals and lighter colors are the normal signals. Buy when the line turns green and sell when it turns red.
Let me know what other indicators you would like me to publish!
BTC > bull market supportPlots the natural log of the price divided by the 20w SMA and 21w EMA, color coded by the Bitcoin price (green if above, red if below). Use this when comparing Altcoins to Bitcoin's performance. Works in daily & weekly timeframes only!

CM_Twiggs Money FlowFull Credit goes to LazyBear for publishing Original Code.
I added:
Threshold lines that changes the color of Histogram based on if it exceeds Threshold lines. Ability to turn off and on.
Ability to Turn Histogram Off/On
Ability to turn Twiggs Money Flow Line Off/On

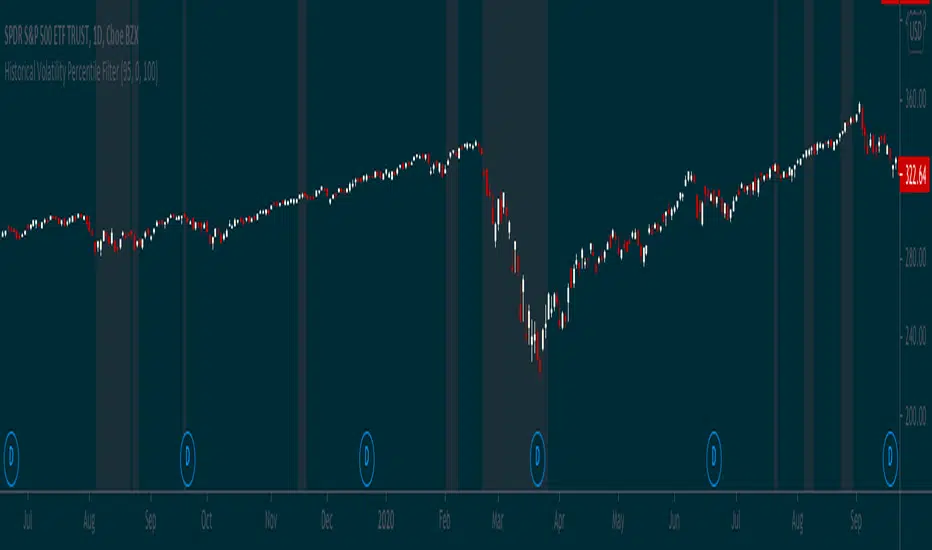
Simple way to BEAT the market [STRATEGY]This script has been created to demonstrate the effectiveness of using market regime filters in your trading strategy, and how they can improve your returns and lower your drawdowns
This strategy adds a simple filter (A historical volatility percentile filter, an implementation of which can be found on my trading profile) to a traditional buy and hold strategy of the index SPY.
Note, There are other filters that could also be added including a long-term moving average/percentile rank filter/ADX filter etc, to improve the returns further.
The filter closes our long position during periods of volatility that exceed the 95th percentile (or in the top 5% of volatile days) and buys back when the volatility is below 95% rank of the past 100 days
Have included the backtest results since 1993 which is 28 years of data at the time of writing. Comparison of traditional buy and hold with this modified strategy can be found below:
Traditional buy and hold:
Return per year: 7.95 % (ex Dividends)
Total return: 851.1 %
Max drawdown: 50.79 %
'Modified' buy and hold (this script):
Return per year: 9.92 % (ex Dividends)
Total return: 1412.2 %
Max drawdown: 31.57 %
Feel free to use some of the market filters in my trading profile to improve and refine your strategies further, or make a copy and play around with the code yourself. This is just a simple example for demo purposes.

Percentile Rank Market FilterA simple script to filter bull and bear markets by using percentile rank filter. Using market regimes to filter by bull/bear/sideways markets helps to understand how your strategy will
behave in various market regimes and allows you to avoid unprofitable regimes and only trade in profitable ones.
The idea of market regime filtering is used in the most successful technical algorithmic trading strategies, as one should always design a trading strategy with a particular market in mind according to trading legend, Larry Connors
Feel free to use this script in your strategies to improve your profits and lower drawdowns.

Historical Volatility Percentile FilterThis indicator provides a simple market regime filter for Historical Volatility. Depending on the strategy that you are using, it is useful to know how your strategy will perform at different
ranges of volatility, as this can greatly impact your performance. For instance, some of my long-only mean reversion strategies will only take trades where the volatility percentile is not extremely high, as this can often indicate fundamental changes in the security or the start of a big market correction. Some strategies may work better when volatility is higher
Feel free to use the following code along with your strategies to help improve performance and reduce the volatility of your gains in the long term.
Market Cap - simpleThis is a simple market cap indicator . it allows you to see the actual market cap of a stock, live, on the chart, right next to the stock price.
The indicator uses the data provided by Tradingview to calculate the market cap based on the simple calculation of outstanding shares times the price, at any given time.
The indicator can be used to compare the actual value of a stock at different times when sometimes you might discover that the market cap when the price is low is actually higher than the market cap when the price was high. That scenario might happen when the amount of outstanding shares has been changed as time goes by.
That conclusion is another nice benefit to having the indicator, on top of just having the Market Cap right in front of your eyes, always up-to-date, changing as the price is changing as well.
transparency= the higher the value, the more transparent the indicator will be. this feature allows you to see the indicator if you want to, but not letting it interrupting your chart.
Hope you enjoy it and good luck!


Initial Balance Markets Time ZonesThe below script is based on Initial Balance.
Initial Balance is based on the highest and lowest points of Price Action (PA) within the first 60 minutes of trading. There is so much information available online, reference Initial Balance, that I have not provided a reference.
Most indicators I have seen have been solely based on UTC 0000 Initial Balance. My aim with this indicator was to be able to visualize how other time zones market openings Initial Balance affect PA.
The three market openings I chose to code in are:
London 0800 to 0900
New York 1430 to 1530
Asia 0000 to 0100
Within the script I have given the user the option to select to see with a green or red background when PA is above all zones Initial Balance high (green) or PA is below all zones Initial Balance low (red).
Alerts are also coded in, to prompt the user that PA has gone above or below as per above.
The Initial Balance high and lows also offer another form of areas of confluence.
Below are some examples of IB in action:
LTC
NULS
UNFI
DEXE

Pre and Market OpeningsPre and Market Openings is to enable you to quickly visualize the opening markets and how they could influence trading.
The below script has used the market time data from the below links:
Tokyo/Asia www.tradinghours.com
London www.tradinghours.com
New York www.tradinghours.com
The below script aims to plot:
Daily Asia Open
Weekly Asia Open
Daily London Open
Weekly London Open
Daily New York Open
Weekly New York Open
Using background colour it also shows market sessions (pre-market) for London and New York and regular for London, New York and Asia.
There is also plotted text for days of the week and sessions.
As you can see from the picture below that these market openings can act as support and resistance:
BTC
ETH

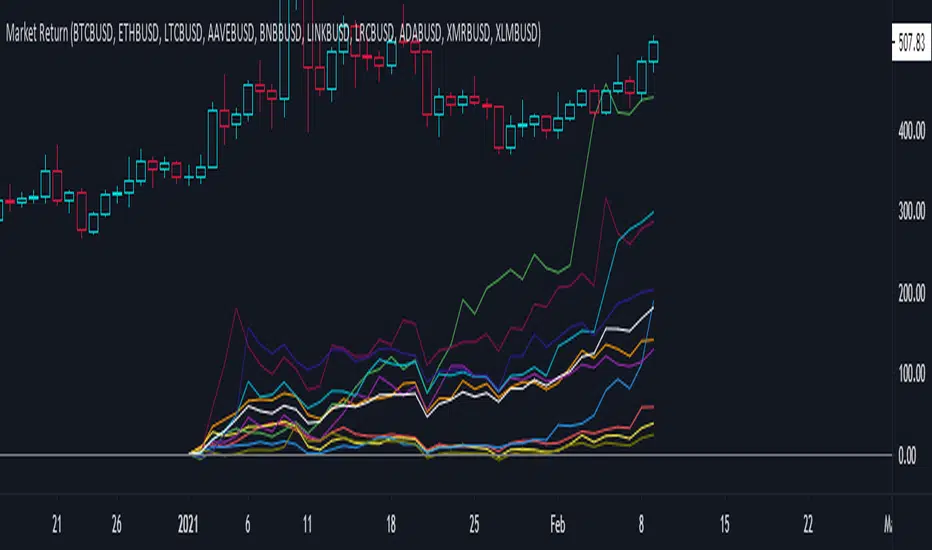
Market ReturnThis script calculates the market return for a specific period. It consists of two calculations which are:
1. Calculate market return of each asset - formula => (final value - initial value)/initial value
2. Calculate the aggregate average market return of chosen assets
The purpose of this script to see how much you would gain if you buy and hold the asset for a specific period.
Fundamental Metric to MarketThis script is supposed to be a quite basic way to find, from a fundamental standpoint, overvalue or undervalued stocks.
The script shows either Book to Market (inverse of P/B), EV /EBITDA, Earnings Yield (inverse of P/E) or Sales to Market (inverse of P/S).
For example, P/B is calculated as Close price / Book Value per share. As a contrarian investor you generally want to buy low P/B stocks and sell high P/B stocks. The problem is when a company has a negative Book Value. This might be the case when a company has written of a large amount of goodwill, which in turn wiped out their Book Value.
Instead you can use Book to Market, which is simply the inverse of P/B. It is calculated as Book Value per share / Close price. When using Book to Market you, generally, want to buy shares with high Book to Market values and sell those with low values. Because of the calculation, companies with negative Book Value will have negative Book to Market values and is therefore easy to identify.
The Fundamental Metric to Market indicator shows a colored background between the highest / lowest point of earlier values and the current value. When the background is mainly green the stock is probably undervalued, and the opposite is true when the background is red.
THIS IS NOT TRADING ADVICE, AND YOU SHOULD ALWAYS DO YOUR OWN RESEARCH
GOOD LUCK AND HAPPY TRADING

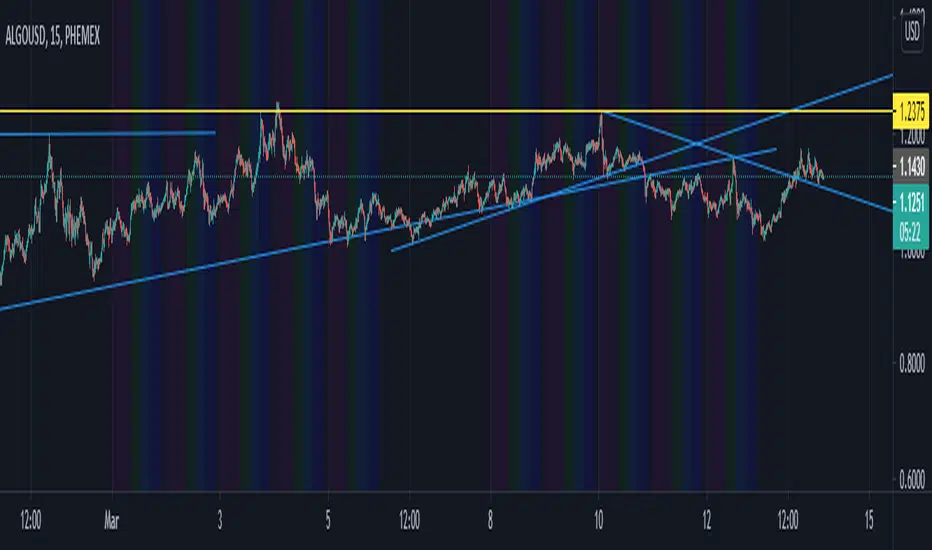
Simple Sessions## Background ##
Simple Sessions is based on the very awesome "Sessions on Chart" by Aurocks_AIF.
I really liked how the background colours worked but wanted to simplify it by removing some parts that I didn't use. I then simplified much of the code, put it into my standard template format and re-published. Hopefully the code is a bit cleaner and easier to read now.
## Usage ##
The default indicator shows the following sessions:
* Sydney in Navy
* Tokyo in Purple
* London in Green
* New York in Red
The good news is that using Green and Red for London and New York, gives a nice distinct yellow for the overlapping sessions. Sydney and Tokyo are by in similar colors by design.
By default, only London and New York show, but you may turn on Sydney and Tokyo in the settings.
## Use, Share, Like, etc #
Have fun!
-- chilts
Automated - Fibs with Market ordersThis script was recently shared for limit only orders here:
This version does not worry about keeping orders in the books and moving them around, instead it will simply market in and out.
I am sharing this to reveal the difference between the 2 setups.

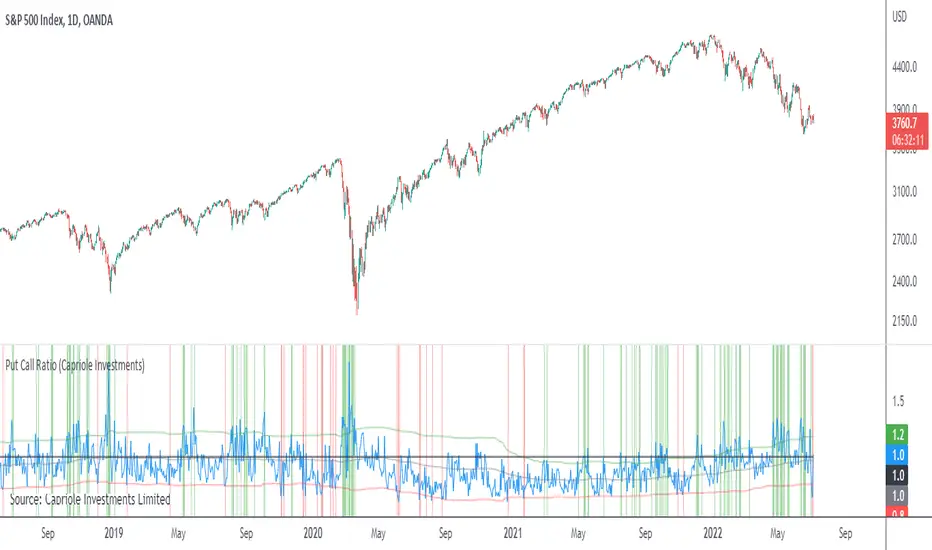
Put Call RatioPlots the CBOE Put Call Ratio and marks up locations of extremities.
Useful as a factor of confluence in identifying extremities in the market.
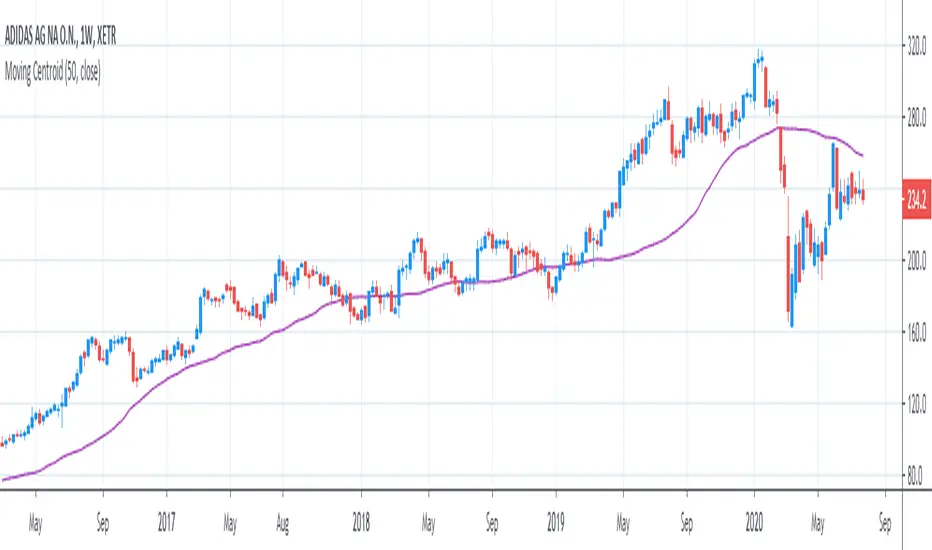
[R&D] Moving CentroidThis script utilizes this concept. Instead of weighting by volume, it weights by amount of price action on every close price of the rolling window. I assume it can be used as an additional reference point for price mode and price antimode.
it is directly connected with Market (not volume) profile, or TPO charts.
The algorithm:
1) takes a rolling window of, for example, 50 data points of close prices:
2) for each of this closing prices, the algorithm will check how many bars touched this close price.
3) then: sum of datapoints * weights/sum of weights
Since the logic is implemented in pretty non-efficient way, the script sometimes can take time to make calculations. Moreover, it calculates the centroid taking into account only close prices, not every tick. of a given rolling window That's why it's still experimental.
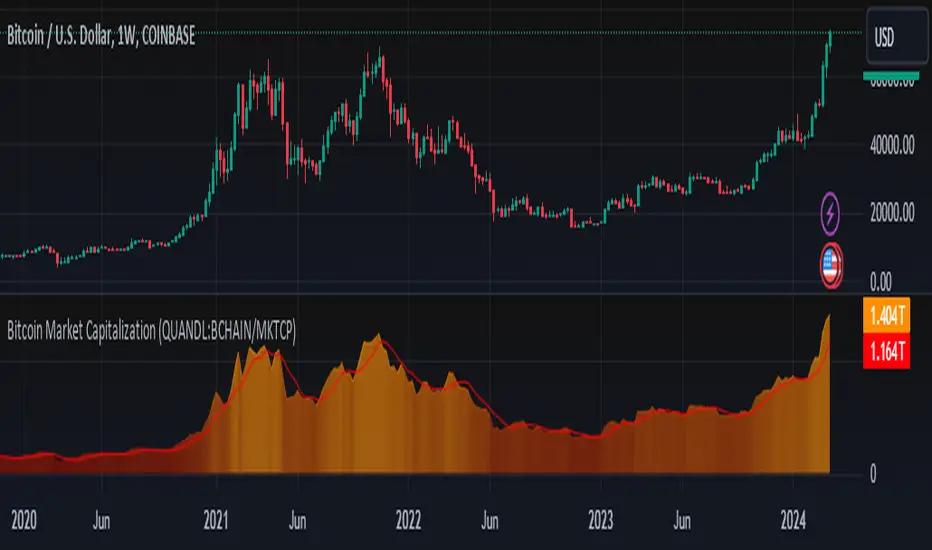
Bitcoin Market Capitalization (QUANDL:BCHAIN/MKTCP)Simple script that graphically represents the Bitcoin Market Capitalization
Blockchain data made available at QUANDL .
Its logic is simple, search the data in the QUANDL database and plot it on the chart.