52SIGNAL RECIPE Whale Smart Money Detector52SIGNAL RECIPE Whale Smart Money Detector
◆ Overview
52SIGNAL RECIPE Whale Smart Money Detector is an innovative indicator that detects the movements of whales (large investors) in the cryptocurrency market in real-time. This powerful tool tracks large-scale trading activities that significantly impact the market, providing valuable signals before important market direction changes occur. It can be applied to any cryptocurrency chart, allowing traders to follow the movements of big money anytime, anywhere.
The unique strength of this indicator lies in its comprehensive analysis of volume surges, price volatility, and trend strength to accurately capture whale market entries and exits. By providing clear visual representation of large fund flow data that is difficult for ordinary traders to detect, you gain the opportunity to move alongside the big players in the market.
─────────────────────────────────────
◆ Key Features
• Whale Activity Detection System: Analyzes volume surges and price impacts to capture large investor movements in real-time
• Precise Volume Analysis: Distinguishes between regular volume and whale volume to track only meaningful market movements
• Market Impact Measurement: Quantifies and analyzes the real impact of whale buying/selling on the market
• Continuity Tracking: Follows market direction continuity after whale activity to confirm signal validity
• Intuitive Visualization: Easily identifies whale activity points through color bar charts and clear labels
• Trend Strength Display: Calculates and displays current market buy/sell strength in real-time in a table
• Whale Signal Filtering: Applies multiple filtering systems to detect only genuine whale activity
• Customizable Sensitivity Settings: Offers flexible parameters to adjust whale detection sensitivity according to market conditions
─────────────────────────────────────
◆ Understanding Signal Types
■ Whale Buy Signal
• Definition: Occurs when volume increases significantly above average, immediate volume impact is large, and price rises beyond normal volatility
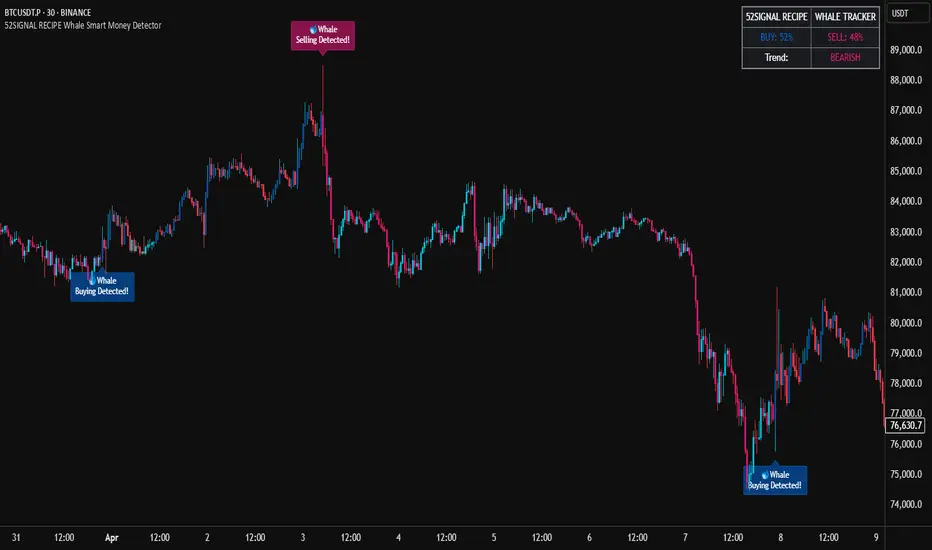
• Visual Representation: Translucent blue bar coloring with "🐋Whale Buying Detected!" label on the candle where the buy signal occurs
• Market Interpretation: Indicates that large funds are actively buying the coin, which is likely to lead to price increases
■ Whale Sell Signal
• Definition: Occurs when volume increases significantly above average, immediate volume impact is large, and price falls beyond normal volatility
• Visual Representation: Translucent pink bar coloring with "🐋Whale Selling Detected!" label on the candle where the sell signal occurs
• Market Interpretation: Indicates that large funds are actively selling the coin, which is likely to lead to price decreases
─────────────────────────────────────
◆ Understanding Trend Analysis
■ Trend Analysis Method
• Definition: Measures current trend and strength by analyzing the ratio of up/down candles over a set period
• Visual Representation: Displayed in the table as "BUY" and "SELL" percentages, with the current trend clearly marked as "BULLISH", "BEARISH", or "NEUTRAL"
• Calculation Method:
▶ Buy ratio = (Number of up candles) / (Total analysis period)
▶ Sell ratio = (Number of down candles) / (Total analysis period)
▶ Current trend determined by the dominant ratio as "BULLISH" or "BEARISH"
■ Trend Utilization Methods
• Whale Signal Confirmation: Signal reliability increases when whale signals align with the current trend
• Reversal Point Identification: Opposing whale signals during strong trends may indicate important reversal points
• Market Strength Assessment: Understand the balance of power in the current market through buy/sell ratios
• Signal Context Understanding: Consider trend information alongside whale signals for interpretation in a broader market context
─────────────────────────────────────
◆ Indicator Settings Guide
■ Key Setting Parameters
• Volume Impact Factor:
▶ Purpose: Sets the minimum multiplier for immediate volume impact to be considered whale activity
▶ Lower values: Generate more signals, detect smaller whales
▶ Higher values: Fewer signals, detect only very large whales
▶ Recommended range: 2.0-4.0 (adjust according to market conditions)
• Sensitivity Factor:
▶ Purpose: Adjusts sensitivity of price movement relative to normal volatility
▶ Lower values: Increased sensitivity, more signals generated
▶ Higher values: Decreased sensitivity, only stronger price impacts detected
▶ Recommended range: 0.2-0.5 (set higher in highly volatile markets)
• Trend Analysis Period:
▶ Purpose: Sets the number of candles to calculate buy/sell ratios
▶ Lower values: More responsive to recent trends
▶ Higher values: More stable analysis considering longer-term trends
▶ Recommended range: 30-70 (adjust according to trading style)
─────────────────────────────────────
◆ Synergy with Other Indicators
• Key Support/Resistance Levels:
▶ Whale signals occurring near important technical levels have higher reliability
▶ Coincidence of weekly/monthly pivot points and whale signals confirms important price points
• Moving Averages:
▶ Pay attention to whale signals near key moving averages (50MA, 200MA)
▶ Simultaneous occurrence of moving average breakouts and whale signals indicates important technical events
• Volume Profile:
▶ Whale activity near high volume nodes confirms important price levels
▶ Whale signals at low volume nodes may indicate possibility of rapid price movements
• Volatility Indicators:
▶ Whale signals after periods of low volatility may mark the beginning of new market movements
▶ Whale signals after Bollinger Band contraction may be precursors to large movements
• Market Structure:
▶ Whale signals near key market structures (higher highs/lows, lower highs/lows) suggest structural changes
▶ Coincidence of market structure changes and whale activity may signal important trend changes
─────────────────────────────────────
◆ Conclusion
52SIGNAL RECIPE Whale Smart Money Detector tracks the trading activities of large investors in the cryptocurrency market in real-time, providing traders with valuable insights. Because it can be applied to any cryptocurrency chart, you can utilize it immediately on your preferred trading platform.
The core value of this indicator is providing intuitive visualization of large fund flows that are easily missed by ordinary traders. By comprehensively analyzing volume surges, immediate price impacts, and trend continuity to accurately capture whale activity, you gain the opportunity to move alongside the big players in the market.
Clear buy/sell signals and real-time trend strength measurements help traders quickly grasp market conditions and understand market direction. By integrating this powerful tool into your trading system, gain insights into where the market's smart money is flowing for better market understanding.
─────────────────────────────────────
※ Disclaimer: Like all trading tools, the 52SIGNAL RECIPE Whale Smart Money Detector should be used as a supplementary indicator and not relied upon exclusively for trading decisions. Past patterns of whale behavior may not guarantee future market movements. Always employ appropriate risk management strategies in your trading.
52SIGNAL RECIPE Whale Smart Money Detector
◆ 개요
52SIGNAL RECIPE Whale Smart Money Detector는 암호화폐 시장에서 고래(대형 투자자)의 움직임을 실시간으로 감지하는 혁신적인 지표입니다. 이 강력한 도구는 시장에 큰 영향을 미치는 대규모 트레이딩 활동을 추적하여 중요한 시장 방향 전환이 일어나기 전에 귀중한 신호를 제공합니다. 모든 암호화폐 차트에 적용 가능하여 트레이더들이 언제 어디서든 대형 자금의 움직임을 따라갈 수 있게 해줍니다.
이 지표의 독보적인 강점은 거래량 급증, 가격 변동성, 그리고 추세 강도를 종합적으로 분석하여 고래의 시장 진입과 퇴출을 정확히 포착한다는 점입니다. 일반 트레이더들이 놓치기 쉬운 대형 자금의 흐름 데이터를 시각적으로 명확하게 제공함으로써, 여러분은 시장의 큰 손들과 함께 움직일 수 있는 기회를 얻게 됩니다.
─────────────────────────────────────
◆ 주요 특징
• 고래 활동 감지 시스템: 거래량 급증과 가격 임팩트를 분석하여 대형 투자자의 움직임을 실시간으로 포착
• 정밀한 거래량 분석: 일반 거래량과 고래 거래량을 구분하여 의미 있는 시장 움직임만 추적
• 시장 영향력 측정: 고래의 매수/매도가 시장에 미치는 실질적 영향력을 수치화하여 분석
• 연속성 추적: 고래 활동 이후 시장 방향의 지속성을 추적하여 신호의 유효성 확인
• 직관적 시각화: 컬러 바 차트와 명확한 라벨을 통해 고래 활동 지점을 쉽게 식별
• 추세 강도 표시: 현재 시장의 매수/매도 강도를 실시간으로 계산하여 테이블에 표시
• 고래 신호 필터링: 진정한 고래 활동만 감지하도록 다중 필터링 시스템 적용
• 맞춤형 감도 설정: 시장 상황에 따라 고래 감지 감도를 조절할 수 있는 유연한 파라미터 제공
─────────────────────────────────────
◆ 신호 유형 이해하기
■ 고래 매수 신호
• 정의: 거래량이 평균보다 크게 증가하고, 즉각적인 거래량 충격이 크며, 가격이 정상 변동성을 초과하여 상승할 때 발생
• 시각적 표현: 매수 신호가 발생한 캔들에 반투명 파란색 바 컬러링과 함께 "🐋Whale Buying Detected!" 라벨 표시
• 시장 해석: 대형 자금이 적극적으로 코인을 매수하고 있으며, 이는 곧 가격 상승으로 이어질 가능성이 높음을 의미
■ 고래 매도 신호
• 정의: 거래량이 평균보다 크게 증가하고, 즉각적인 거래량 충격이 크며, 가격이 정상 변동성을 초과하여 하락할 때 발생
• 시각적 표현: 매도 신호가 발생한 캔들에 반투명 분홍색 바 컬러링과 함께 "🐋Whale Selling Detected!" 라벨 표시
• 시장 해석: 대형 자금이 적극적으로 코인을 매도하고 있으며, 이는 곧 가격 하락으로 이어질 가능성이 높음을 의미
─────────────────────────────────────
◆ 추세 분석 이해하기
■ 추세 분석 방식
• 정의: 설정된 기간 동안의 상승/하락 캔들 비율을 분석하여 시장의 현재 추세와 강도를 측정
• 시각적 표현: 테이블에 "BUY"와 "SELL" 비율이 백분율로 표시되며, 현재 추세가 "BULLISH", "BEARISH" 또는 "NEUTRAL"로 명확하게 표시됨
• 계산 방식:
▶ 매수 비율 = (상승 캔들 수) / (전체 분석 기간)
▶ 매도 비율 = (하락 캔들 수) / (전체 분석 기간)
▶ 우세한 비율에 따라 "BULLISH" 또는 "BEARISH" 추세 결정
■ 추세 활용 방법
• 고래 신호 확인: 고래 신호가 현재 추세와 일치할 때 신호의 신뢰도가 높아짐
• 반전 포인트 식별: 강한 추세 속에서 발생하는 반대 방향의 고래 신호는 중요한 반전 포인트일 수 있음
• 시장 강도 평가: 매수/매도 비율을 통해 현재 시장의 세력 균형 파악
• 신호 발생 맥락 이해: 추세 정보와 고래 신호를 함께 고려하여 더 넓은 시장 컨텍스트에서 해석
─────────────────────────────────────
◆ 지표 설정 가이드
■ 주요 설정 매개변수
• Volume Impact Factor (거래량 임팩트 요소):
▶ 목적: 고래 활동으로 간주할 즉각적인 거래량 충격의 최소 배수 설정
▶ 낮은 값: 더 많은 신호 생성, 작은 고래도 감지
▶ 높은 값: 더 적은 신호, 매우 큰 고래만 감지
▶ 권장 범위: 2.0-4.0 (시장 상황에 따라 조정)
• Sensitivity Factor (민감도 요소):
▶ 목적: 정상 변동성 대비 가격 변동의 민감도 조절
▶ 낮은 값: 민감도 증가, 더 많은 신호 생성
▶ 높은 값: 민감도 감소, 더 강한 가격 충격만 감지
▶ 권장 범위: 0.2-0.5 (변동성이 높은 시장에서는 높게 설정)
• Trend Analysis Period (추세 분석 기간):
▶ 목적: 매수/매도 비율을 계산할 캔들 수 설정
▶ 낮은 값: 최근 추세에 더 민감하게 반응
▶ 높은 값: 더 긴 기간의 추세를 고려하여 안정적인 분석
▶ 권장 범위: 30-70 (트레이딩 스타일에 따라 조정)
─────────────────────────────────────
◆ 다른 지표와의 시너지
• 주요 지지/저항 레벨:
▶ 중요한 기술적 레벨 근처에서 발생하는 고래 신호는 더 높은 신뢰도를 가짐
▶ 주간/월간 피봇 포인트와 고래 신호의 일치는 중요한 가격 지점을 확인해줌
• 이동평균선:
▶ 주요 이동평균선(50MA, 200MA) 근처에서 발생하는 고래 신호에 주목
▶ 이동평균선 돌파와 고래 신호가 동시 발생 시 중요한 기술적 이벤트 확인
• 볼륨 프로필:
▶ 높은 볼륨 노드 근처에서의 고래 활동은 중요한 가격 레벨 확인
▶ 낮은 볼륨 노드에서 발생하는 고래 신호는 급격한 가격 이동 가능성 암시
• 변동성 지표:
▶ 낮은 변동성 구간 이후 발생하는 고래 신호는 새로운 시장 움직임의 시작일 수 있음
▶ 볼린저 밴드 수축 후 발생하는 고래 신호는 큰 움직임의 전조일 수 있음
• 시장 구조:
▶ 주요 시장 구조(높은 고점/저점, 낮은 고점/저점) 근처에서 발생하는 고래 신호는 구조 변화 암시
▶ 시장 구조 변화와 고래 활동의 일치는 중요한 트렌드 변화 신호일 수 있음
─────────────────────────────────────
◆ 결론
52SIGNAL RECIPE Whale Smart Money Detector는 암호화폐 시장에서 대형 투자자들의 거래 활동을 실시간으로 추적하여 트레이더들에게 귀중한 통찰력을 제공합니다. 모든 암호화폐 차트에 적용 가능하기 때문에, 여러분이 선호하는 트레이딩 플랫폼에서 바로 활용할 수 있습니다.
이 지표의 핵심 가치는 일반 트레이더들이 놓치기 쉬운 대형 자금의 흐름을 직관적으로 시각화하여 제공한다는 점입니다. 거래량 급증, 즉각적인 가격 충격, 그리고 추세 지속성을 종합적으로 분석하여 고래의 활동을 정확히 포착함으로써, 여러분은 시장을 움직이는 큰 손들과 함께할 수 있는 기회를 얻게 됩니다.
명확한 매수/매도 신호와 실시간 추세 강도 측정은 트레이더들이 시장 상황을 한눈에 파악하고 시장의 방향성을 이해하는 데 도움을 줍니다. 이 강력한 도구를 여러분의 트레이딩 시스템에 통합함으로써, 시장의 스마트 머니가 어디로 흘러가는지 파악하고 더 나은 통찰력을 얻으세요.
─────────────────────────────────────
※ 면책 조항: 모든 트레이딩 도구와 마찬가지로, 52SIGNAL RECIPE Whale Smart Money Detector는 보조 지표로 사용해야 하며 트레이딩 결정을 전적으로 의존해서는 안 됩니다. 과거의 고래 행동 패턴이 미래 시장 움직임을 보장하지는 않습니다. 항상 적절한 리스크 관리 전략을 트레이딩에 활용하세요.
Marketmakers
Liquidation Levels V2 (Ultimate Edition)!(version 2.0) - Covers ALL pairs from Binance futures (USDT)!
The Liquidations Level Indicator is a new, fresh and innovative indicator that adds a new perspective into the charts.
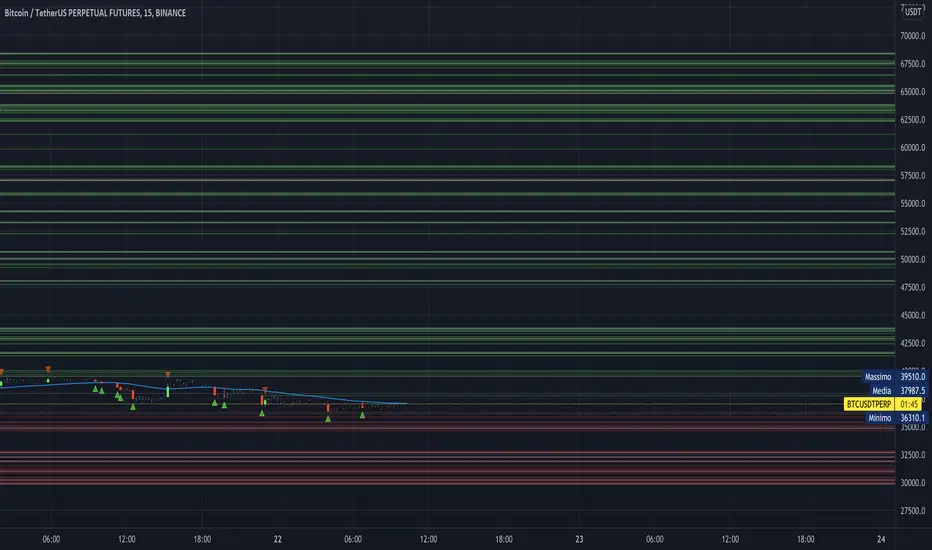
The indicator plots (in real time !), the liquidation points/levels that are "created" for every new position that is currently opened in futures trading of a cryptocurrency.
The calculation and the plots work for both directions (either longs or shorts).
How it is done: We calculate all new large positions opened by other traders, by taking into account the Open Interest from major exchanges.
For each new large position that is opened, the indicator plots in the chart the liquidation levels for the specific position per leverage level (100x, 50x or 25x).
This is exactly what the Market Maker knows!
In crypto, the Market Maker, tends to push the price to these levels, making these levels targets.
You could combined it with any other Technical Analysis indicator you used to trade.
Add it to your favorites indicators and enjoy the price action. You will soon realize that our indicator can be a game-changer indicator !
Soon, we will add some here in TradingView, some ideas and strategies that we have already used with this indicator with success.
Here, a new game starts for you..and the Market Maker. Don't trade against him, trade with him (!)
_____________________________
Notes:
_____________________________
1) Second version supports allt the USDT crypto that are tradable on Binance futures (at least).
Right now you can use any of them (e.g. BTC , ETH, BNB, XRP, ADA, SOL, DOT, DOGE, MATIC, LTC, ATOM, , etc. )
paired with one of the above stablecoins:
USD, USDT, USDC , or BUSD.
2) You can adjust the lower limit to take into account for new positions (total amount is in millions USD/USDT/ USDC ), so you can filter the positions and display only the large ones.
This adjustment is up to you and it is different for each coin, as they have huge differences in Total Market Cap and the Total amount trading per day.
BTC is almost always first, and then ETH, Luna, etc. From our experience a amount of 5m in USD fits for BTC , 2m USD for ETH, and you can of course switch it.
3) Don't use the indicator with any other pair, except the above ( /USD, /USDT, /BUSD or / USDC ). The Open Interest is calculated per USD, so if you project this over a crazy pair (e.g. BTC /LTC) it will not project anything.
4) Initial version supports reading the Open Interest from Binance. Upcoming versions will expand this, as an option.
_____________________________
Extras:
_____________________________
This was our first effort to build something for the crypto community, that can be useful and of course free.
We hope we like it. If you like the indicator, just spread it.

MarketMaker Method [ShiftCandles]This indicator is based on the idea that prices are generated by the interaction between a Market Maker on one side (sometimes also called the "Composite Man") and Retail Traders on the other side (Retail Traders include simple retail, professional traders, whales, institutions...as a single entity).
These two opposite entities "play" the trading game on trading platforms/exchanges (crypto), which are neutral to the game.
Market makers are liquidity providers, and make profits either by charging a spread between buy and sell prices, and (also) by trapping retail traders into specific positions.
Trading is a "zero sum" game in the sense that it generates a transfer of resources between these two specific players, which are indeed the Market Maker and Retail Traders. If Retail Traders are in profit, Market Maker is (temporarily) in loss, and viceversa. Market Maker goal is to squeeze profits out of Retail Traders, by inducing them to take wrong positions.
The Market Maker Method Indicator executes the following:
1) Identifies and plots candles that are generated by the Market Maker's moves (called "Shift Candles"); shift candles are "artificial" price/volumes moves, generated to induce retail traders into specific zones which are, essentially, traps. They are called Shift Candles as they generate abnormal (and mostly unexpected) price movements in either direction. They move the price from one zone to the next to execute the Market Maker strategy. Observe how often sudden (apparent) prices increases are followed by price crashes (stop hunt rise, drop); and observe how often sudden (apparent) price collapses are followed by price uptrends (stop hunt low, rise); sometimes these movements are made in progressive steps (generally, 3).
2) Fires open long/open short alerts based on the assumption that when Market Maker plots upwards shift candles, vivid green color, they are preparing for an upcoming price reversal (down); same, but opposite sign, for downwards shift candles. This is a counterintuitive logic for Retail Traders, that generally open long when price is rising, and open shorts when price is falling - jumping into Market Makers traps.
3) Plots the areas where price is expected to return (upwards or downwards) based on previous shift candles (called "Recovery Zones")
The script will be further developed to prevent early open long/open short alerts, trying to catch the Market Makers cycles in a more detailed way (to account for situations where artificial price moves are executed in consecutive steps, instead of single candles).
You can use this indicator on any timeframe and for any asset.
You can connect the open long/open short alerts to trading bots to execute automatic trades.
DCA_PREMIUMOur new indicator tracks trends to create buy and sell alerts, see below how it works.
HOW IT WORKS:
It uses RMA which is the same moving average used by RSI and HMA, they intersect give us an entry signal, be it a buy or sell, as the entry signal the script will color the bars according to the signal.
When a GREEN candle appears, it indicates a large purchase volume and when a PURPLE candle appears, it indicates a large sales volume.
The indicator will alert for entries only according to the trend of the traded asset
FOR EXAMPLE:
I am trading USDJPY in an uptrend, the indicator will only alert me for buy entries, if it applies to downtrend.
DASHBOARD:
Our dashboard indicates the volatility of the traded asset, the short-term trend and the trade signal.
HOW TO USE:
Choose the asset you want to trade and, in the settings, change the time period you want for your trading style, for example: Swing Trade, Day Trade or Position.
See regions with large trading volumes indicating price manipulation or just supports and resistances too strong to break.

PVA Volume - DataCrypto Analytics
The PVA Volume indicator (Price Volume Analysis) is a technical indicator that transforms the accumulated historical data.
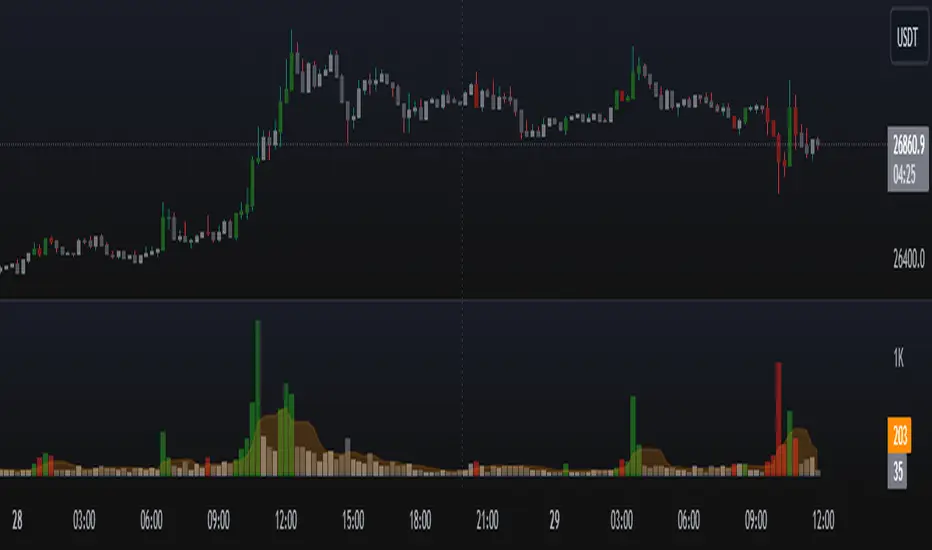
The PVA Volume Indicator displays a color-coded volume histogram based on Price Volume Analysis (PVA). It is plotted on a separate panel below the price chart of the underlying asset and colors the candles according to the PVA. The indicator represents four market states by means of four different colored histogram bars:
Green : Extreme volume on a bullish candle
Red : Extreme volume on a bearish candle
Silver : Neutral Volume, increasing more than the average
Gray : Neutral Volume
The PVA Volume indicator can be applied to confirm the action of the high or low price of any financial instrument.
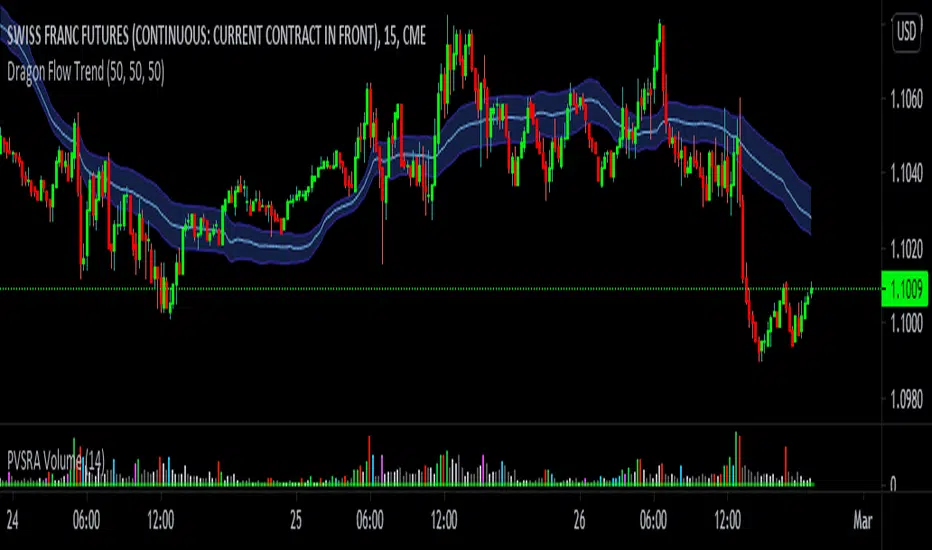
vDragon Flow Trend I will share one of the tools that I use daily with you. Based on PVSRA (a methodology developed by Trade at Home using, price action, volume wyckoff, support / resistance, trends all in one method), it is composed of exponential averages, which I think is plausible, however, it would not be more easy if the main moving average was not made with its own volume?
Having this idea, I created this indicator, but let’s its functions and WHY you don’t waste time and use this indicator once and for all. Firstly, we know that a moving average is used to identify long-term trends, but because it is a price indicator, it takes into account PRICE, that is, being a late indicator, that is, who looks at prices, looks back and not forward, so I decided to use moving averages weighted by volume, to then make this delay in the moving average decrease considerably.
What are the benefits of using vDragon Trend instead of a normal and convenient average.
* The benefit of this indicator is to track the flow of a long-term trend, being similar to the session's VWAP, for example, but as VWAP has a limitation of only being able to show the average price of Market Makers only on the intraday, vDragon can do this, even showing the average price of these players in the long run.
* It is a fast and accurate moving average, depending on the flow entering the market, its curve will be greater than an average that reflects the price.
* The band, can increase or decrease depending on the volatility and the volume that happens.
* It takes from the Maximum to the Minimum for a certain period, just so you don't fall into springs.
* Most moving averages are not efficient on fast graphs like ticks or 1-minute graphs, but vDragon manages to adapt the graphical time, thanks to the volume, which is where we located the performance of Smart Money, remembering, I tested the vDragon within a 15-second chart on the FDAX inside the EUREX bag, and it serves a lot.
* Perhaps the best support or resistance you will find, I can give you an example, if it happens that the price rises with remarkable volume on top of vDragon, it can possibly be characterized as an absorption, sometimes too;
* can be used to identify zones of HFTs or algorithms that work with average prices in liquidity regions, since volume is also liquidity.
* can be used to identify linked accumulations in the accumulation or distribution.
There are several things for you to use vDragon as a strategy, use in a way that fits your strategy or operational.
Remembering, this indicator is my authorship
© Victor Eduardo Meireles
available to tradingview for free, be wary of anyone trying to sell you this indicator.
MMP Indicator 4-step WeeklyFading levels using martingale (limit orders, rebate venue) with no stop-loss orders, long the wings at the end of Support and Resist levels from prior week Friday right before the close. Re-hedge the order book units when there is a breakout.
